Copyright
©The Author(s) 2017.
World J Diabetes. Jun 15, 2017; 8(6): 249-269
Published online Jun 15, 2017. doi: 10.4239/wjd.v8.i6.249
Published online Jun 15, 2017. doi: 10.4239/wjd.v8.i6.249
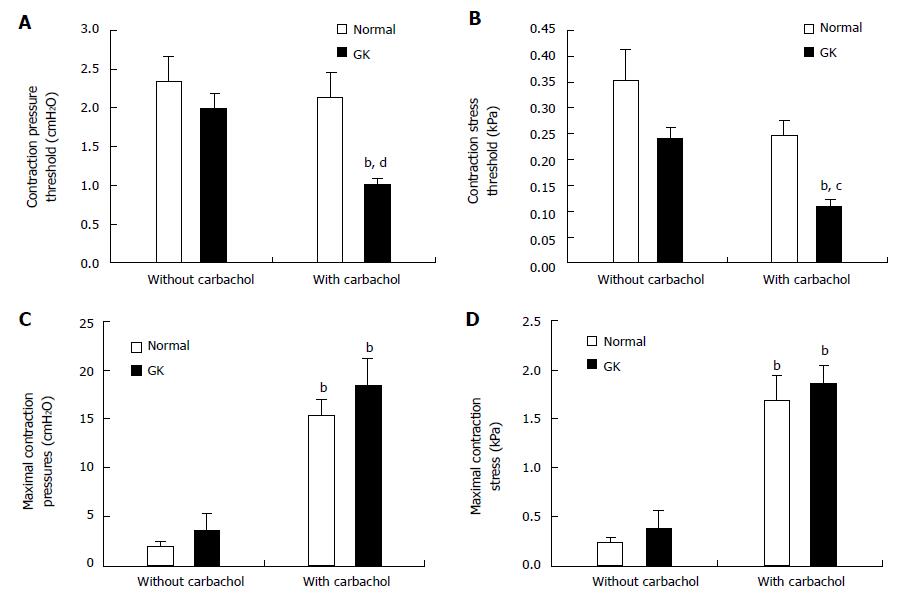
Figure 3 Jejunal contractility in response to flow and ramp distension in type 2 diabetic GK rats after carbachol stimulation.
Top figures showed the pressure (A) and circumferential stress (B) at the contraction threshold during ramp distensions. The pressure and stress thresholds were significantly decreased in GK group but not in Normal group after carbachol application (compared with without carbachol application, bP < 0.01). Furthermore, the pressure and stress thresholds were significantly smaller in the GK group than in Normal group after carbachol stimulation (compared with Normal group, cP < 0.05; dP < 0.01). Middle figures showed the maximum contraction pressure (C) and stress (D) during basic contraction. After carbachol application, the maximum contraction pressure and stress significantly increased both for Normal and GK groups (compared with without carbachol application bP < 0.01). Bottom figures showed the maximum contraction pressure (E) and stress (F) in the flow-induced contraction after carbachol application. Compared to the Normal group, the maximum contraction pressure and stress were significantly bigger at outlet pressure levels of 0 and 2.5 cmH2O in the GK group (cP < 0.05, dP < 0.01).
- Citation: Zhao M, Liao D, Zhao J. Diabetes-induced mechanophysiological changes in the small intestine and colon. World J Diabetes 2017; 8(6): 249-269
- URL: https://www.wjgnet.com/1948-9358/full/v8/i6/249.htm
- DOI: https://dx.doi.org/10.4239/wjd.v8.i6.249


