Copyright
©2013 Baishideng Publishing Group Co.
World J Gastrointest Oncol. Mar 15, 2013; 5(3): 50-59
Published online Mar 15, 2013. doi: 10.4251/wjgo.v5.i3.50
Published online Mar 15, 2013. doi: 10.4251/wjgo.v5.i3.50
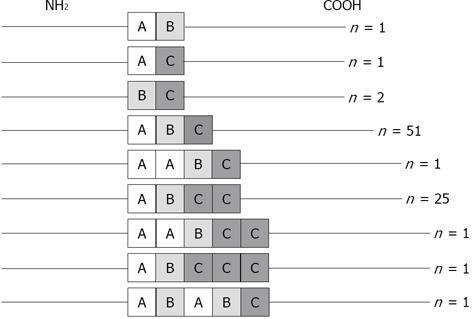
Figure 1 Helicobacter pylori CagA Glu-Pro-Ile-Tyr-Ala (EPIYA) motifs variations included in this study.
Eighty-four cagA-positive strains isolated from Colombian patients were evaluated. All strains possessed Western EPIYA motifs (A, B and C)[17] ranging from 2 to 5 in number.
Figure 2 Phosphorylation of CagA protein in AGS cells after coculture with Helicobacter pylori CagA-positive strains.
Cell lysates were evaluated by western blot using anti-phosphotyrosine or anti-CagA antibodies. A representative assay is shown. Lane 1: 11 637 control strain with a functional cagPAI and 5 Glu-Pro-Ile-Tyr-Ala (EPIYA) motifs (ABCCC); Lanes 2 and 6: Isolates with a defective cagPAI lacking expression of CagA; Lanes 7 and 8: Isolates with a defective cagPAI expressing CagA, with absence of CagA phosphorylation; Lanes 3-5: Isolates with a functional CagPAI with three (ABC; lane 3) or four (ABCC; lanes 4 and 5) EPIYA motifs; Lane 9: Uninfected AGS cells.
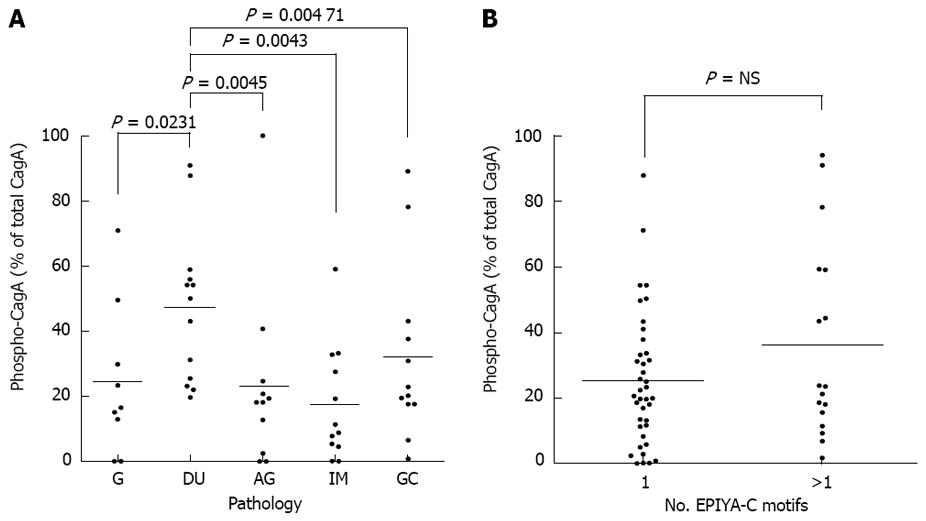
Figure 3 CagA-protein phosphorylation and its relationship to Glu-Pro-Ile-Tyr-Ala-C (EPIYA-C) motifs and disease severity.
Sixty functional-cagPAI strains were cocultured with AGS cells for 6 h. Coculture lysates were assessed by Western blot and levels of CagA phosphorylation were determined by densitometry. A: Evaluation of CagA phosphorylation levels according to the pathology from which strains were isolated; B: Relationship between the number of EPIYA motifs and the levels of CagA phosphorylation. G: Gastritis; DU: Duodenal ulcer; AG: Atrophic gastritis; IM: Intestinal metaplasia; GC: Gastric cancer. NS: Not significant
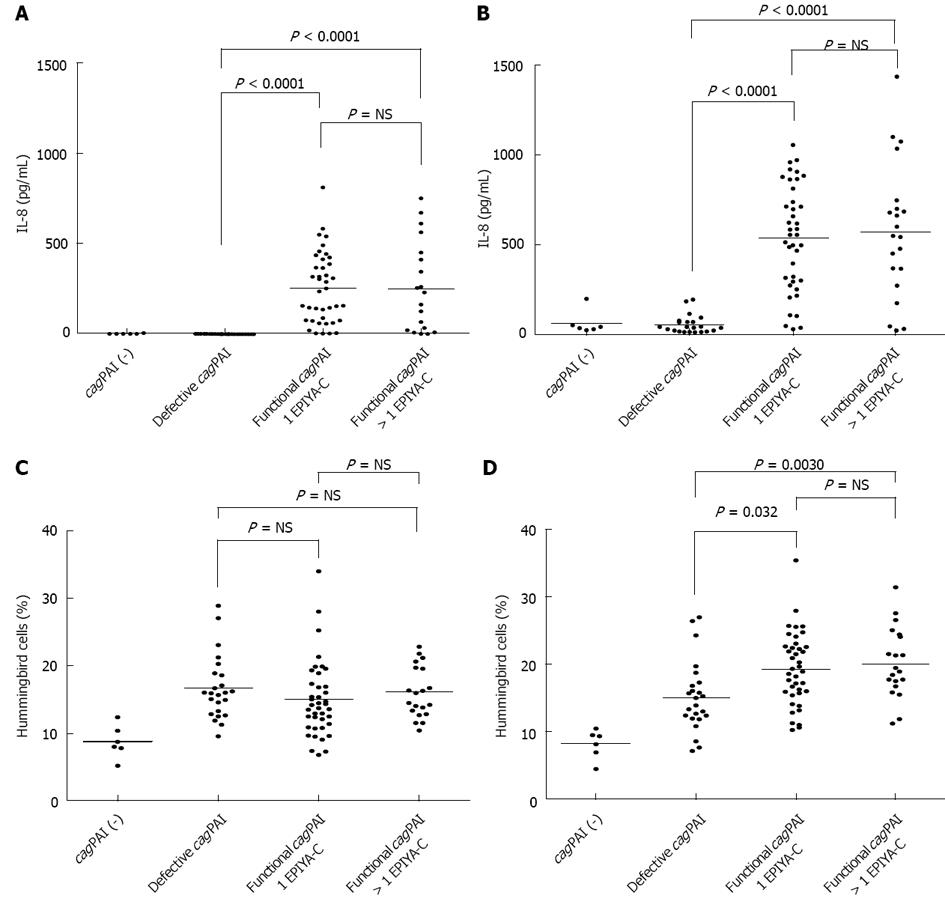
Figure 4 Influence of cagPAI status and CagA Glu-Pro-Ile-Tyr-Ala (EPIYA) motifs variations on interleukin-8 expression and cell elongation.
CagPAI-negative strains (n = 6), cagPAI-defective strains (n = 24) and functional-cagPAI strains with either one (n = 40) or more than one (n = 20) EPIYA-C motifs were cocultured with AGS cells. (A) 6 h and (B) 30 h coculture supernatants were collected and assessed for interleukin-8 concentration by ELISA. Mean values are represented by horizontal lines within the scatterplots. Experiments for each strain were run in duplicates; (C) 6 h and (D) 24 h coculture photographs were taken and the percentage of hummingbird cells was determined. Mean values are represented by horizontal lines within the scatterplots. Experiments for each strain were run in duplicates. NS: Not significant.
-
Citation: Fajardo CA, Quiroga AJ, Coronado A, Labrador K, Acosta N, Delgado P, Jaramillo C, Bravo MM. CagA EPIYA polymorphisms in Colombian
Helicobacter pylori strains and their influence on disease-associated cellular responses. World J Gastrointest Oncol 2013; 5(3): 50-59 - URL: https://www.wjgnet.com/1948-5204/full/v5/i3/50.htm
- DOI: https://dx.doi.org/10.4251/wjgo.v5.i3.50


