Copyright
©2005 Baishideng Publishing Group Inc.
World J Gastroenterol. Apr 28, 2005; 11(16): 2508-2512
Published online Apr 28, 2005. doi: 10.3748/wjg.v11.i16.2508
Published online Apr 28, 2005. doi: 10.3748/wjg.v11.i16.2508
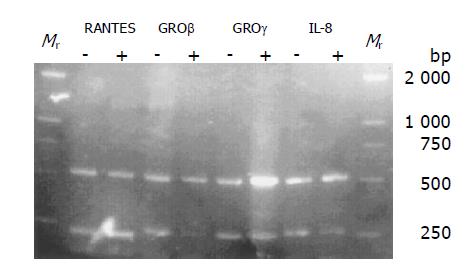
Figure 3 Primers and amplification of RT-PCR analysis.
The full names of the genes and their accession numbers are given in bold in Tables 1 and 2. Sense and anti-sense primers were used to detect mRNA expression of the indicated genes by RT-PCR. The last two columns give the quantity of total RNA added to each RT-PCR reaction and the number of PCR cycles for PCR amplification used for RT-PCR analysis in MCP-1 treated U937 cells (+, MCP-1 treated). The same RT-PCR conditions were used for U937 cells (-, controls). β-actin was used as a quantitative control (sense: 5’-GGCATCCTCACCCTGAAGTA-3’; antisense: 5’-CCATCTCTTGCTCGAAGTCC-3’; 60 °C; 496 bp; 1 μg; 30 cycles), RANTES (sense: 5’-CCCTCACCATCATCCTCACT-3’; antisense: 5’-TCCTT-CGAGTGACAAACACG-3’; 50 °C; 186 bp; 1 μg; 30 cycles), GROβ (sense: 5’-ATTCGGGGCAGAAAGAGAAC-3’; antisense: 5’-ACCCCTTTTATGCATGGTTG-3’; 60 °C; 207 bp; 1 μg; 35 cycles), GROγ (sense: 5’-GAATTTGGGGCAGAA-AATGA-3’; antisense: 5’-CGAACCCTTTTTATGCATGG-3’; 60 °C; 227 bp; 1 μg; 30 cycles) and IL-8 (sense: 5’-AAGGAACCATCTCACTGTGTGTAAAC-3’; antisense: 5’;-TTAGCACTCCTTGGCAAACTG-3’; 60 °C; 247 bp; 1 μg; 25 cycles).
- Citation: Bian GX, Miao H, Qiu L, Cao DM, Guo BY. Profiling of differentially expressed chemotactic-related genes in MCP-1 treated macrophage cell line using human cDNA arrays. World J Gastroenterol 2005; 11(16): 2508-2512
- URL: https://www.wjgnet.com/1007-9327/full/v11/i16/2508.htm
- DOI: https://dx.doi.org/10.3748/wjg.v11.i16.2508


