Copyright
©The Author(s) 2017.
World J Gastroenterol. Apr 28, 2017; 23(16): 2912-2927
Published online Apr 28, 2017. doi: 10.3748/wjg.v23.i16.2912
Published online Apr 28, 2017. doi: 10.3748/wjg.v23.i16.2912
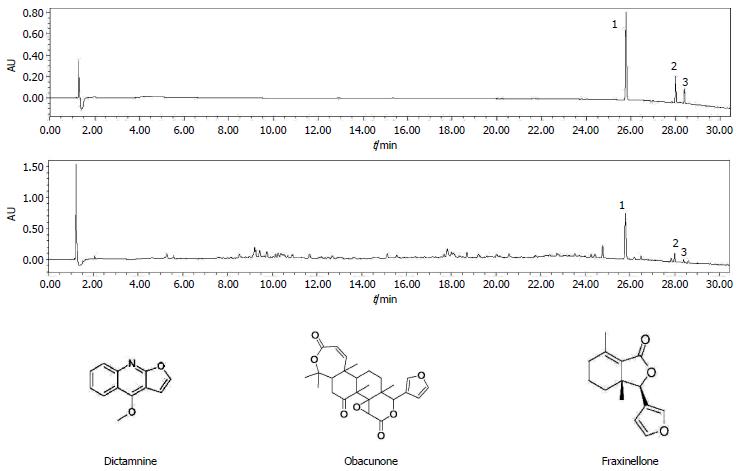
Figure 1 Ultra-performance liquid chromatography chromatograms of the standard and a Cortex Dictamni aqueous extract sample.
1: Dictamnine; 2: Obacunone; 3: Fraxinellone.
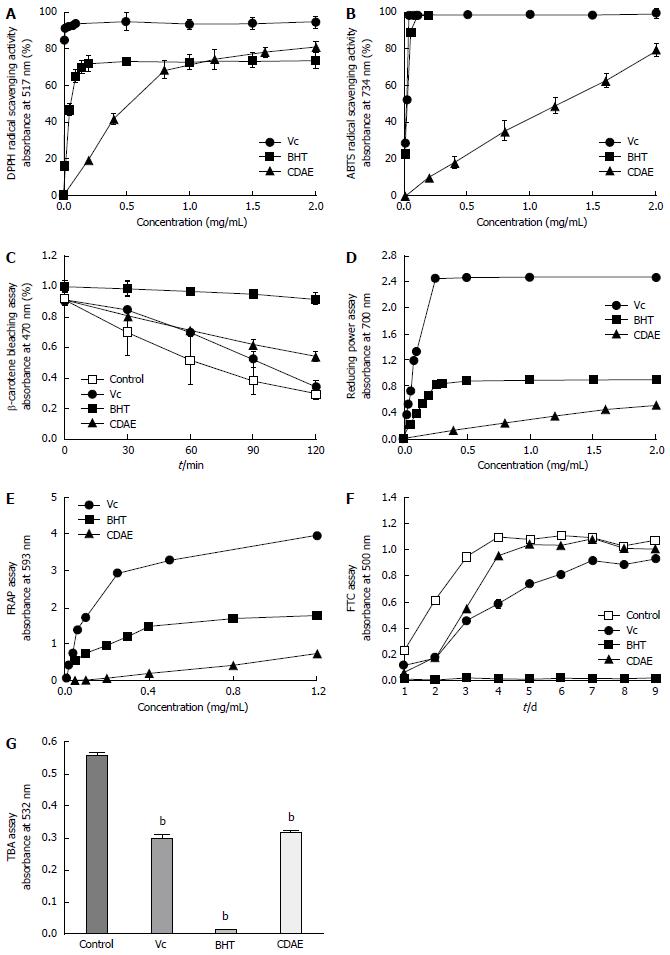
Figure 2 Antioxidant activity of Cortex Dictamni aqueous extract in vitro.
A: DPPH radical scavenging assay; B: ABTS radical scavenging assay; C: β-Carotene bleaching assay; D: Reducing power; E: FRAP assay; F: FTC assay; G: TBA assay. Vc: Ascorbic acid; BHT: Butylated hydroxytoluene; CDAE: Cortex Dictamni aqueous extract. Statistically significant differences are indicated with asterisks. bP < 0.01, vs the control group.
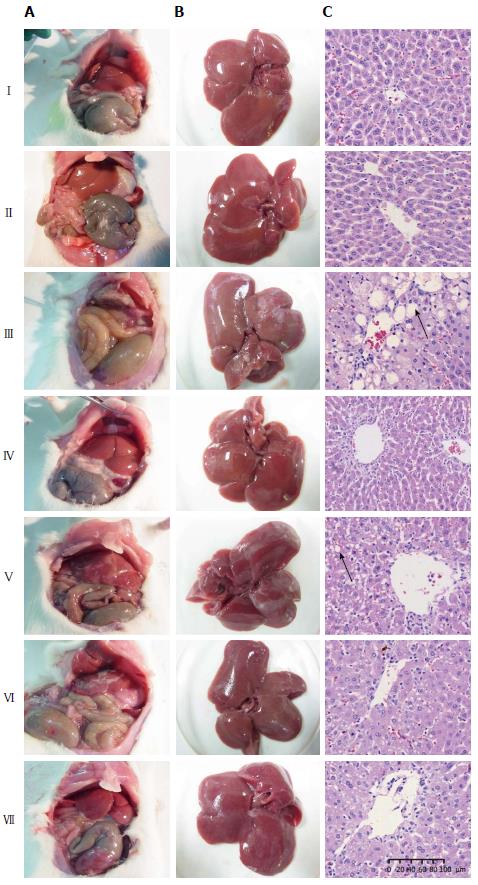
Figure 3 Effect of Cortex Dictamni aqueous extract on histopathological changes in the liver of rats with CCl4-induced liver damage.
A: Liver adhesion; B: Hepatomegaly; C: Liver section. Vacuole formation is marked with a long arrow. Group I: Control; Group II: Control + CDAE 320 mg/kg; Group III: CCl4; Group IV: CCl4 + silymarin 100 mg/kg; Group V: CCl4 + CDAE 80 mg/kg; Group VI: CCl4 + CDAE 160 mg/kg; Group VII: CCl4 + CDAE 320 mg/kg. CDAE: Cortex Dictamni aqueous extract.
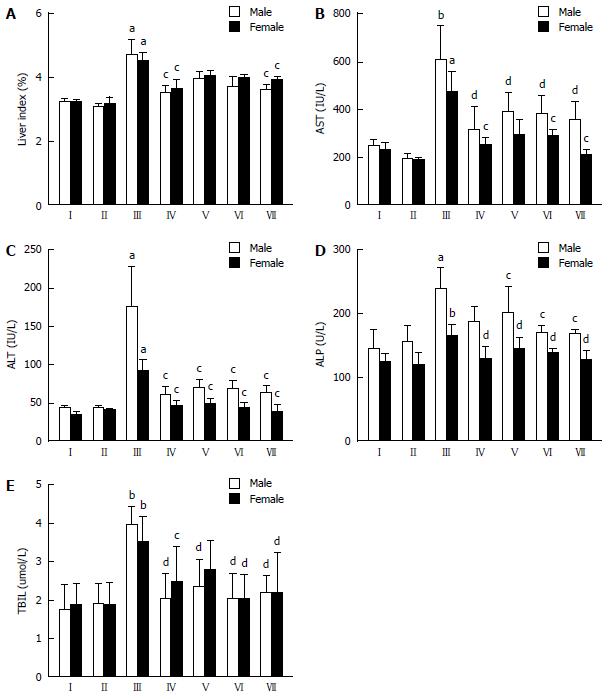
Figure 4 Effect of Cortex Dictamni aqueous extract on liver index and hepatic markers in CCl4-induced liver damage in rats.
A: Liver index; B: Aspartate aminotransferase; C: Glutamate pyruvate transaminase; D: Alkaline phosphatase; E: Total bilirubin. The values represent the mean ± SD, with n = 6 animals in each sex group. Statistically significant differences are indicated with asterisks. aP < 0.05, bP < 0.01, vs the control group; cP < 0.05, dP < 0.01, vs the CCl4 group. Group I: Control; Group II: Control + CDAE 320 mg/kg; Group III: CCl4; Group IV: CCl4 + silymarin 100 mg/kg; Group V: CCl4 + CDAE 80 mg/kg; Group VI: CCl4 + CDAE 160 mg/kg; Group VII: CCl4 + CDAE 320 mg/kg. CDAE: Cortex Dictamni aqueous extract.
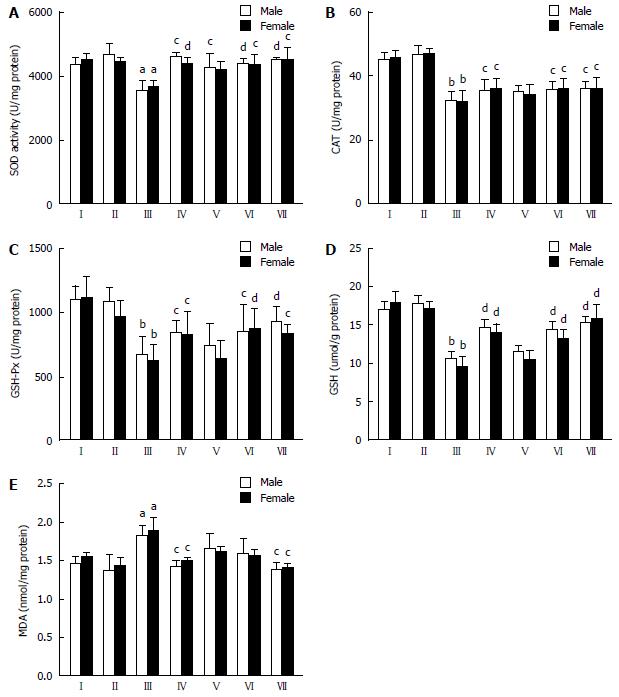
Figure 5 Effect of Cortex Dictamni aqueous extract on antioxidant markers and lipid peroxidation in the liver of rats with CCl4-induced liver damage.
A: Superoxide dismutase; B: Catalase; C: Glutathione peroxidase; D: Glutathione; E: Malondialdehyde. The values represent the mean ± SD with n = 6 animals in each sex group. Statistically significant differences are indicated with asterisks. aP < 0.05, bP < 0.01 vs the control group; cP < 0.05, dP < 0.01, vs CCl4 group. Group I: Control; Group II: Control + CDAE 320 mg/kg; Group III: CCl4; Group IV: CCl4 + silymarin 100 mg/kg; Group V: CCl4 + CDAE 80 mg/kg; Group VI: CCl4 + CDAE 160 mg/kg; Group VII: CCl4 + CDAE 320 mg/kg. CDAE: Cortex Dictamni aqueous extract.
Figure 6 Effect of CDAE on N-Nrf2, HO-1, NQO1 and γ-GCSc protein expression in CCl4-induced liver damage in rats.
A: N-Nrf2 and HO-1 protein expression in the Control (I) and CCl4 groups (III) between male and female rats; B: N-Nrf2, HO-1, NQO1 and γ-GCSc protein expression. The values represent the mean ± SD. Statistically significant differences are indicated with asterisks. bP < 0.01 vs the CCl4 group. Group I: Control; Group II: Control + CDAE 320 mg/kg; Group III: CCl4; Group V: CCl4 + CDAE 80 mg/kg; Group VI: CCl4 + CDAE 160 mg/kg; Group VII: CCl4 + CDAE 320 mg/kg. CDAE: Cortex Dictamni aqueous extract.
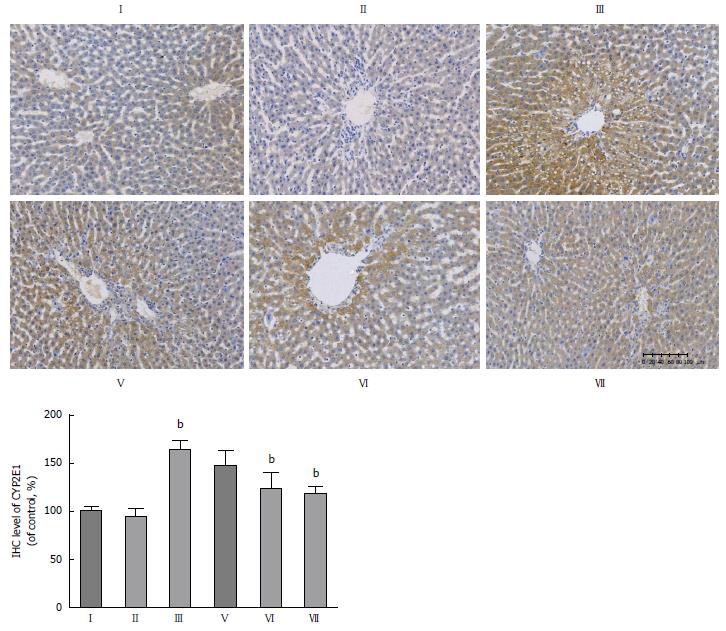
Figure 7 Effect of Cortex Dictamni aqueous extract on CYP2E1 protein expression in CCl4-induced liver damage in rats.
The values represent the mean ± SD. Statistically significant differences are indicated with asterisks. bP < 0.01, vs the CCl4 group. Group I: Control; Group II: Control + CDAE 320 mg/kg; Group III: CCl4; Group V: CCl4 + CDAE 80 mg/kg; Group VI: CCl4 + CDAE 160 mg/kg; Group VII: CCl4 + CDAE 320 mg/kg. CDAE: Cortex Dictamni aqueous extract.
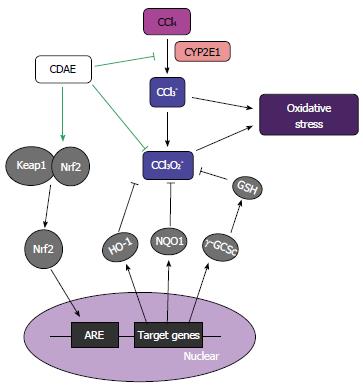
Figure 8 Summary of the mechanism underlying Cortex Dictamni aqueous extract inhibition of CCl4-induced live damage.
CCl4 accumulates in hepatic parenchymal cells and is metabolized by cytochrome P450 2E1 (CYP2E1) to produce free radicals, including CCl3- and CCl3O2-, which induce oxidative stress and oxidative injury. CDAE suppresses CCl4 metabolism by reducing CYP2E1 expression and subsequently inhibiting the production of free radicals. In addition, CDAE activates nuclear factor E2-related factor (Nrf2)-mediated antioxidants, including heme oxygenase-1 (HO-1), NAD(P)H quinine oxidoreductase 1 (NQO1), and γ-glutamylcysteine synthetase catalytic subunit (γ-GCSc), which contribute to the scavenging of free radicals. CDAE: Cortex Dictamni aqueous extract; GSH: Glutathione.
- Citation: Li L, Zhou YF, Li YL, Wang LL, Arai H, Xu Y. In vitro and in vivo antioxidative and hepatoprotective activity of aqueous extract of Cortex Dictamni. World J Gastroenterol 2017; 23(16): 2912-2927
- URL: https://www.wjgnet.com/1007-9327/full/v23/i16/2912.htm
- DOI: https://dx.doi.org/10.3748/wjg.v23.i16.2912


