Copyright
©2012 Baishideng Publishing Group Co.
World J Gastroenterol. Oct 14, 2012; 18(38): 5442-5453
Published online Oct 14, 2012. doi: 10.3748/wjg.v18.i38.5442
Published online Oct 14, 2012. doi: 10.3748/wjg.v18.i38.5442
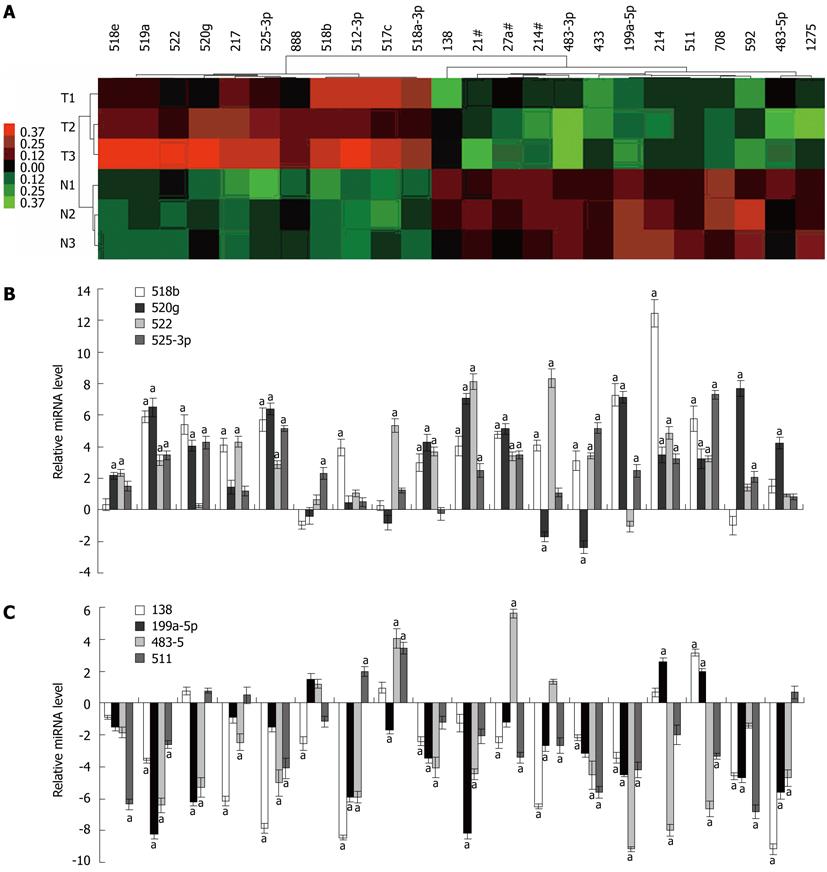
Figure 1 MiRNA profiles differentiate hepatitis B virus-associated hepatocellular carcinoma from adjacent non-tumor tissues.
A: The cluster analysis of down-regulated (green) and up-regulated (red) miRNAs identified in hepatocellular carcinoma (hepatitis B virus-hepatocellular carcinoma). Samples consist of paired samples from three patients; B: Validation of Taqman array data using quantitative reverse transcription polymerase chain reaction (RT-PCR) for up-regulated miRNA; C: Validation of Taqman array data using quantitative RT-PCR for down-regulated miRNA. Triplicate assays were done for each RNA sample and the relative amount of each miRNA was normalized to U6 snRNA. aP < 0.01 vs control group.
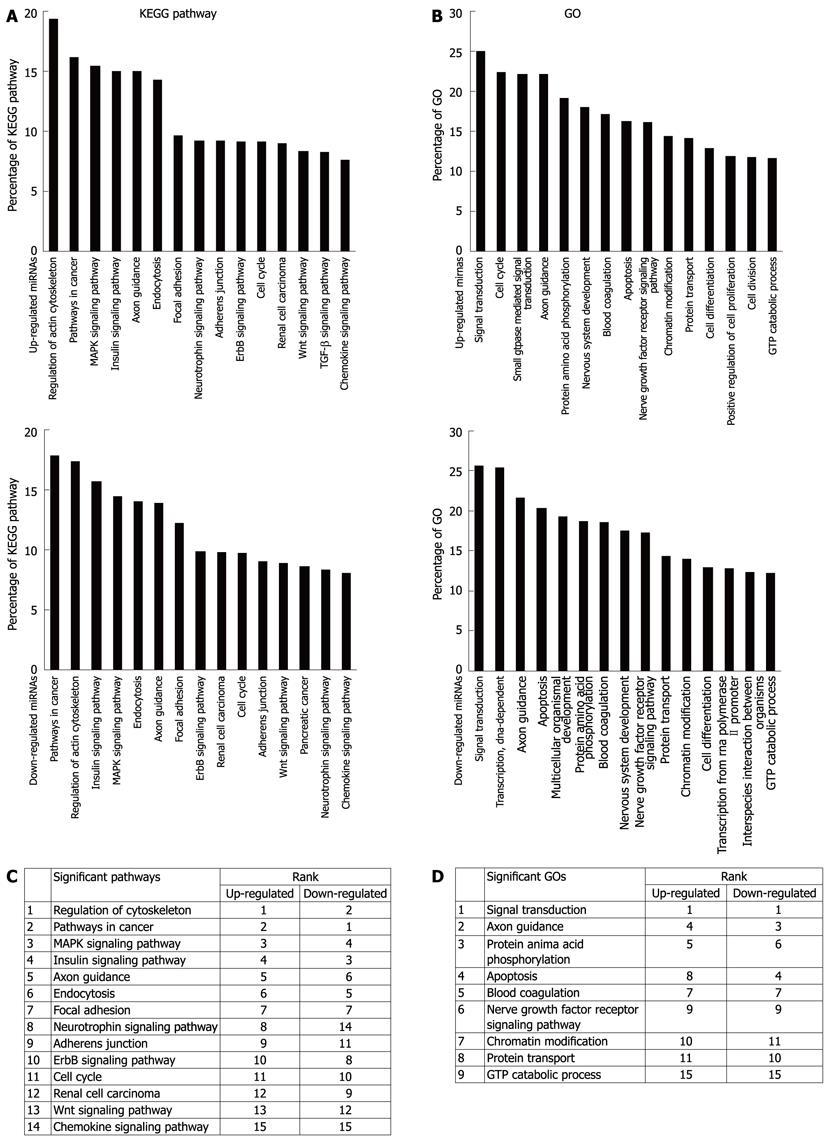
Figure 2 Gene oncology and kyoto encyclopedia of genes and genomes pathway analysis based on miRNA targeted genes.
A: The upper panel showing significant pathways targeted by up-regulated miRNA and the lower panel showing significant pathways targeted by down-regulated miRNA; B: The upper panel showing significant GOs targeted by up-regulated miRNA and the lower panel showing significant GOs targeted by down-regulated miRNA. The vertical axis is the pathway or GO category, and the horizontal axis is the enrichment of pathways or GOs; C, D: Summary data of A and B respectively. KEGG: Kyoto Encyclopedia of Genes and Genomes; GO: Gene ontology.
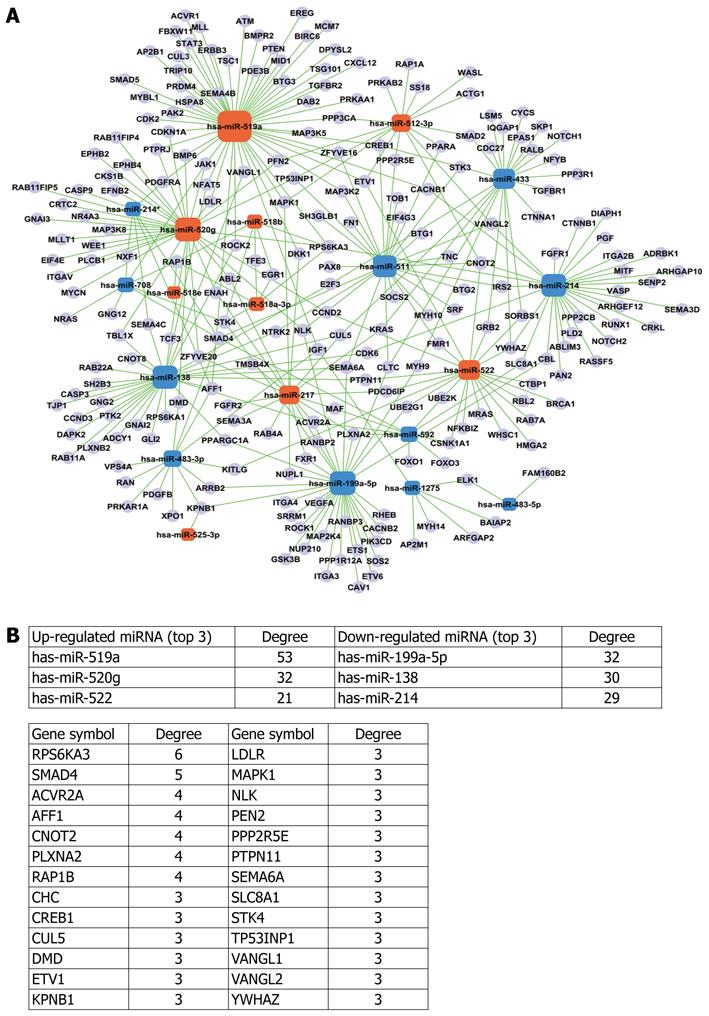
Figure 3 MiRNAs-mRNA network.
A: Orange box nodes represent up-regulated miRNAs, blue box nodes represent down-regulated miRNAs, and cyan cycle nodes represent mRNA. Green lines show the inhibitory effect of miRNAs on target mRNAs; B: Summary data of A.
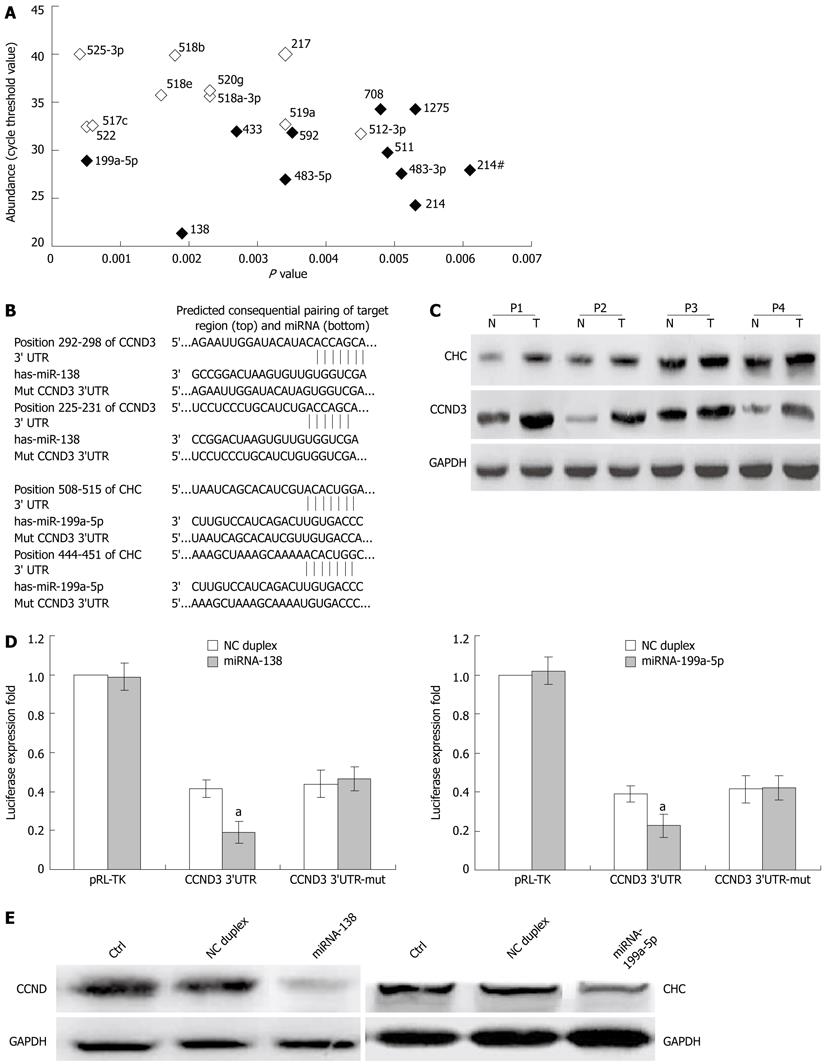
Figure 4 Cyclin D3 and clathrin heavy chain are the direct target of miR-138 and miR-199a-5p.
A: Abundance of deregulated miRNAs in hepatitis B virus (HBV)-hepatocellular carcinoma (HCC) non-tumor tissues; B: The putative miR-138 or miR-199a-5p binding sequence in the 3’-UTR of cyclin D3 (CCND3) or clathrin heavy chain (CHC) mRNA; C: The expression of CCND3 and CHC in 4 paired HCCs (T) and adjacent non-tumor tissues (N); D: Suppressed luciferase activity of wild type 3’UTR of CCND3 or CHC by miR-138 or miR-199a-5p mimic. Firefly luciferase activity of each sample was mea sured 48 h after transfection and normalized to Renilla luciferase activity; E: Suppressed expression of endogenous CCND3 or CHC in HepG2 cells by miR-138 or miR-199a-5p mimic, respectively. Glyceraldehyde-3-phosphate dehydrogenase (GAPDH) was used as an internal control. Column, mean of three independent experiments; bars, SD; aP < 0.01 vs control group. NC: Non-relative control.
- Citation: Wang W, Zhao LJ, Tan YX, Ren H, Qi ZT. Identification of deregulated miRNAs and their targets in hepatitis B virus-associated hepatocellular carcinoma. World J Gastroenterol 2012; 18(38): 5442-5453
- URL: https://www.wjgnet.com/1007-9327/full/v18/i38/5442.htm
- DOI: https://dx.doi.org/10.3748/wjg.v18.i38.5442


