Copyright
©2012 Baishideng Publishing Group Co.
World J Gastroenterol. Oct 14, 2012; 18(38): 5442-5453
Published online Oct 14, 2012. doi: 10.3748/wjg.v18.i38.5442
Published online Oct 14, 2012. doi: 10.3748/wjg.v18.i38.5442
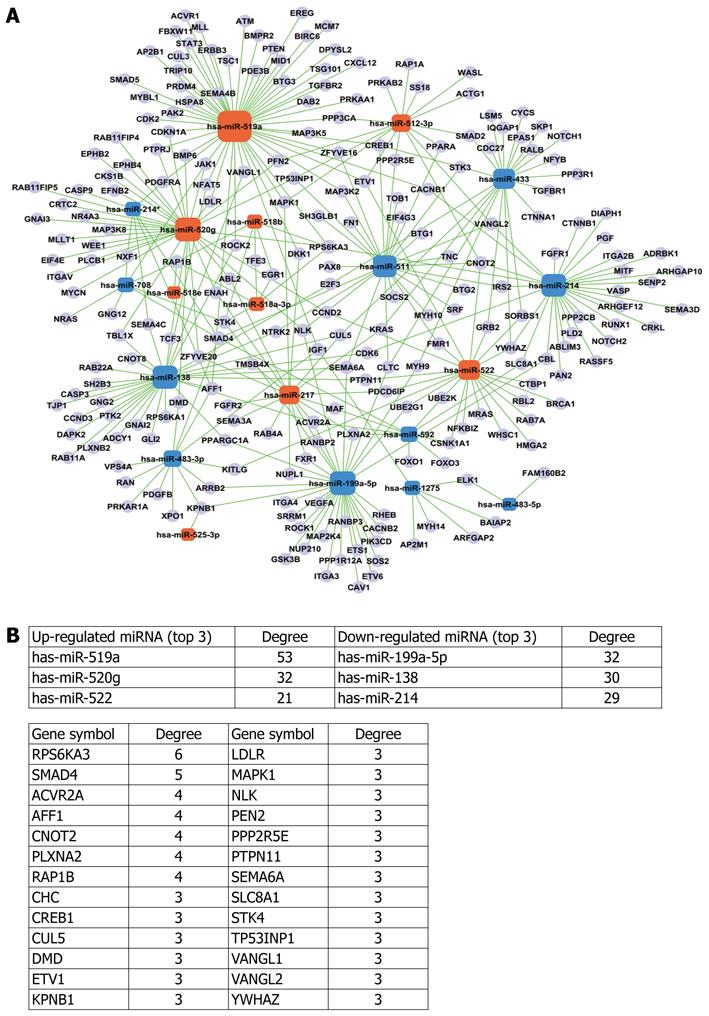
Figure 3 MiRNAs-mRNA network.
A: Orange box nodes represent up-regulated miRNAs, blue box nodes represent down-regulated miRNAs, and cyan cycle nodes represent mRNA. Green lines show the inhibitory effect of miRNAs on target mRNAs; B: Summary data of A.
- Citation: Wang W, Zhao LJ, Tan YX, Ren H, Qi ZT. Identification of deregulated miRNAs and their targets in hepatitis B virus-associated hepatocellular carcinoma. World J Gastroenterol 2012; 18(38): 5442-5453
- URL: https://www.wjgnet.com/1007-9327/full/v18/i38/5442.htm
- DOI: https://dx.doi.org/10.3748/wjg.v18.i38.5442


