Copyright
©2012 Baishideng Publishing Group Co.
World J Gastroenterol. Jun 7, 2012; 18(21): 2630-2639
Published online Jun 7, 2012. doi: 10.3748/wjg.v18.i21.2630
Published online Jun 7, 2012. doi: 10.3748/wjg.v18.i21.2630
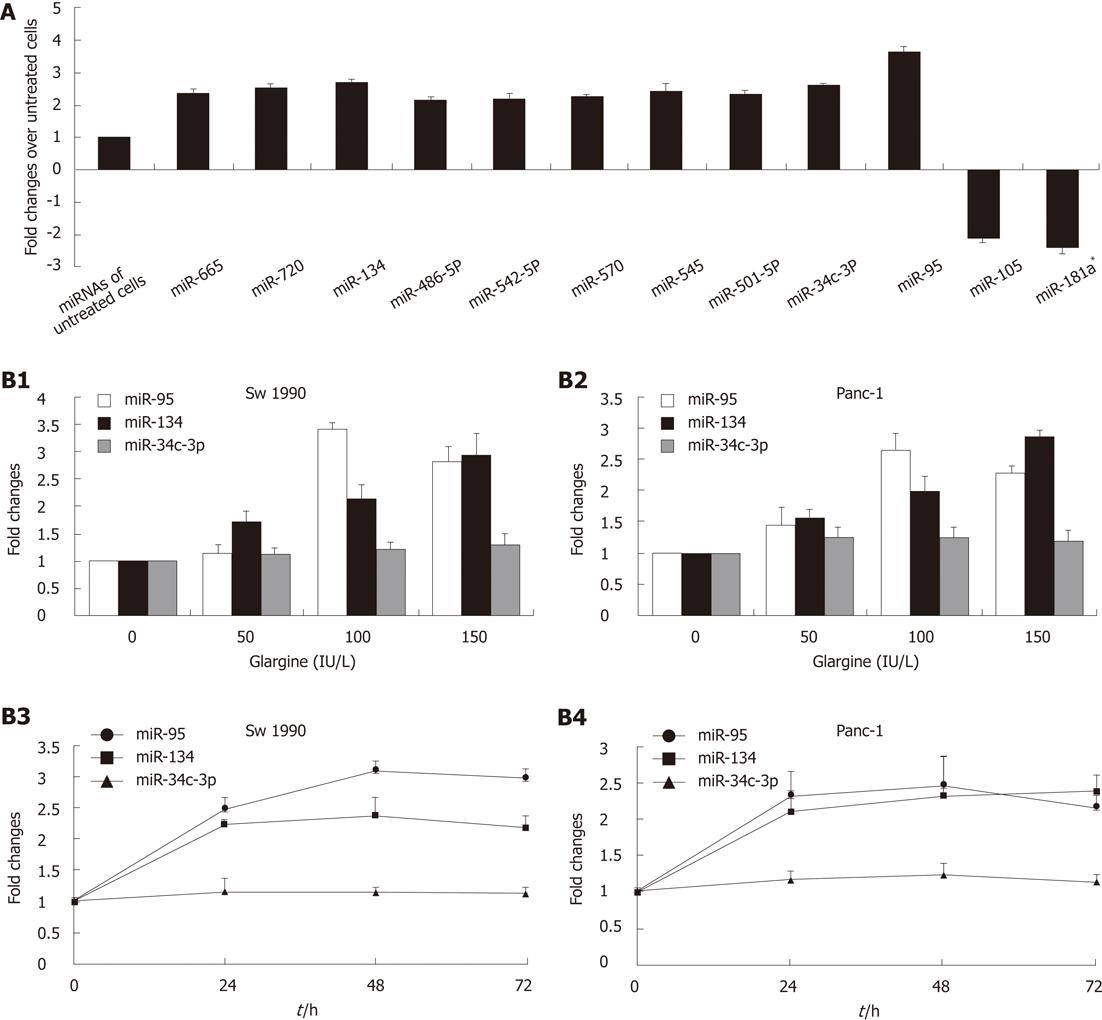
Figure 1 Effect of insulin glargine on miRNAs expression in Sw1990 cell line (A), insulin glargine up-regulated the expression of miR-95 and miR-134, miR-34c-3p showed no obvious changes in Sw1990 and Panc-1 cells (B).
Ten miRNAs were significantly up-regulated and two miRNAs were down-regulated after 100 IU/L insulin glargine treatment for 48 h compared with non-treated cells. The cut off line for miRNA expression change was 2-fold. Data were presented as mean ± SD. Sw1990 and Panc-1 cells were incubated with increasing concentrations of insulin glargine (50-150 IU/L) for 48 h or treated with 100 IU/L insulin glargine for different periods (24-72 h). Then the expression of the three miRNAs were detected by stem-loop real-time reverse transcription-polymerase chain reaction array. miR-95 was significantly up-regulated, but no dose or time dependent changes were observed; miR-134 was up-regulated in a dose-dependent manner. miR-181a*: The miRNA of lower abundance.
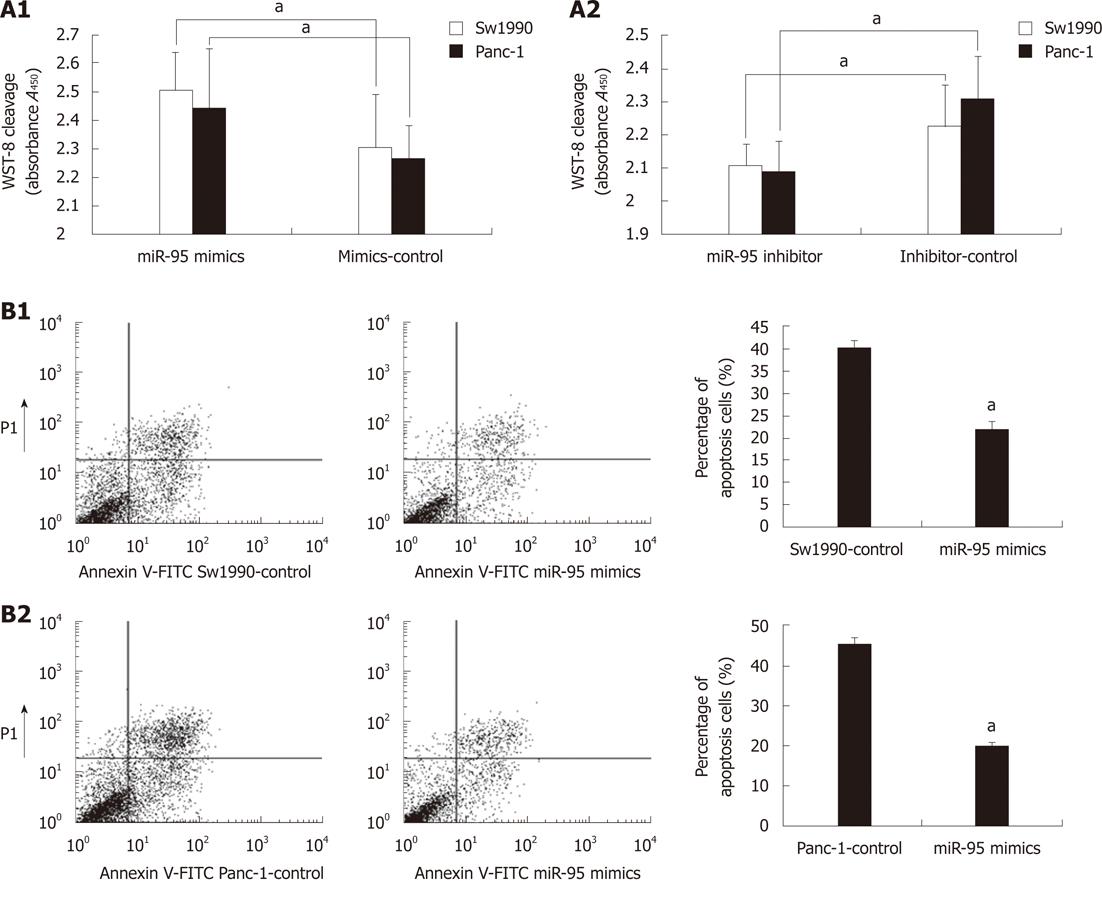
Figure 2 miR-95 promotes cell proliferation (A) and enhancement of miR-95 inhibit apoptosis (B).
A total of 104 Sw1990 or Panc-1 cells per well were plated in 96-well plates for 24 h and then were transfected with hsa-miR-95 mimics or hsa-miR-95 inhibitor along with paired negative controls. The cells were incubated at 37 °C for 48 h and then cell proliferation was assessed using Cell Counting Kit 8. Data were shown as mean ± SD. aP < 0.05 vs pairing negative control.
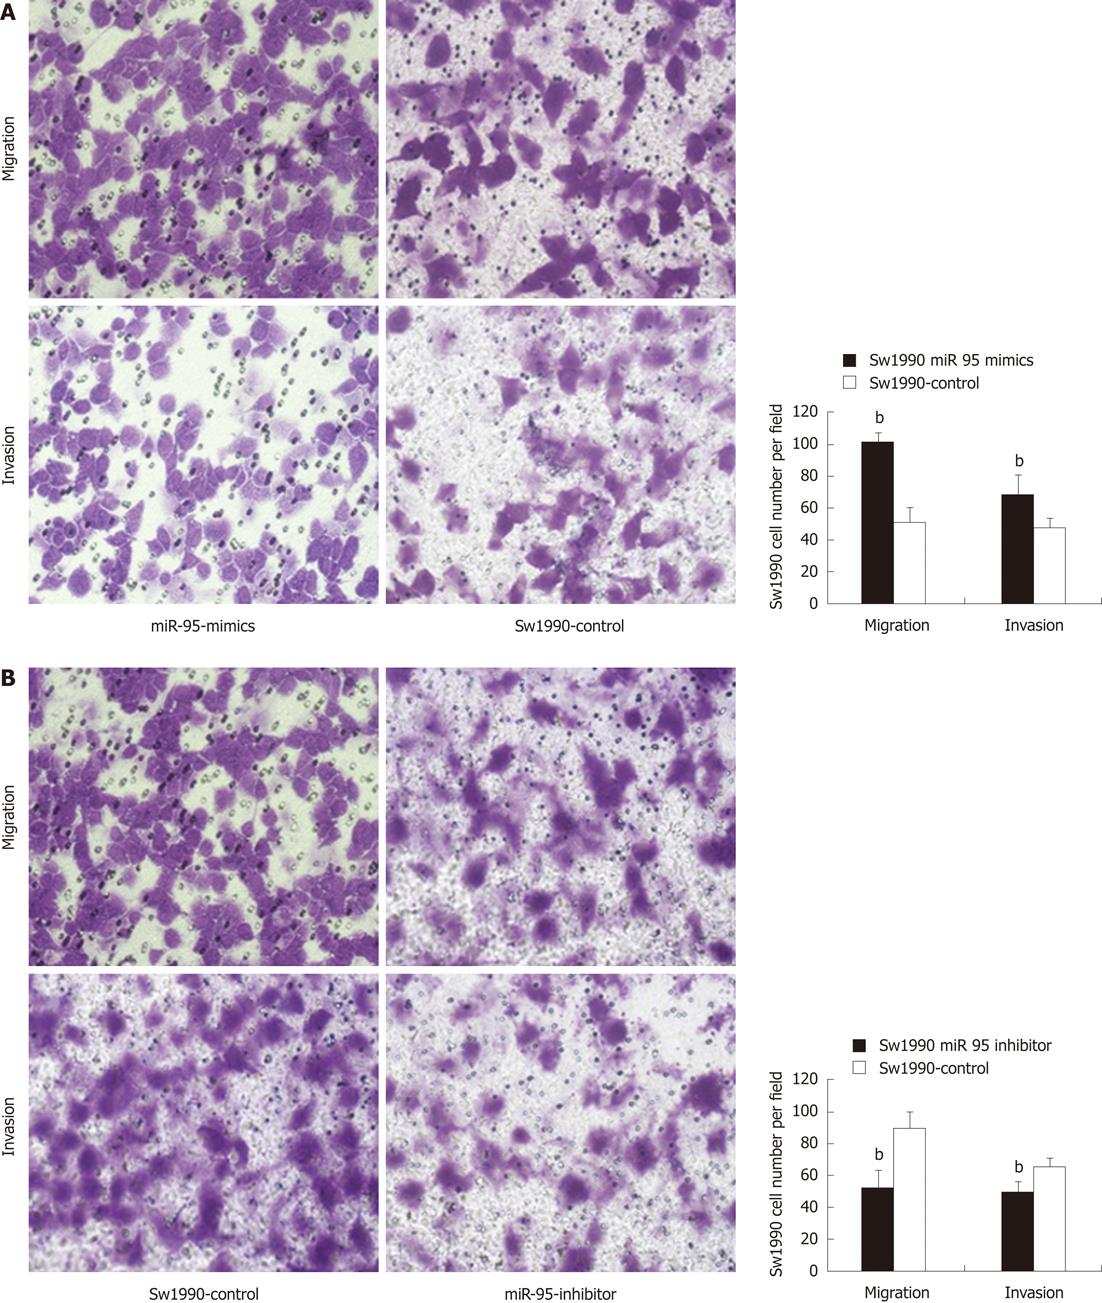
Figure 3 Effect of miR-95 on tumor cell migration, invasion of Sw1990 cells.
A: Invasion and migration assay. Representative fields of invasion (down) or migration (up) cells on the membrane (left, magnification of × 200). Average invasion or migration cell number per field (right). The invasion or migration cell number of Sw1990 transfected with miR-95-mimics drastically increased than that transfected with pairing negative control; B: The invasion or migration cell number of Sw1990 cells transfected with miR-95-inhibitor dramatically decreased than that transfected with pairing negative control. bP < 0.01 vs Sw1990-control, n = 10.
Figure 4 Effect of miR-95 on tumor cell migration, invasion of Panc-1 cells.
A: Invasion and migration assay. Representative fields of invasion (down) or migration (up) cells on the membrane (left, magnification of × 200). Average invasion or migration cell number per field (right). The invasion or migration cell number of Panc-1 transfected with miR-95-mimics drastically increased compared with that when transfected with the pairing negative control. B: The invasion or migration cell number of Panc-1 cells transfected with miR-26a-inhibitor dramatically decreased compared with that when transfected with the pairing negative control. bP < 0.01 vs Panc-1-control, n = 10.
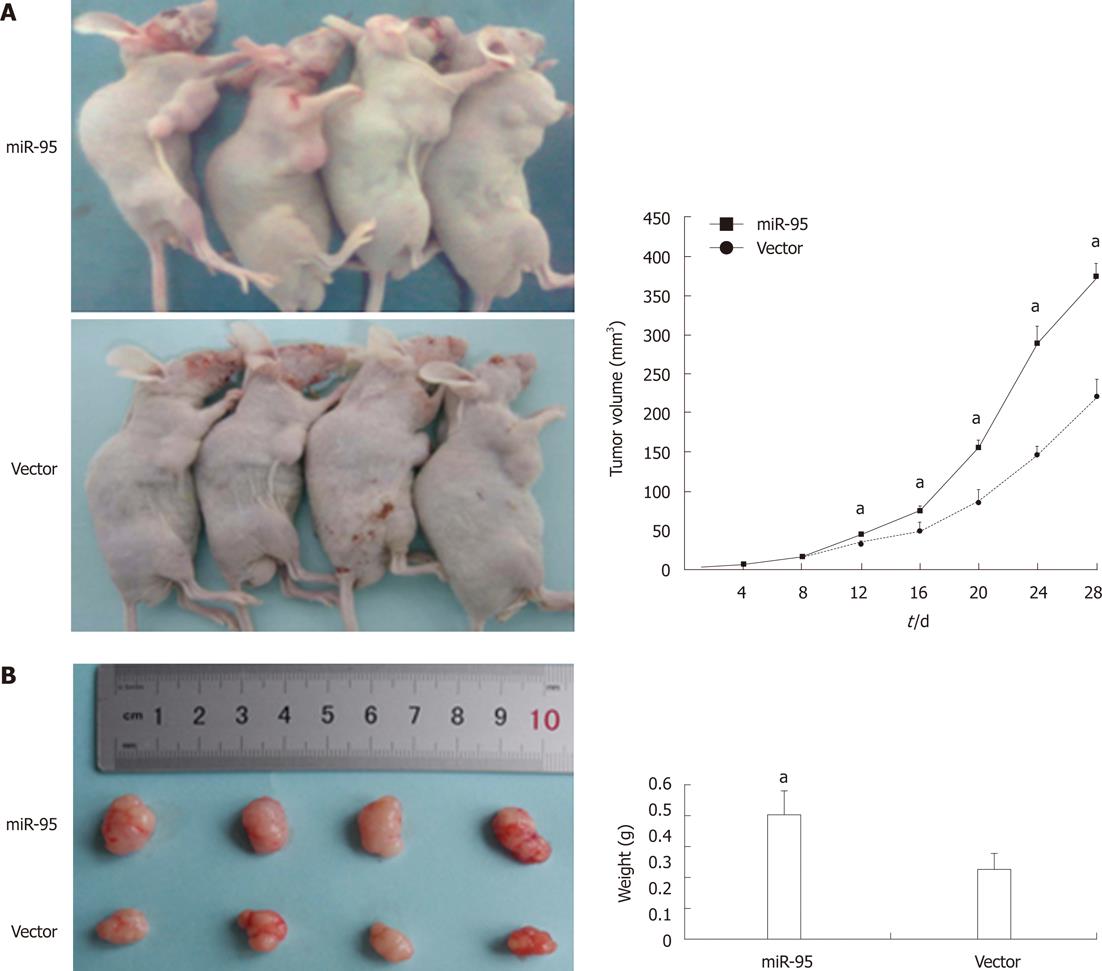
Figure 5 miR-95 promotes the growth of Sw1990 xenografts.
A: miR-95 strikingly increased the growth of Sw1990 cells xenografted in nude mice; B: At the end of the experiment, all animals were sacrificed and the tumors were removed. The tumors were much heavier in miR-95 group than in the vector group. Data were shown as mean ± SD (aP < 0.05 vs vector).
- Citation: Li WG, Yuan YZ, Qiao MM, Zhang YP. High dose glargine alters the expression profiles of microRNAs in pancreatic cancer cells. World J Gastroenterol 2012; 18(21): 2630-2639
- URL: https://www.wjgnet.com/1007-9327/full/v18/i21/2630.htm
- DOI: https://dx.doi.org/10.3748/wjg.v18.i21.2630


