Copyright
©The Author(s) 2004.
World J Gastroenterol. Jun 1, 2004; 10(11): 1560-1564
Published online Jun 1, 2004. doi: 10.3748/wjg.v10.i11.1560
Published online Jun 1, 2004. doi: 10.3748/wjg.v10.i11.1560
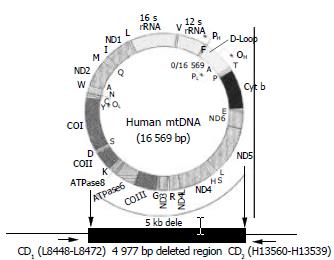
Figure 1 Human mitochondrial DNA showing the 4997-bp deletion.
The genes disrupted by the 4997 bp deletion between nucleotide positions 8469 and 13447 encode four polypeptides for complex I (ND3, ND4, ND4L and ND5), one for complex IV (CO III) and two for complex V (ATP8 and ATP6), and five tRNA genes for the amino acids G, R, H, S and L. CD represent the PCR primers position that flank the common deletion region.
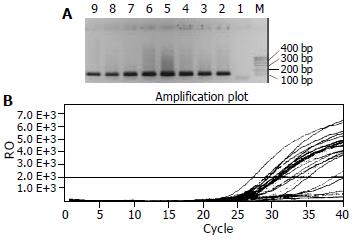
Figure 2 Detection results of CD-mtDNA in HCC.
A: Conven-tional PCR results: Lane M, marker, Lane 1, negative control, Lane 2, positive control, Lane 3-4, nasopharygitis samples, and Lane 5-8, NPC samples; B: Real-time PCR result shows the amplification plot of fluorescence intensity against the PCR cycle. Each plot corresponds to a HCC sample. The X axis denotes the cycle number of a quantitative PCR reaction. The Y axis denotes the Rn, which is the fluorescence intensity over the background. The correlation coefficient is 0.994.
Figure 3 Sequencing result of the amplified CD-mtDNA from HCC.
Comparison with the MITOMAP Human mtDNA Cambridge Sequence data (http://www.mitomap.org), the deletion region (red bar region) is a 4981 bp deletion from position 8470 to 13450 of the mtDNA.
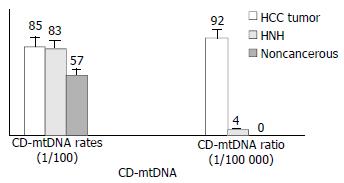
Figure 4 Correlations of CD-mtDNA with HCC and HNH.
The CD-mtDNA rate in HCC and HNH lesions was signifi-cantly higher than that in paired noncancerous tissues; the CD/WT-mtDNA ratio in HCC was significant higher than that in paired noncancerous liver tissues (P = 0.02), and was about 25 times that in HNH lesions (P = 0.02).
-
Citation: Shao JY, Gao HY, Li YH, Zhang Y, Lu YY, Zeng YX. Quantitative detection of
common deletion of mitochondrial DNA in hepatocellular carcinoma and hepatocellular nodular hyperplasia. World J Gastroenterol 2004; 10(11): 1560-1564 - URL: https://www.wjgnet.com/1007-9327/full/v10/i11/1560.htm
- DOI: https://dx.doi.org/10.3748/wjg.v10.i11.1560


