Copyright
©The Author(s) 2004.
World J Gastroenterol. Jun 1, 2004; 10(11): 1560-1564
Published online Jun 1, 2004. doi: 10.3748/wjg.v10.i11.1560
Published online Jun 1, 2004. doi: 10.3748/wjg.v10.i11.1560
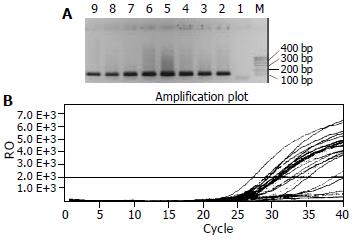
Figure 2 Detection results of CD-mtDNA in HCC.
A: Conven-tional PCR results: Lane M, marker, Lane 1, negative control, Lane 2, positive control, Lane 3-4, nasopharygitis samples, and Lane 5-8, NPC samples; B: Real-time PCR result shows the amplification plot of fluorescence intensity against the PCR cycle. Each plot corresponds to a HCC sample. The X axis denotes the cycle number of a quantitative PCR reaction. The Y axis denotes the Rn, which is the fluorescence intensity over the background. The correlation coefficient is 0.994.
-
Citation: Shao JY, Gao HY, Li YH, Zhang Y, Lu YY, Zeng YX. Quantitative detection of
common deletion of mitochondrial DNA in hepatocellular carcinoma and hepatocellular nodular hyperplasia. World J Gastroenterol 2004; 10(11): 1560-1564 - URL: https://www.wjgnet.com/1007-9327/full/v10/i11/1560.htm
- DOI: https://dx.doi.org/10.3748/wjg.v10.i11.1560


