
















Copyright: ©Author(s) 2026.
Artif Intell Cancer. Sep 8, 2026; 7(1): 116464
Published online Sep 8, 2026. doi: 10.35713/aic.v7.i1.116464
Published online Sep 8, 2026. doi: 10.35713/aic.v7.i1.116464
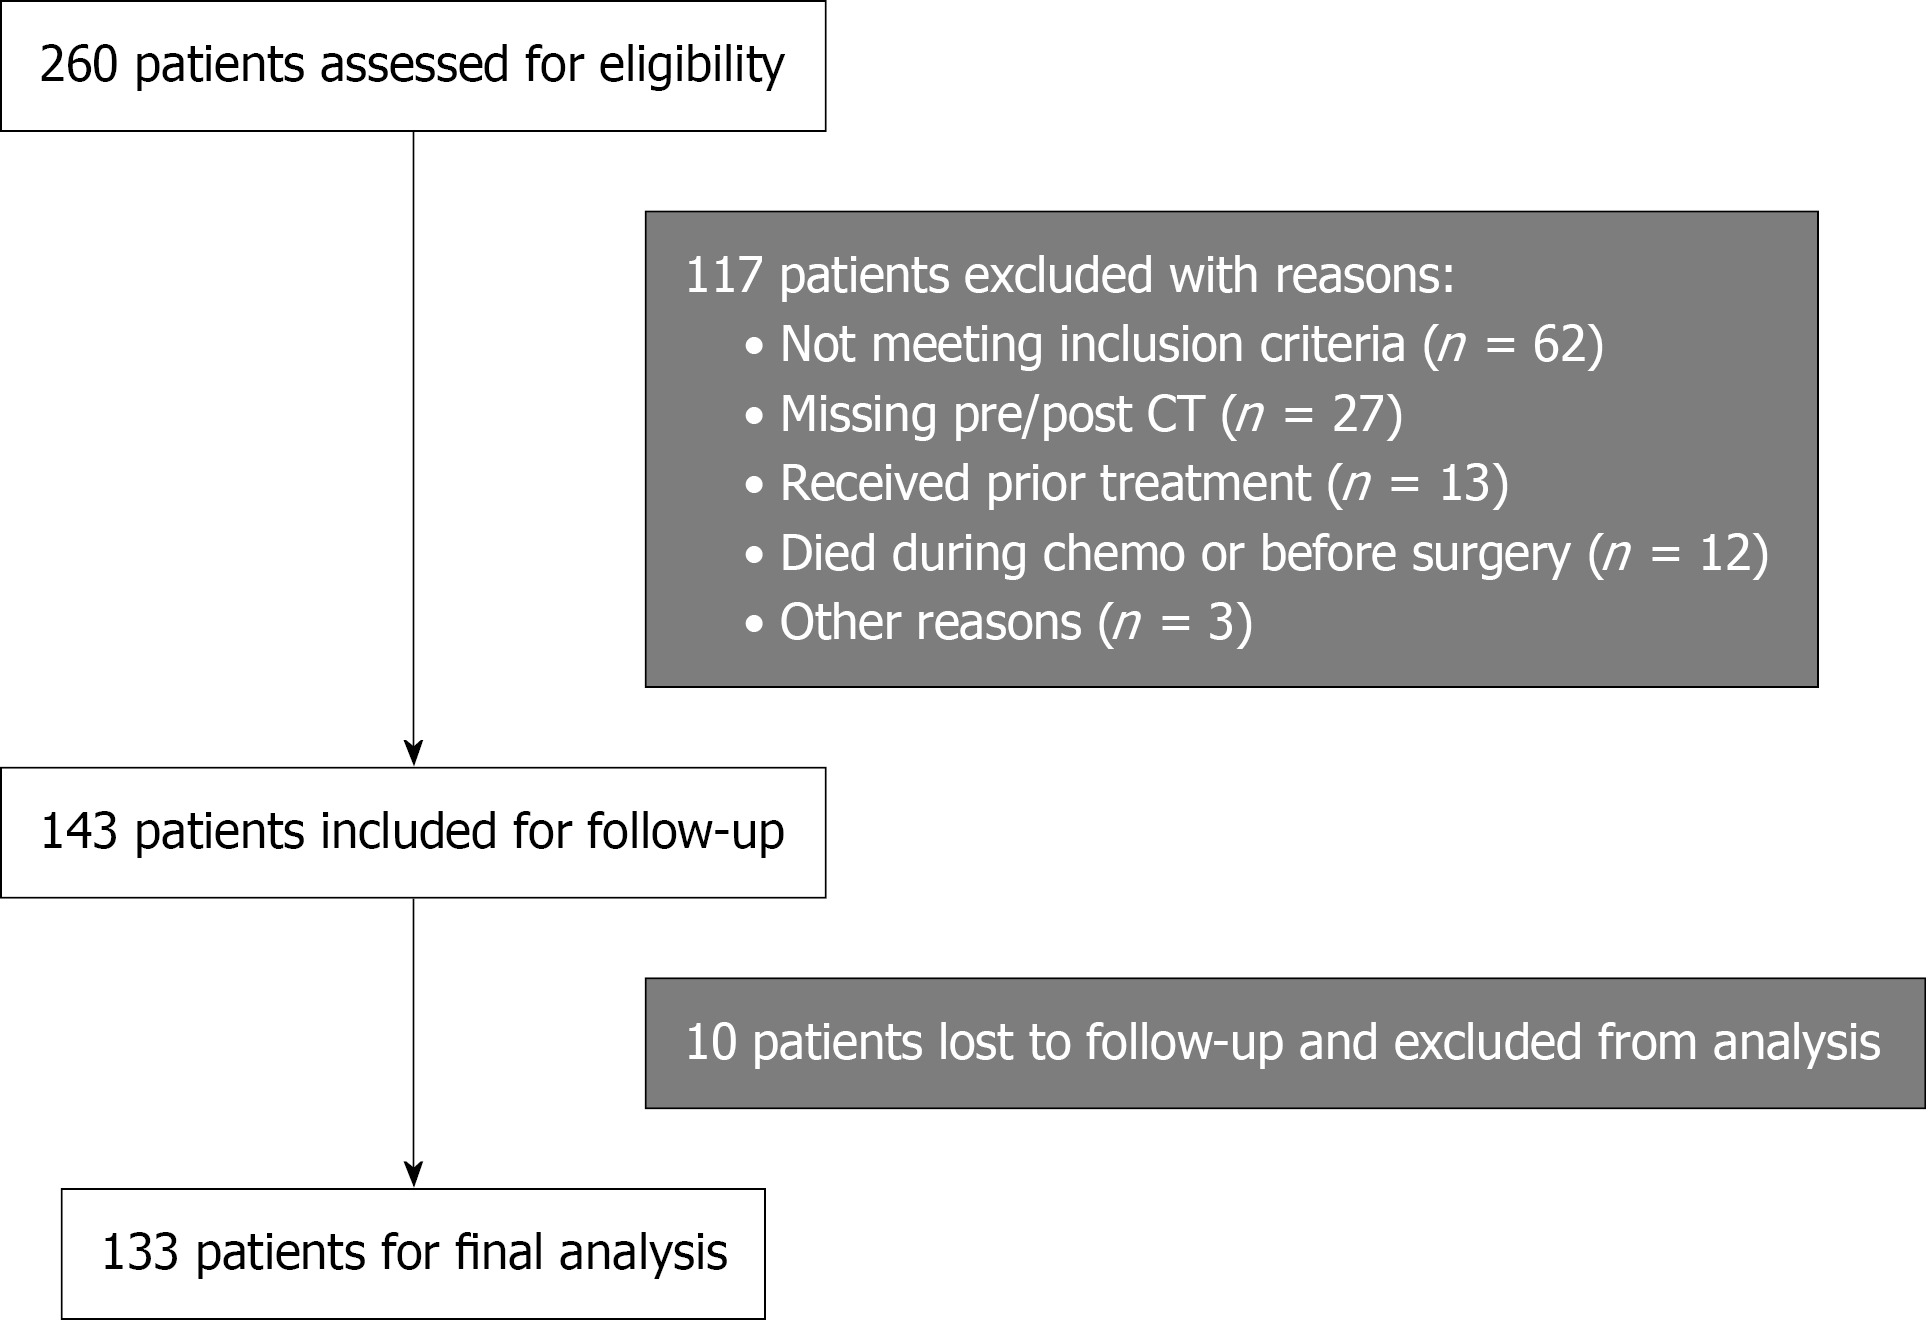
Figure 1 A STROBE-style flowchart summarizing identification, exclusion and final cohort for present study.
CT: Computed tomography.
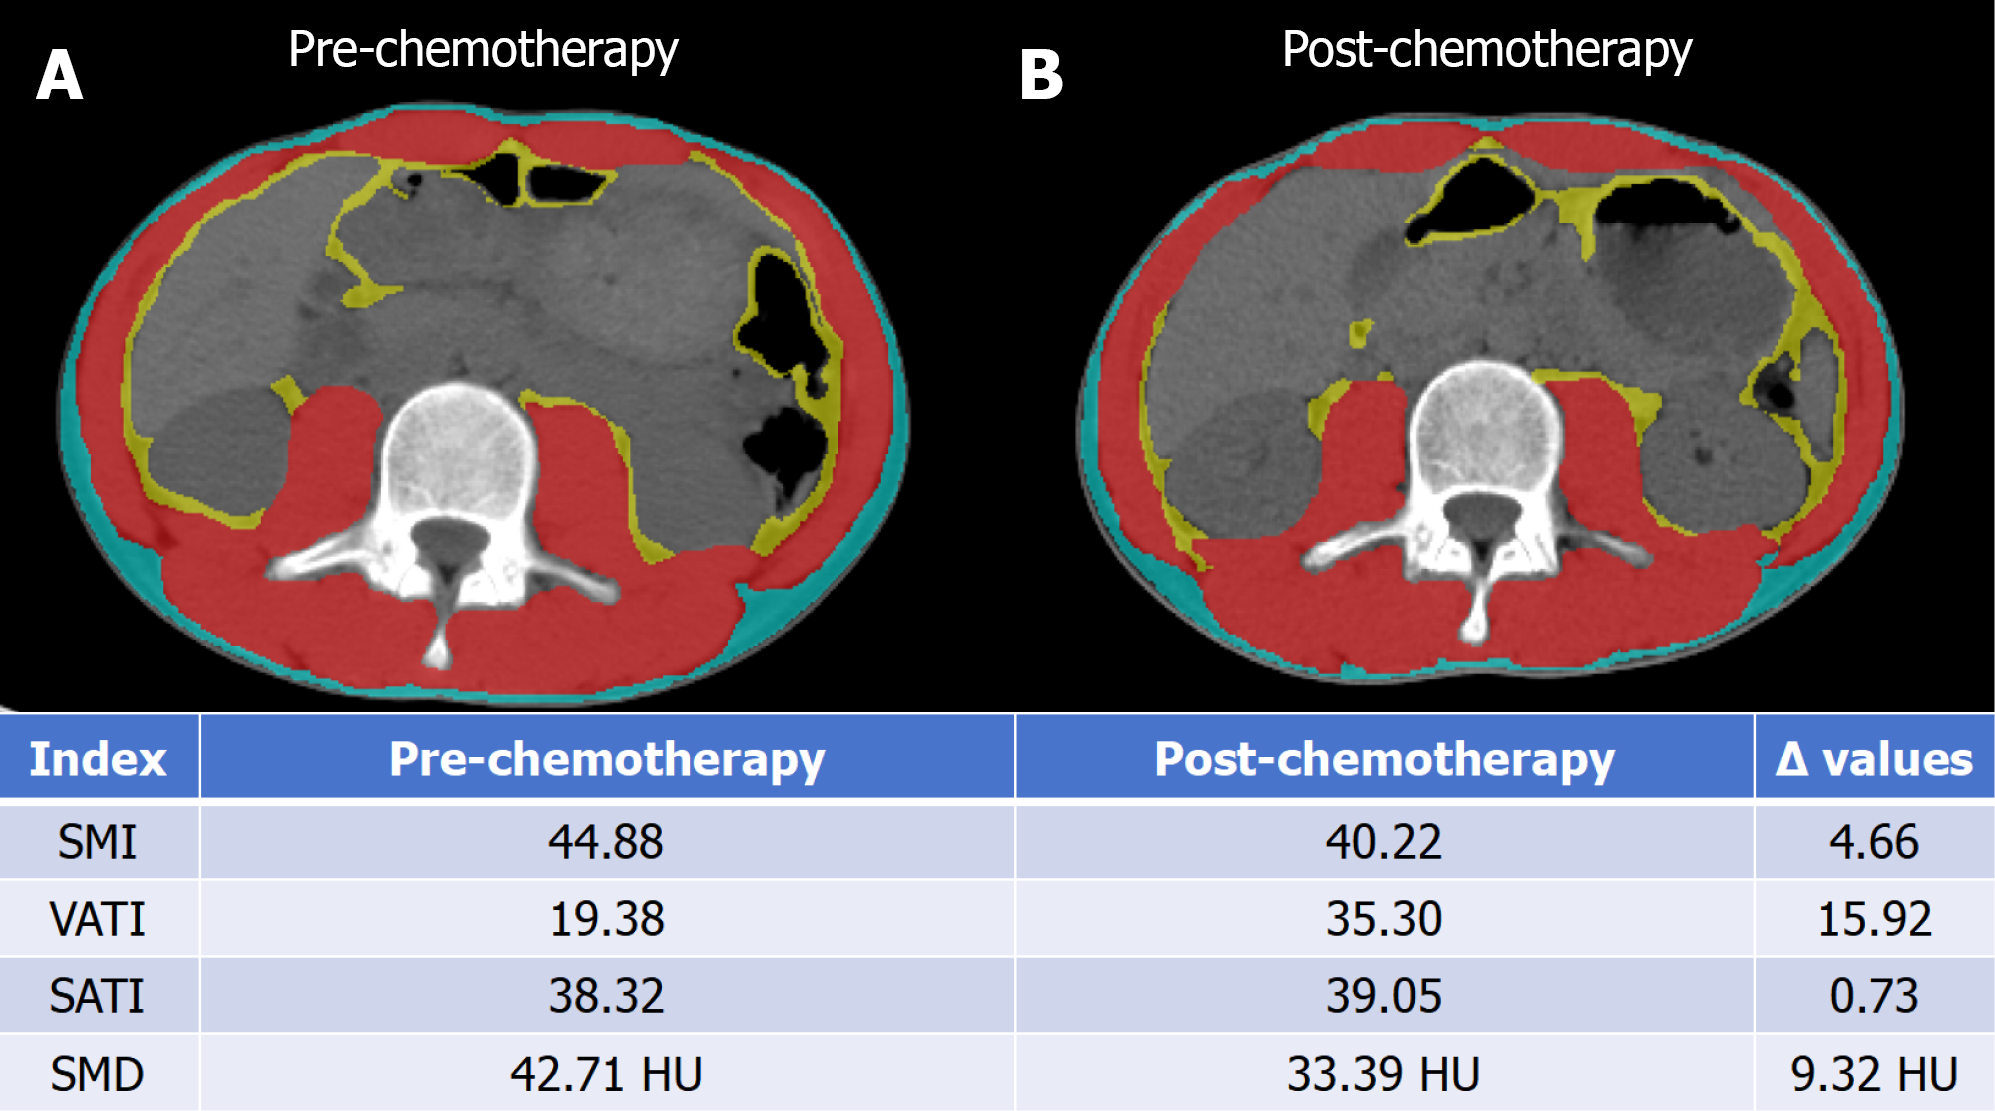
Figure 2 Representative case of a 12-year-old male with osteosarcoma of the distal femur who received neoadjuvant chemotherapy.
A: Pre-chemotherapy axial computed tomography at L3 with automated segmentation (skeletal muscle = red, visceral fat = yellow, subcutaneous fat = blue); B: Post-chemotherapy axial computed tomography at L3 with automated segmentation. Tissue area and density values are shown for pre- and post-chemotherapy scans with the Δ values. Tissue area and density were automatically calculated using Visage version 7.1. SMI: Skeletal muscle index; VATI: Visceral adipose tissue index; SATI: Subcutaneous adipose tissue index; SMD: Skeletal muscle density; HU: Hounsfield unit.
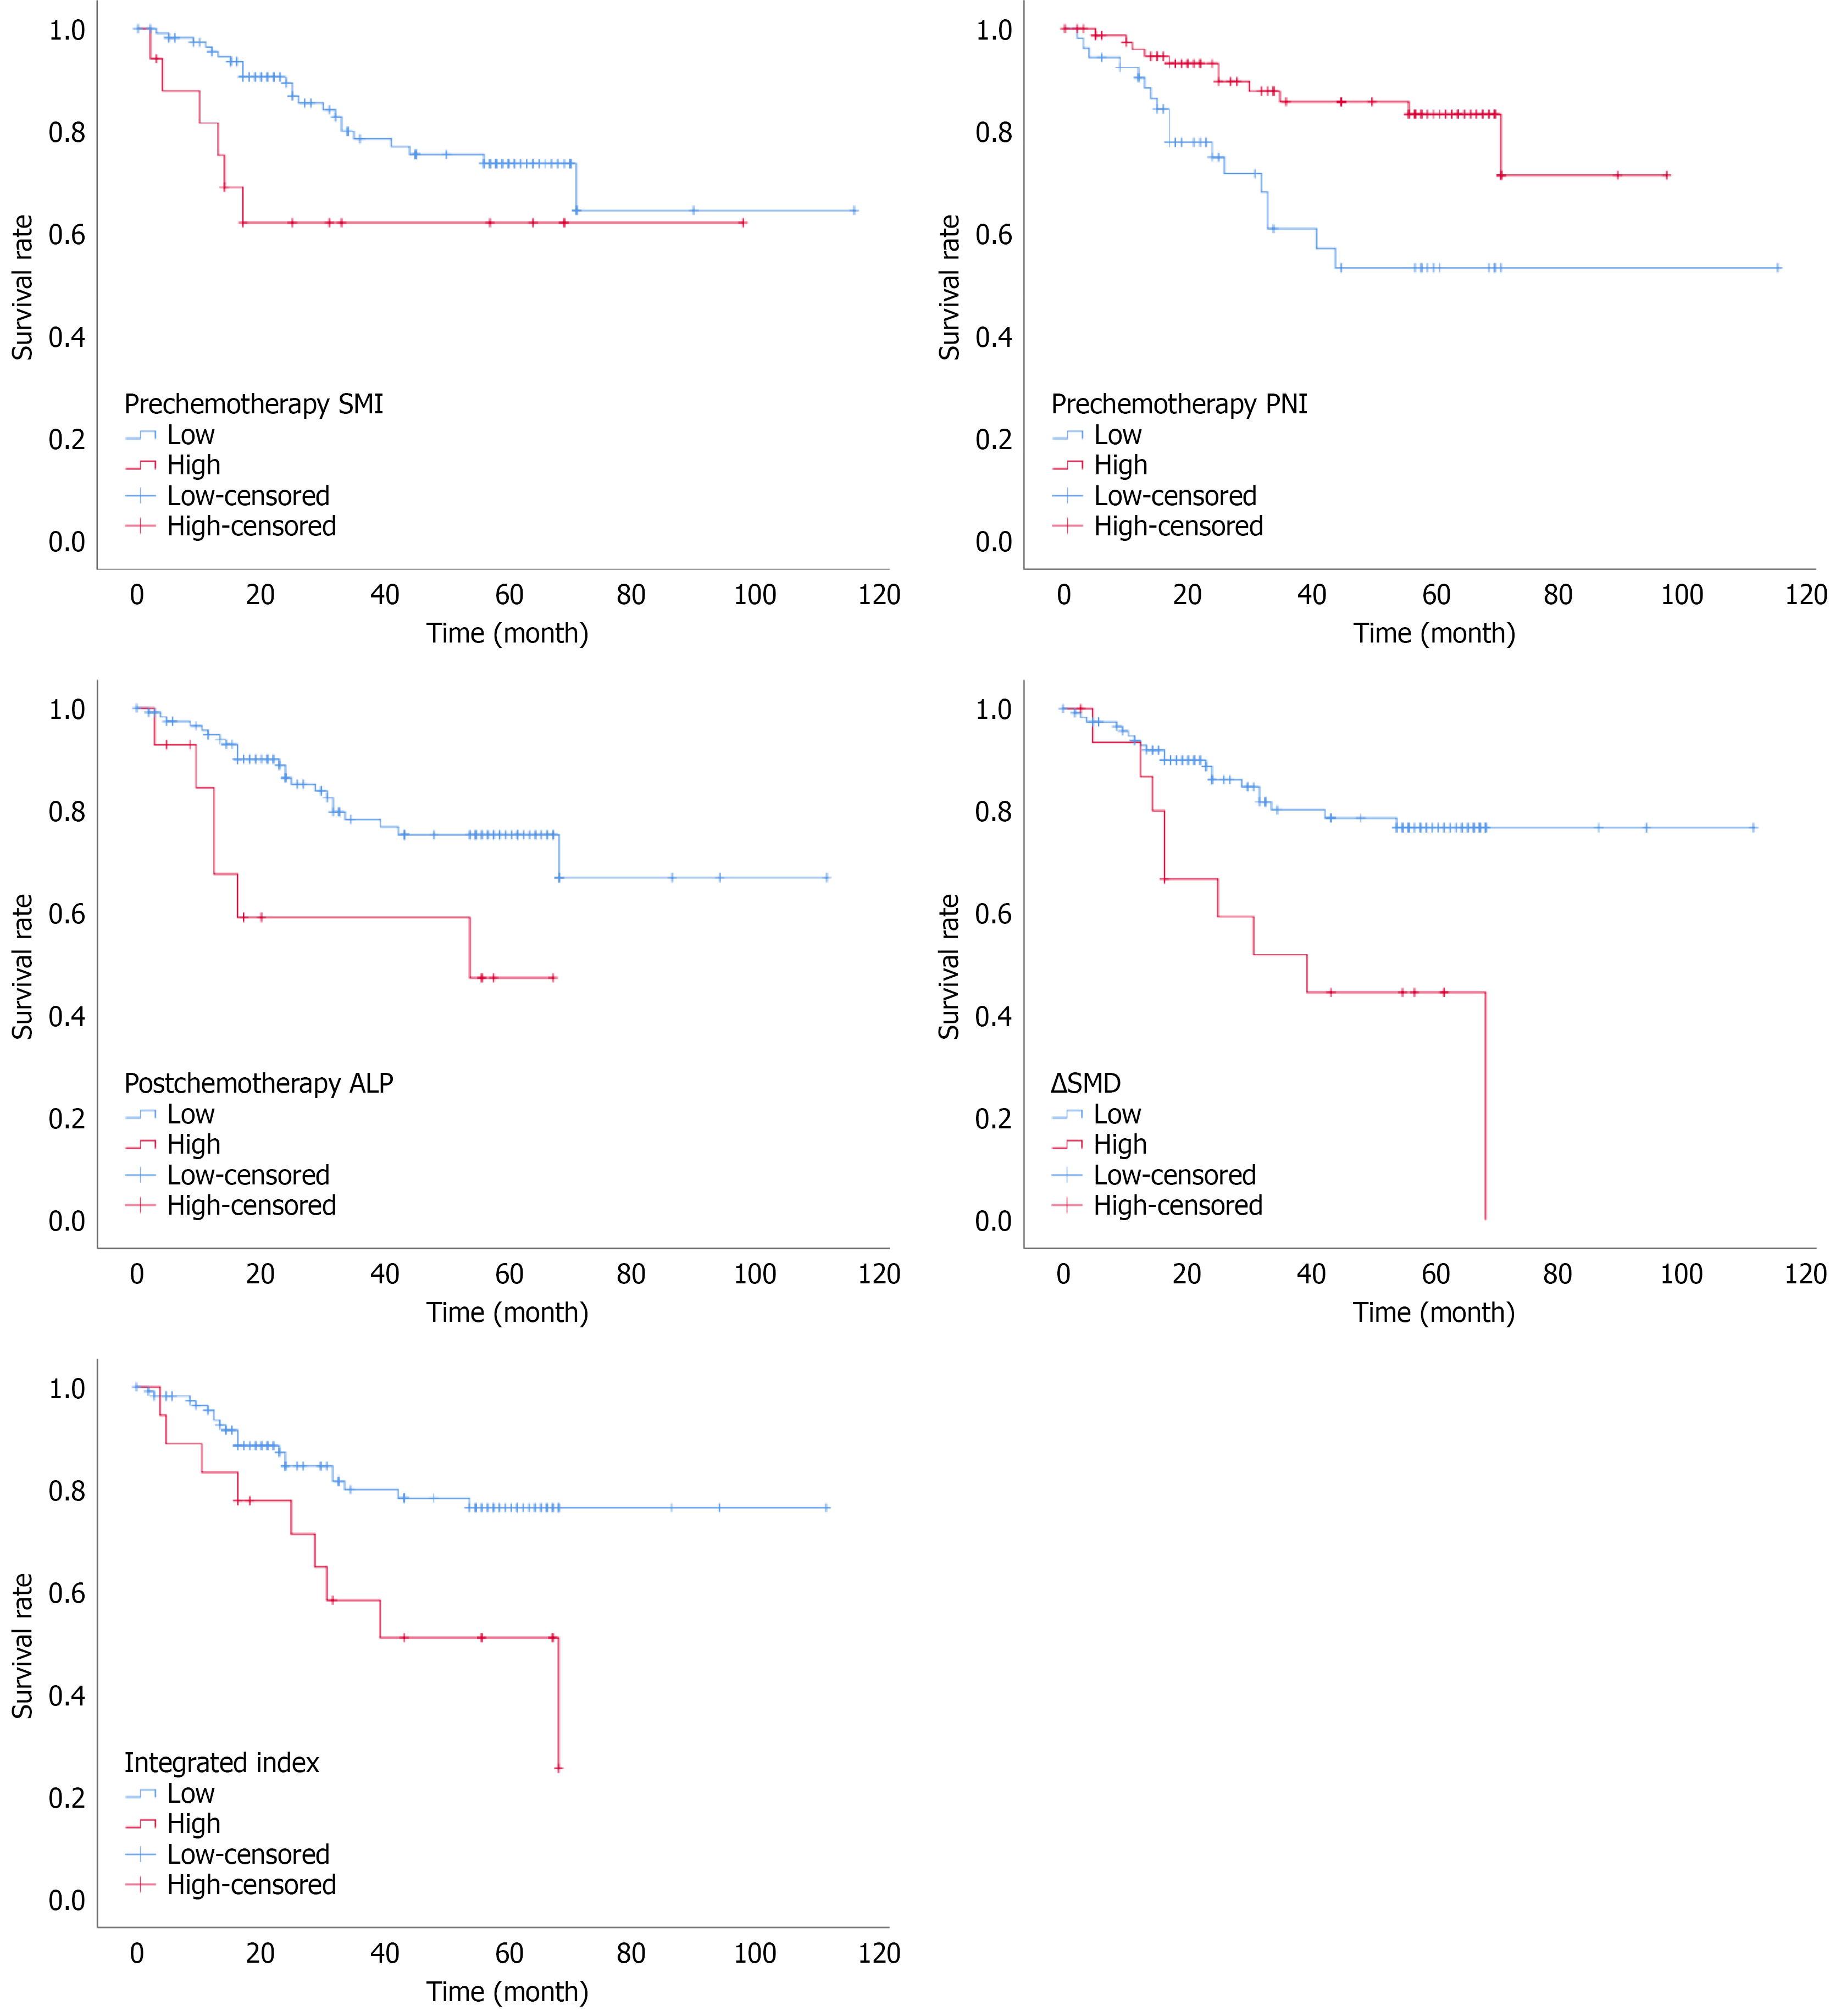
Figure 3 Survival curves for independent predictors in association with overall survival.
The optimal cutoff points were defined as 48.86 cm2/m2 for pre-chemotherapy skeletal muscle index, 50.25 for pre-chemotherapy prognostic nutritional index (PNI), 380 g/L for post-chemotherapy alkaline phosphatase, and 6.27 Hounsfield unit/30 days for the change in skeletal muscle density between the pre-chemotherapy and post-chemotherapy computed tomography. The integrated index was derived from predicting process for response to neoadjuvant chemotherapy, dichotomized by the value of -1.09. SMI: Skeletal muscle index; PNI: Prognostic nutritional index; ALP: Alkaline phosphatase; SMD: Skeletal muscle density.
- Citation: Yang YH, Li Y. Prognostic value of early changes in artificial intelligence-based computed tomography-measured body composition in pediatric osteosarcoma receiving neoadjuvant chemotherapy. Artif Intell Cancer 2026; 7(1): 116464
- URL: https://www.wjgnet.com/2644-3228/full/v7/i1/116464.htm
- DOI: https://dx.doi.org/10.35713/aic.v7.i1.116464