Copyright
©The Author(s) 2022.
Artif Intell Cancer. Apr 28, 2022; 3(2): 27-41
Published online Apr 28, 2022. doi: 10.35713/aic.v3.i2.27
Published online Apr 28, 2022. doi: 10.35713/aic.v3.i2.27
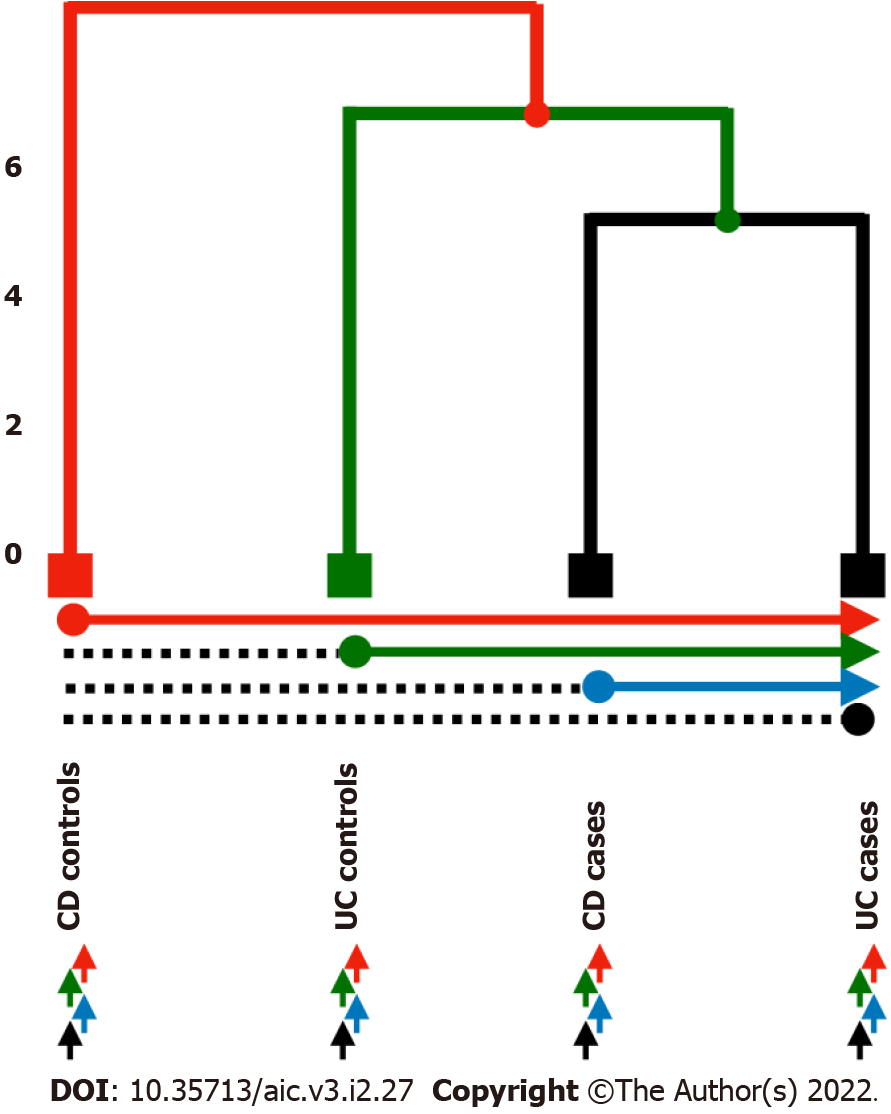
Figure 1 Pairwise leaves comparison to be tested.
Hierarchical structure amounts to strategy 1 while horizontal and bottom arrows describe strategies 2 and 3 respectively. Highlighted in red, green, blue, and black the 4 possible comparisons amongst group of patients. UC: Ulcerative colitis; CD: Crohn’s disease.
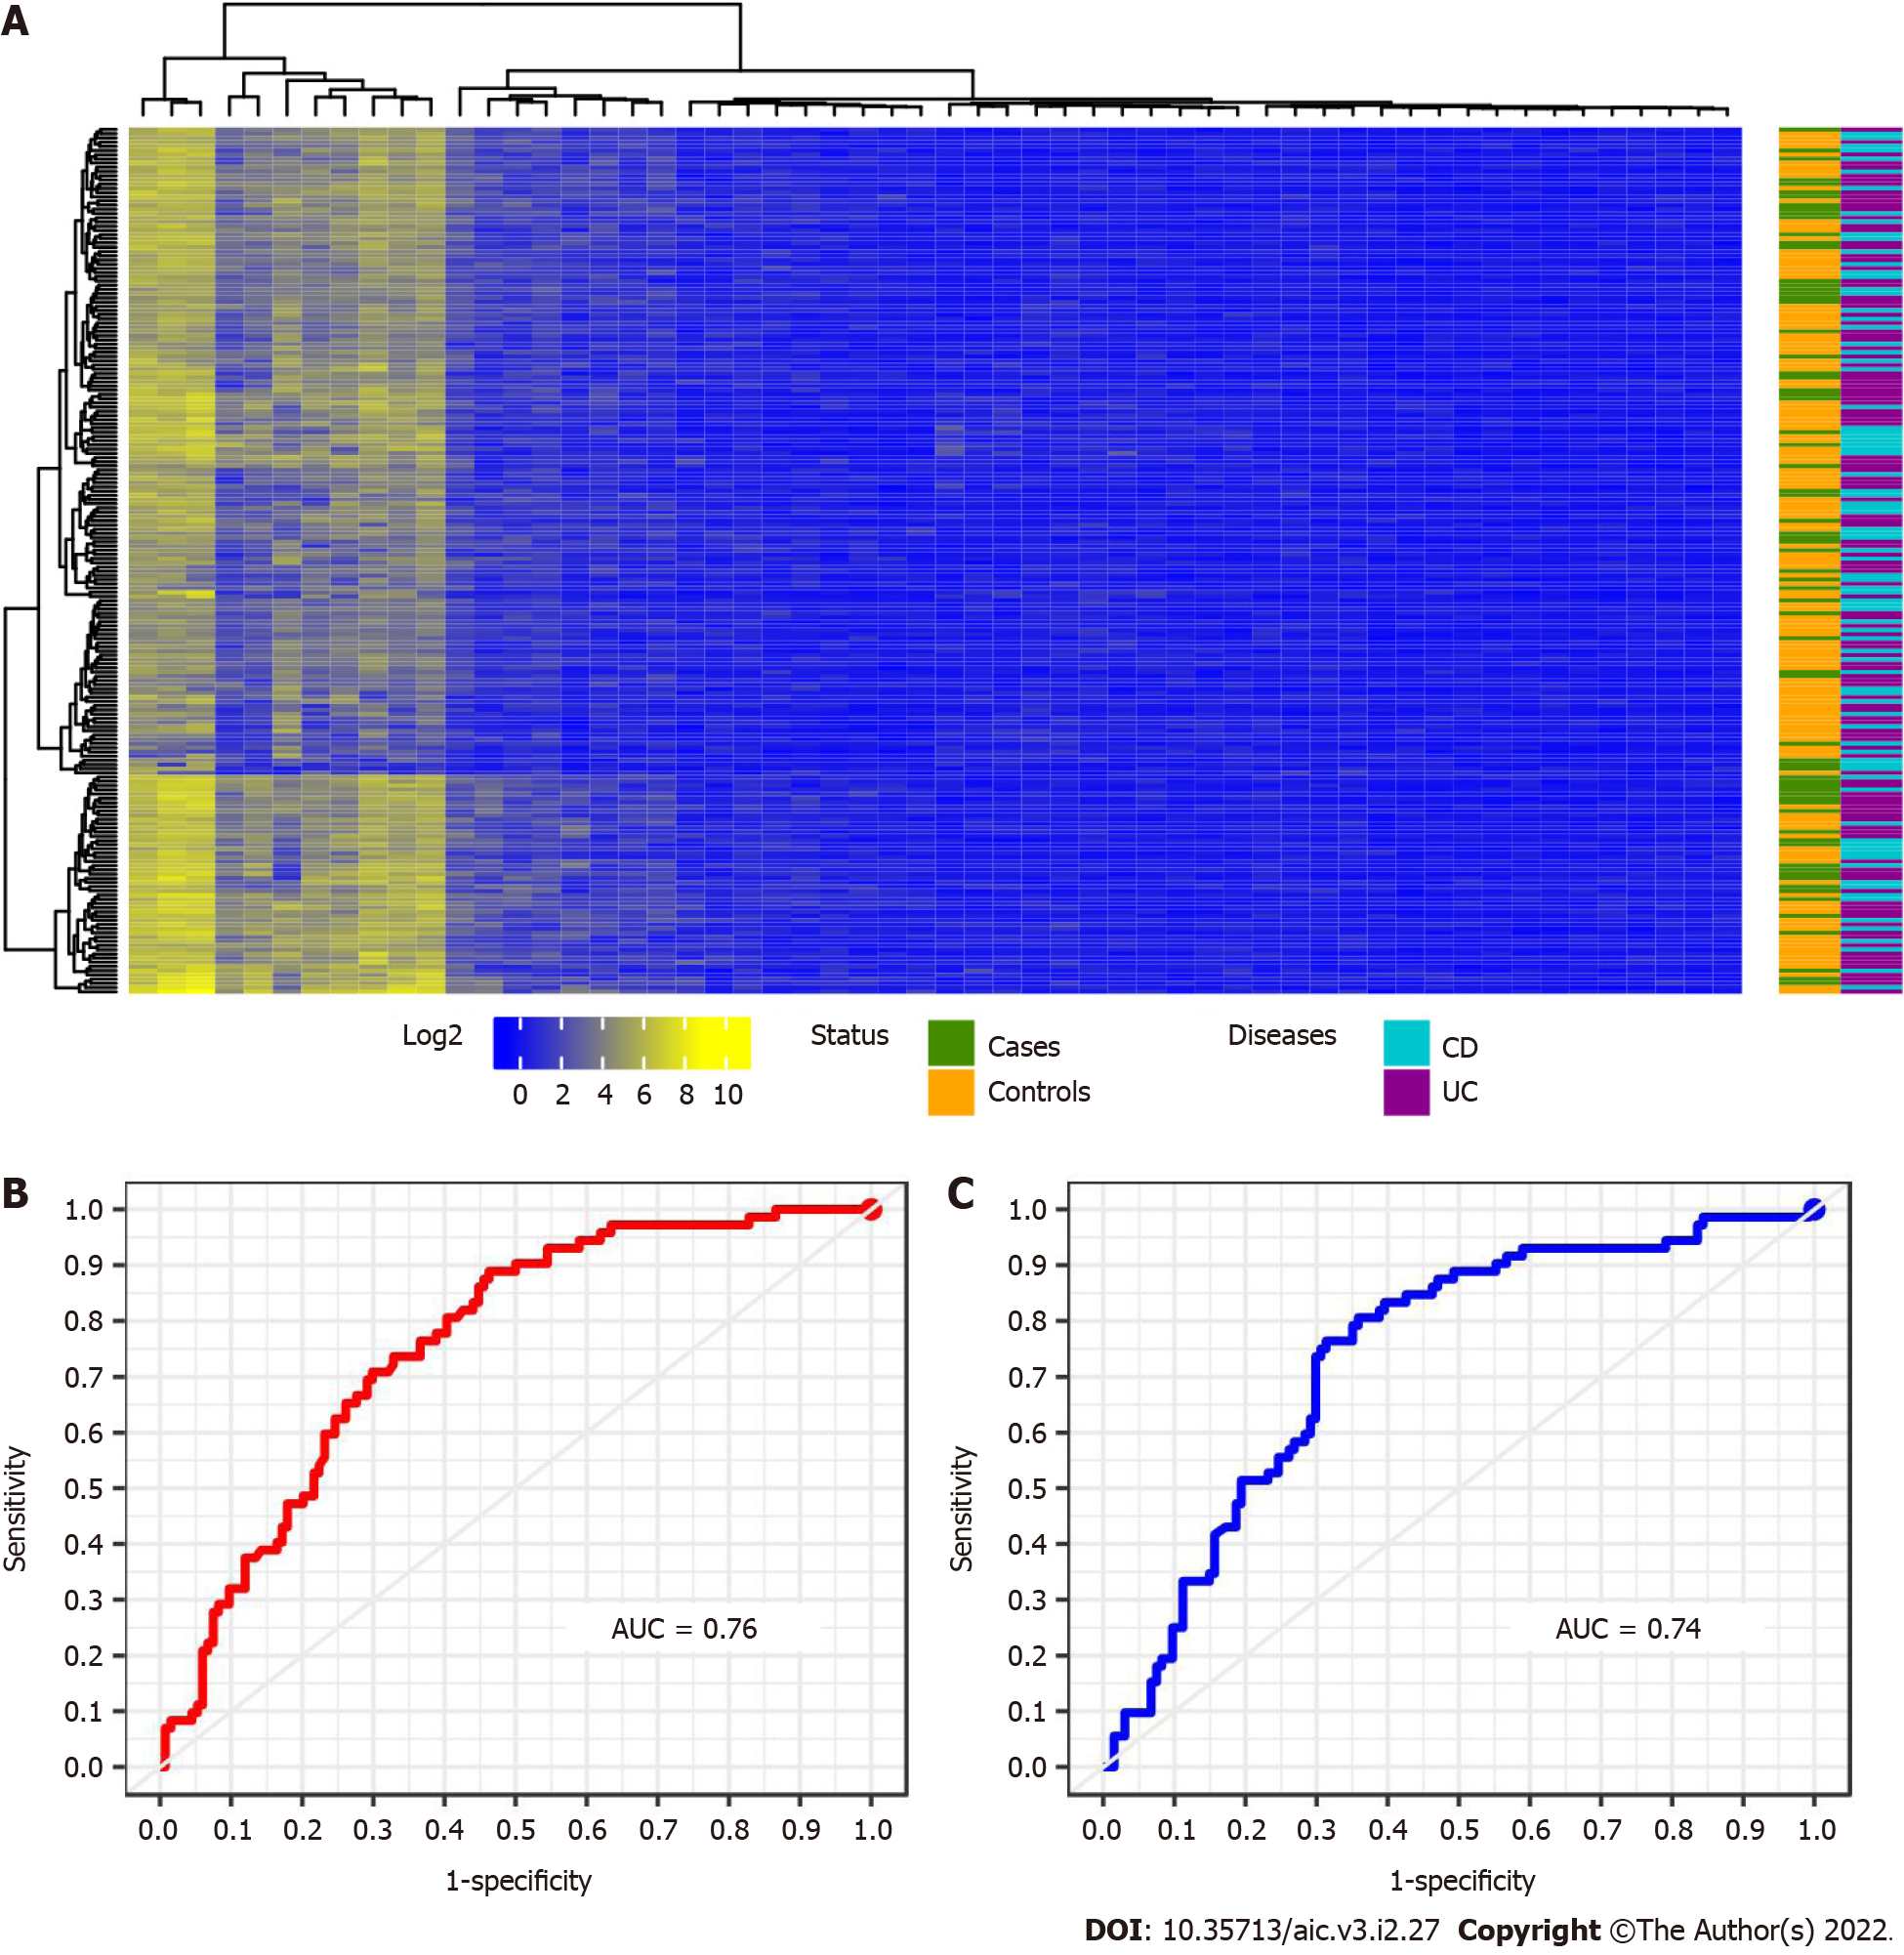
Figure 2 All patients hierarchical and leaning performance.
A: Heatmap of the 56- selected miRNA intensity. Colour corresponding to the status of the patients: Purple: Ulcerative colitis patients; light blue: Crohn’s disease patients; green: cases and yellow: Controls; B: Receiver operating characteristic curve for the classification using random forests analysis; C: Using L-SVM models for the 56 selected miRNA. AUC: Area under the curve.
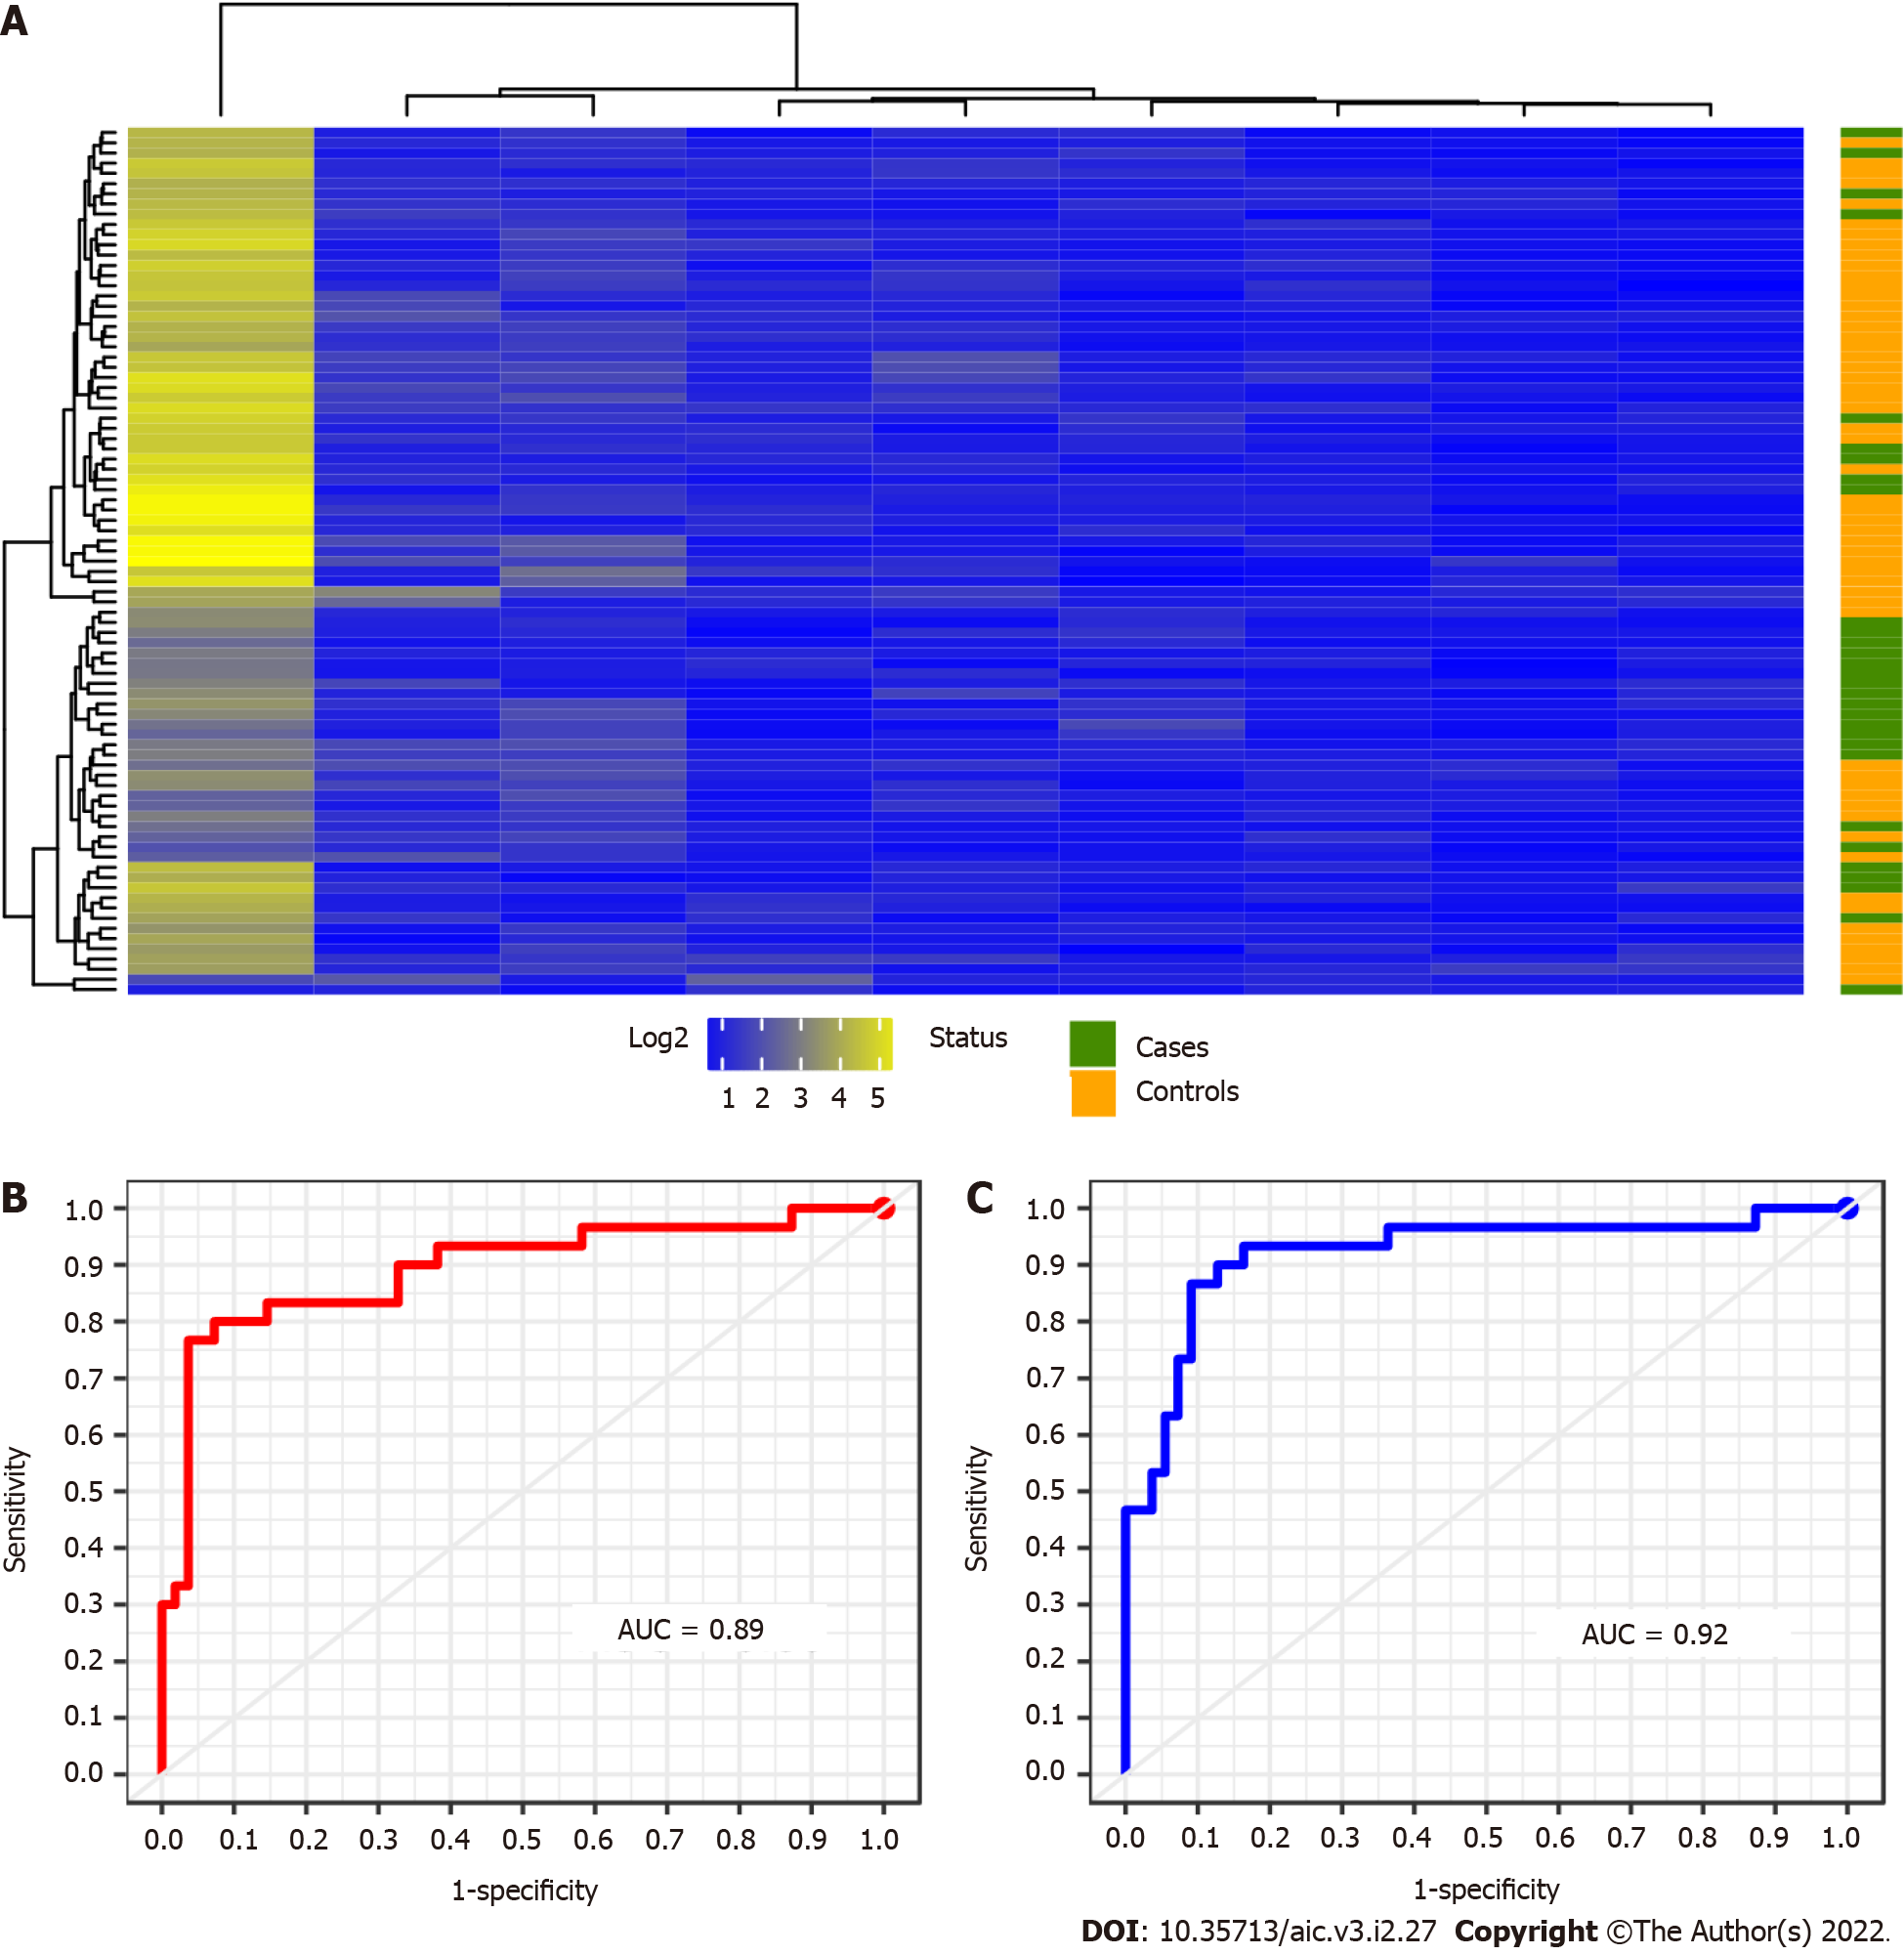
Figure 3 Crohn’s disease patients hierarchical and leaning performance.
A: Heatmap of the 9-selected miRNA intensity. Colour corresponding to the status of the patients: Purple: green: Cases and yellow: Controls; B: Receiver operating characteristic curve for the classification using random forests analysis; C: Using L-SVM models for the 9 selected miRNA. AUC: Area under the curve.
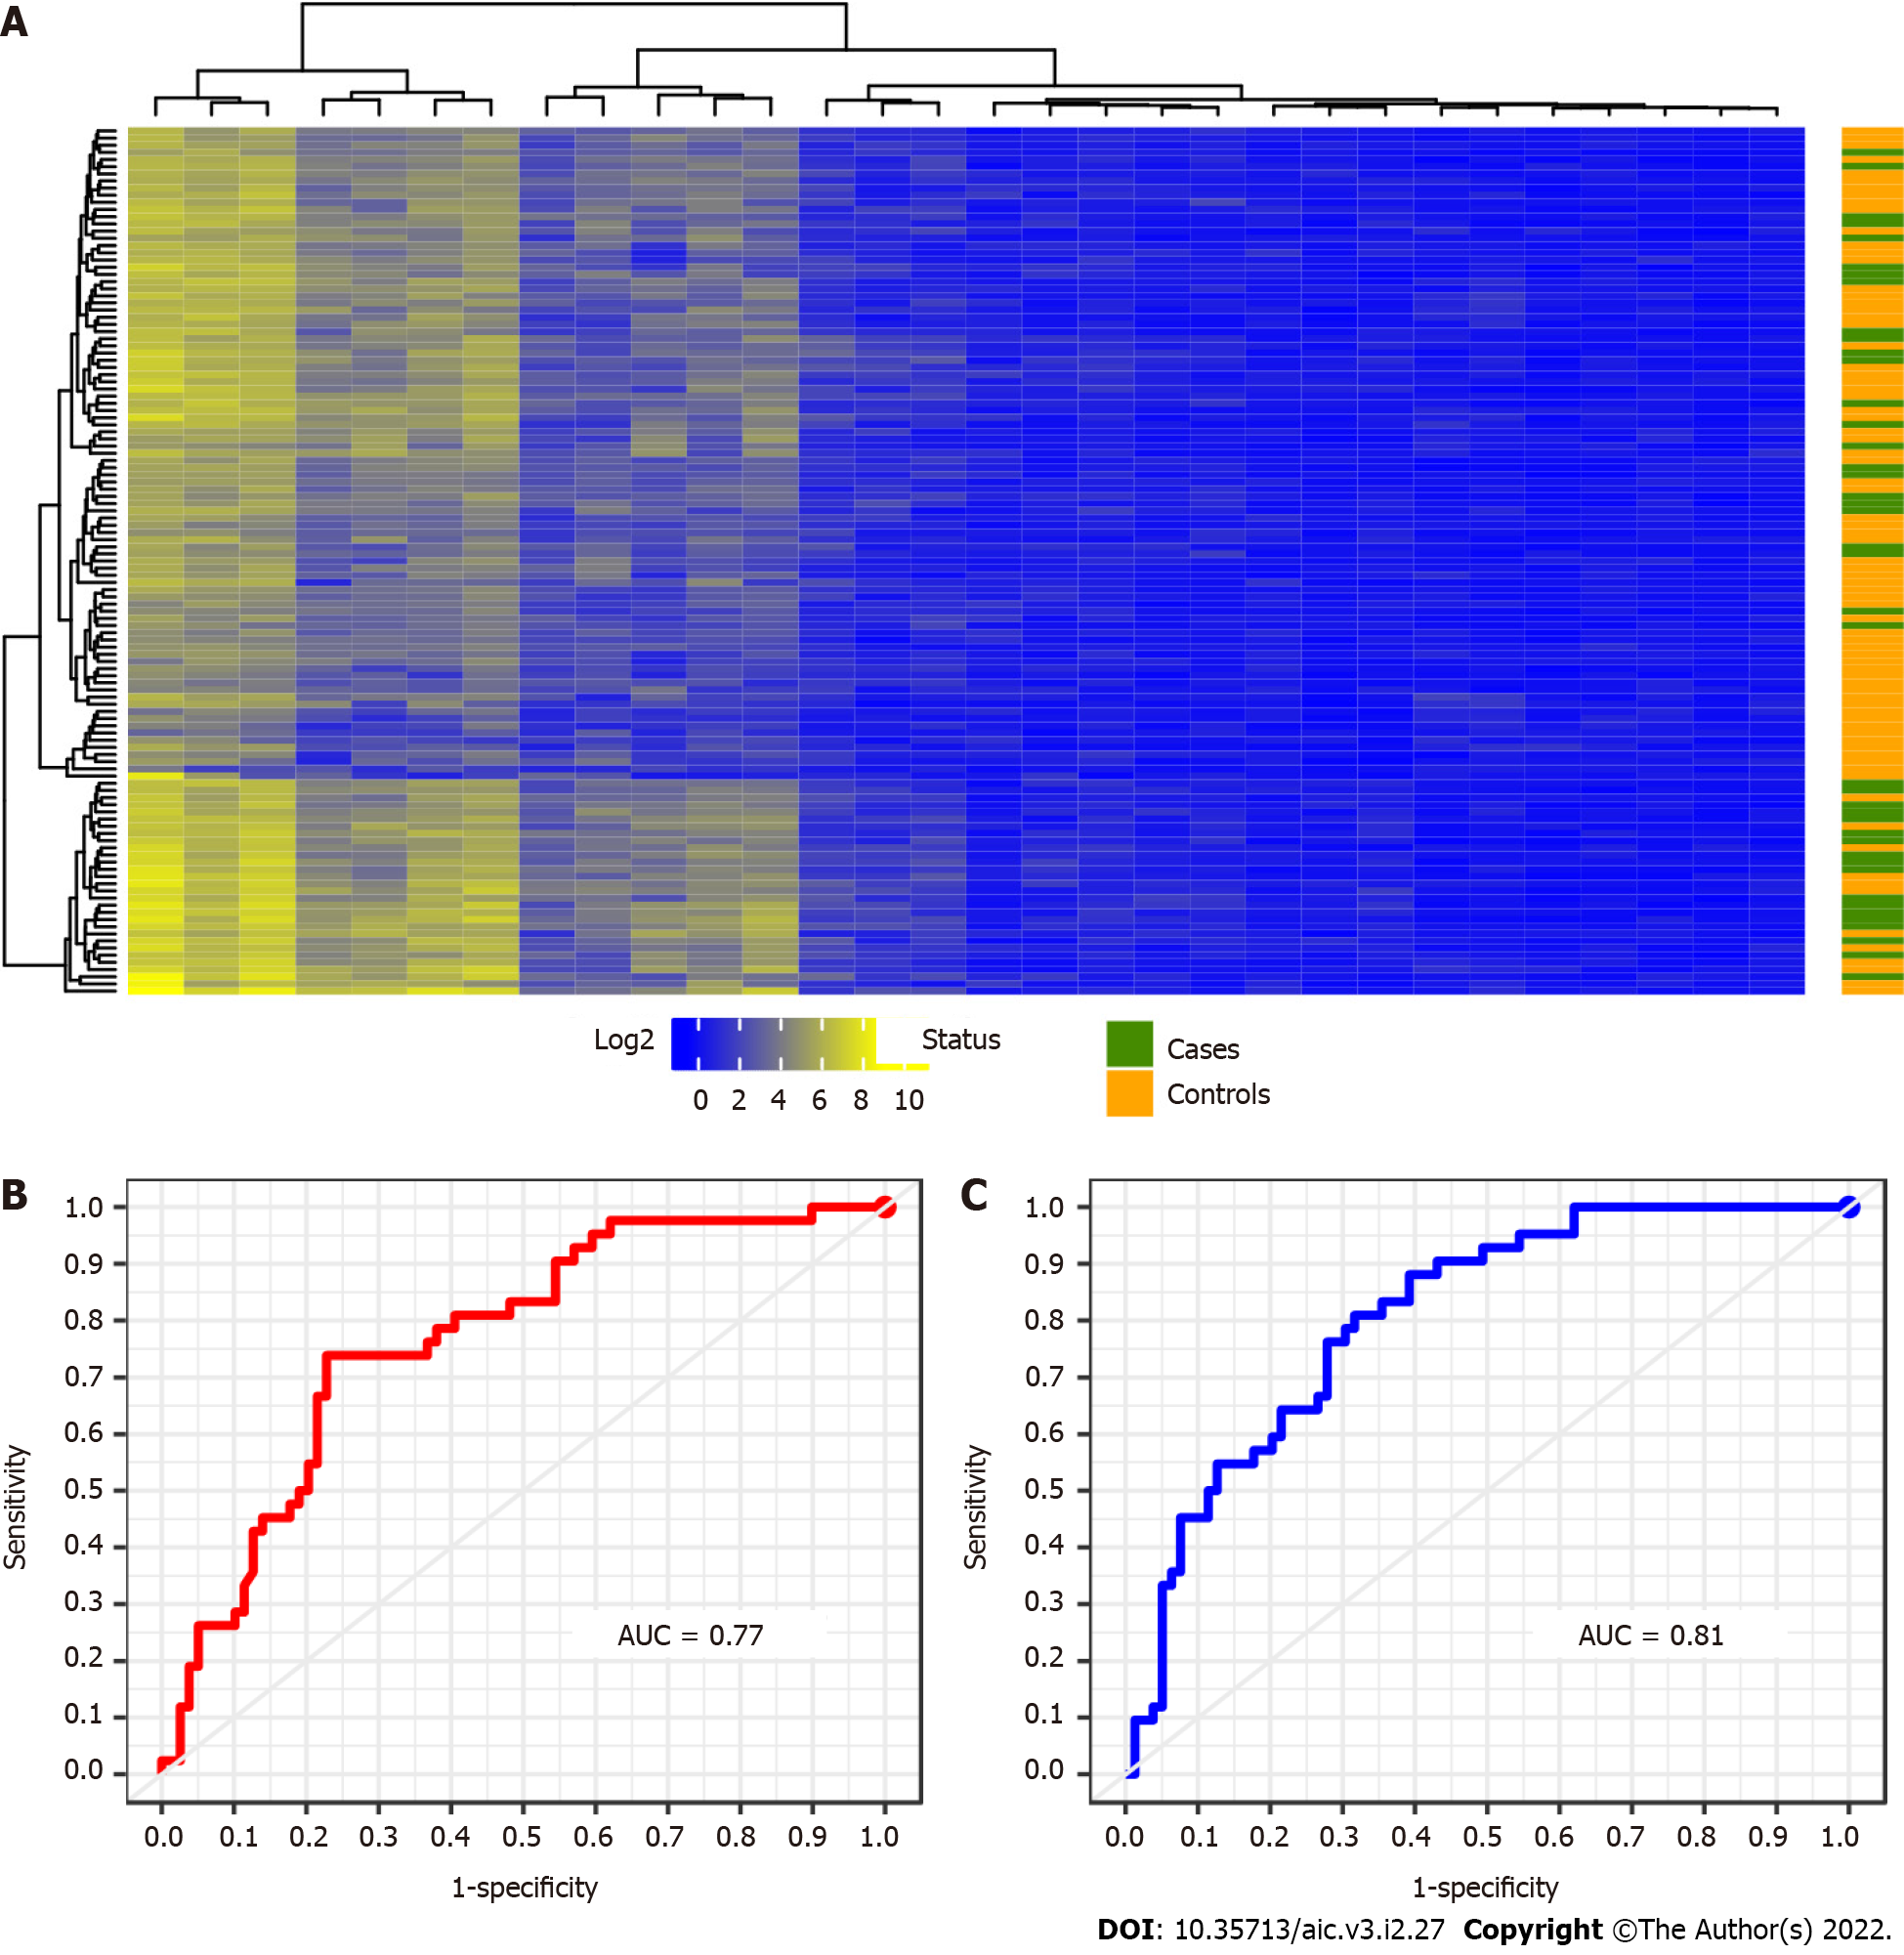
Figure 4 Ulcerative colitis patients hierarchical and leaning performance.
A: Heatmap of the 30-selected miRNA intensity. Colour corresponding to the status of the patients: Purple: Green: Cases and yellow: Controls; B: Receiver operating characteristic curve for the classification using random forests analysis; C: Using L-SVM models for the 30-selected miRNA. AUC: Area under the curve.
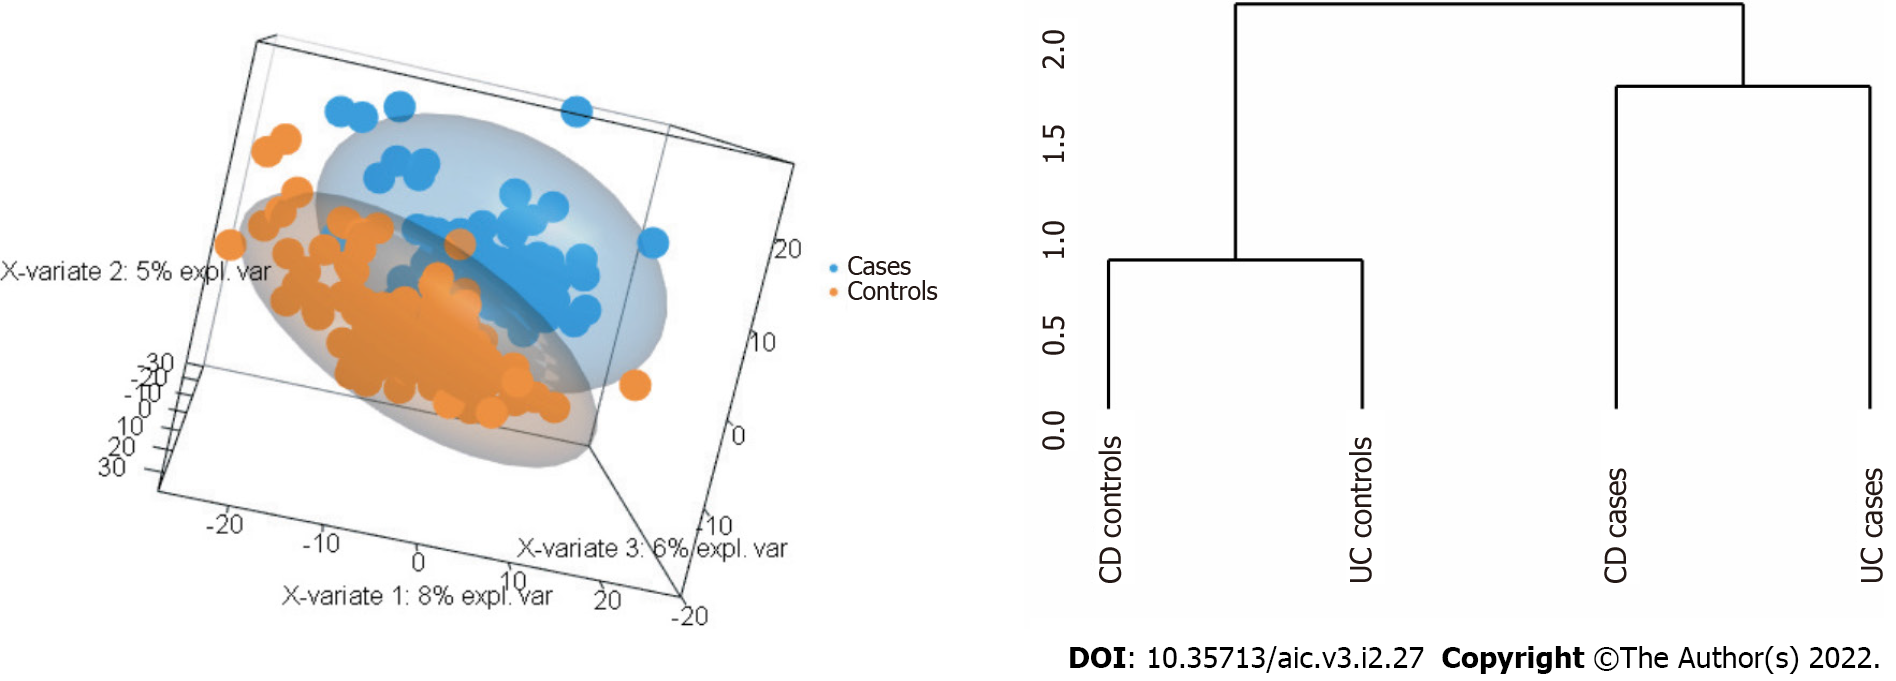
Figure 5 Partial least squares discriminant analysis base.
Left-hand side panel: Patient-control stratification (i.e. orange-blue) in three dimensional view with 152 miRNAs; Right-hand side panel: Classification tree with the 152 miRNAs selected by sPLS-DA.
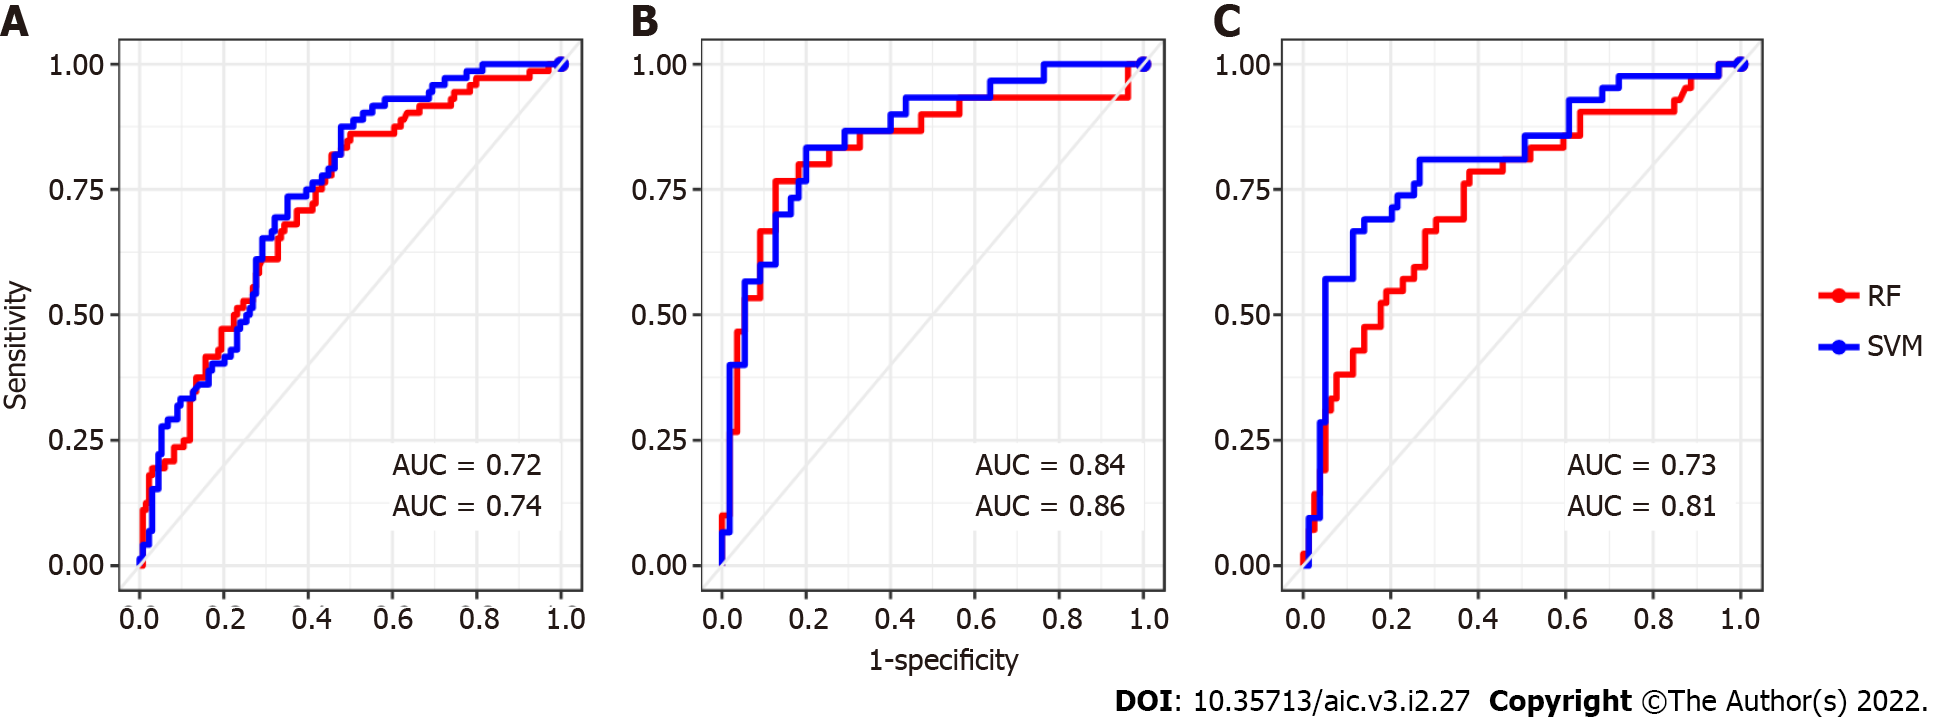
Figure 6 Final performance of each reconstructed sub-signature.
A: Receiver operating characteristic curve amounts to all patients learned classification by a signature corresponding to 13 selected miRNA; B: Similarly to the Crohn’s disease patients classification of 5 selected miRNA; C: Ulcerative colitis patients classified according to 9 selected miRNA.
- Citation: Abaach M, Morilla I. Learning models for colorectal cancer signature reconstruction and classification in patients with chronic inflammatory bowel disease. Artif Intell Cancer 2022; 3(2): 27-41
- URL: https://www.wjgnet.com/2644-3228/full/v3/i2/27.htm
- DOI: https://dx.doi.org/10.35713/aic.v3.i2.27


