Copyright
©The Author(s) 2022.
Artif Intell Cancer. Apr 28, 2022; 3(2): 27-41
Published online Apr 28, 2022. doi: 10.35713/aic.v3.i2.27
Published online Apr 28, 2022. doi: 10.35713/aic.v3.i2.27
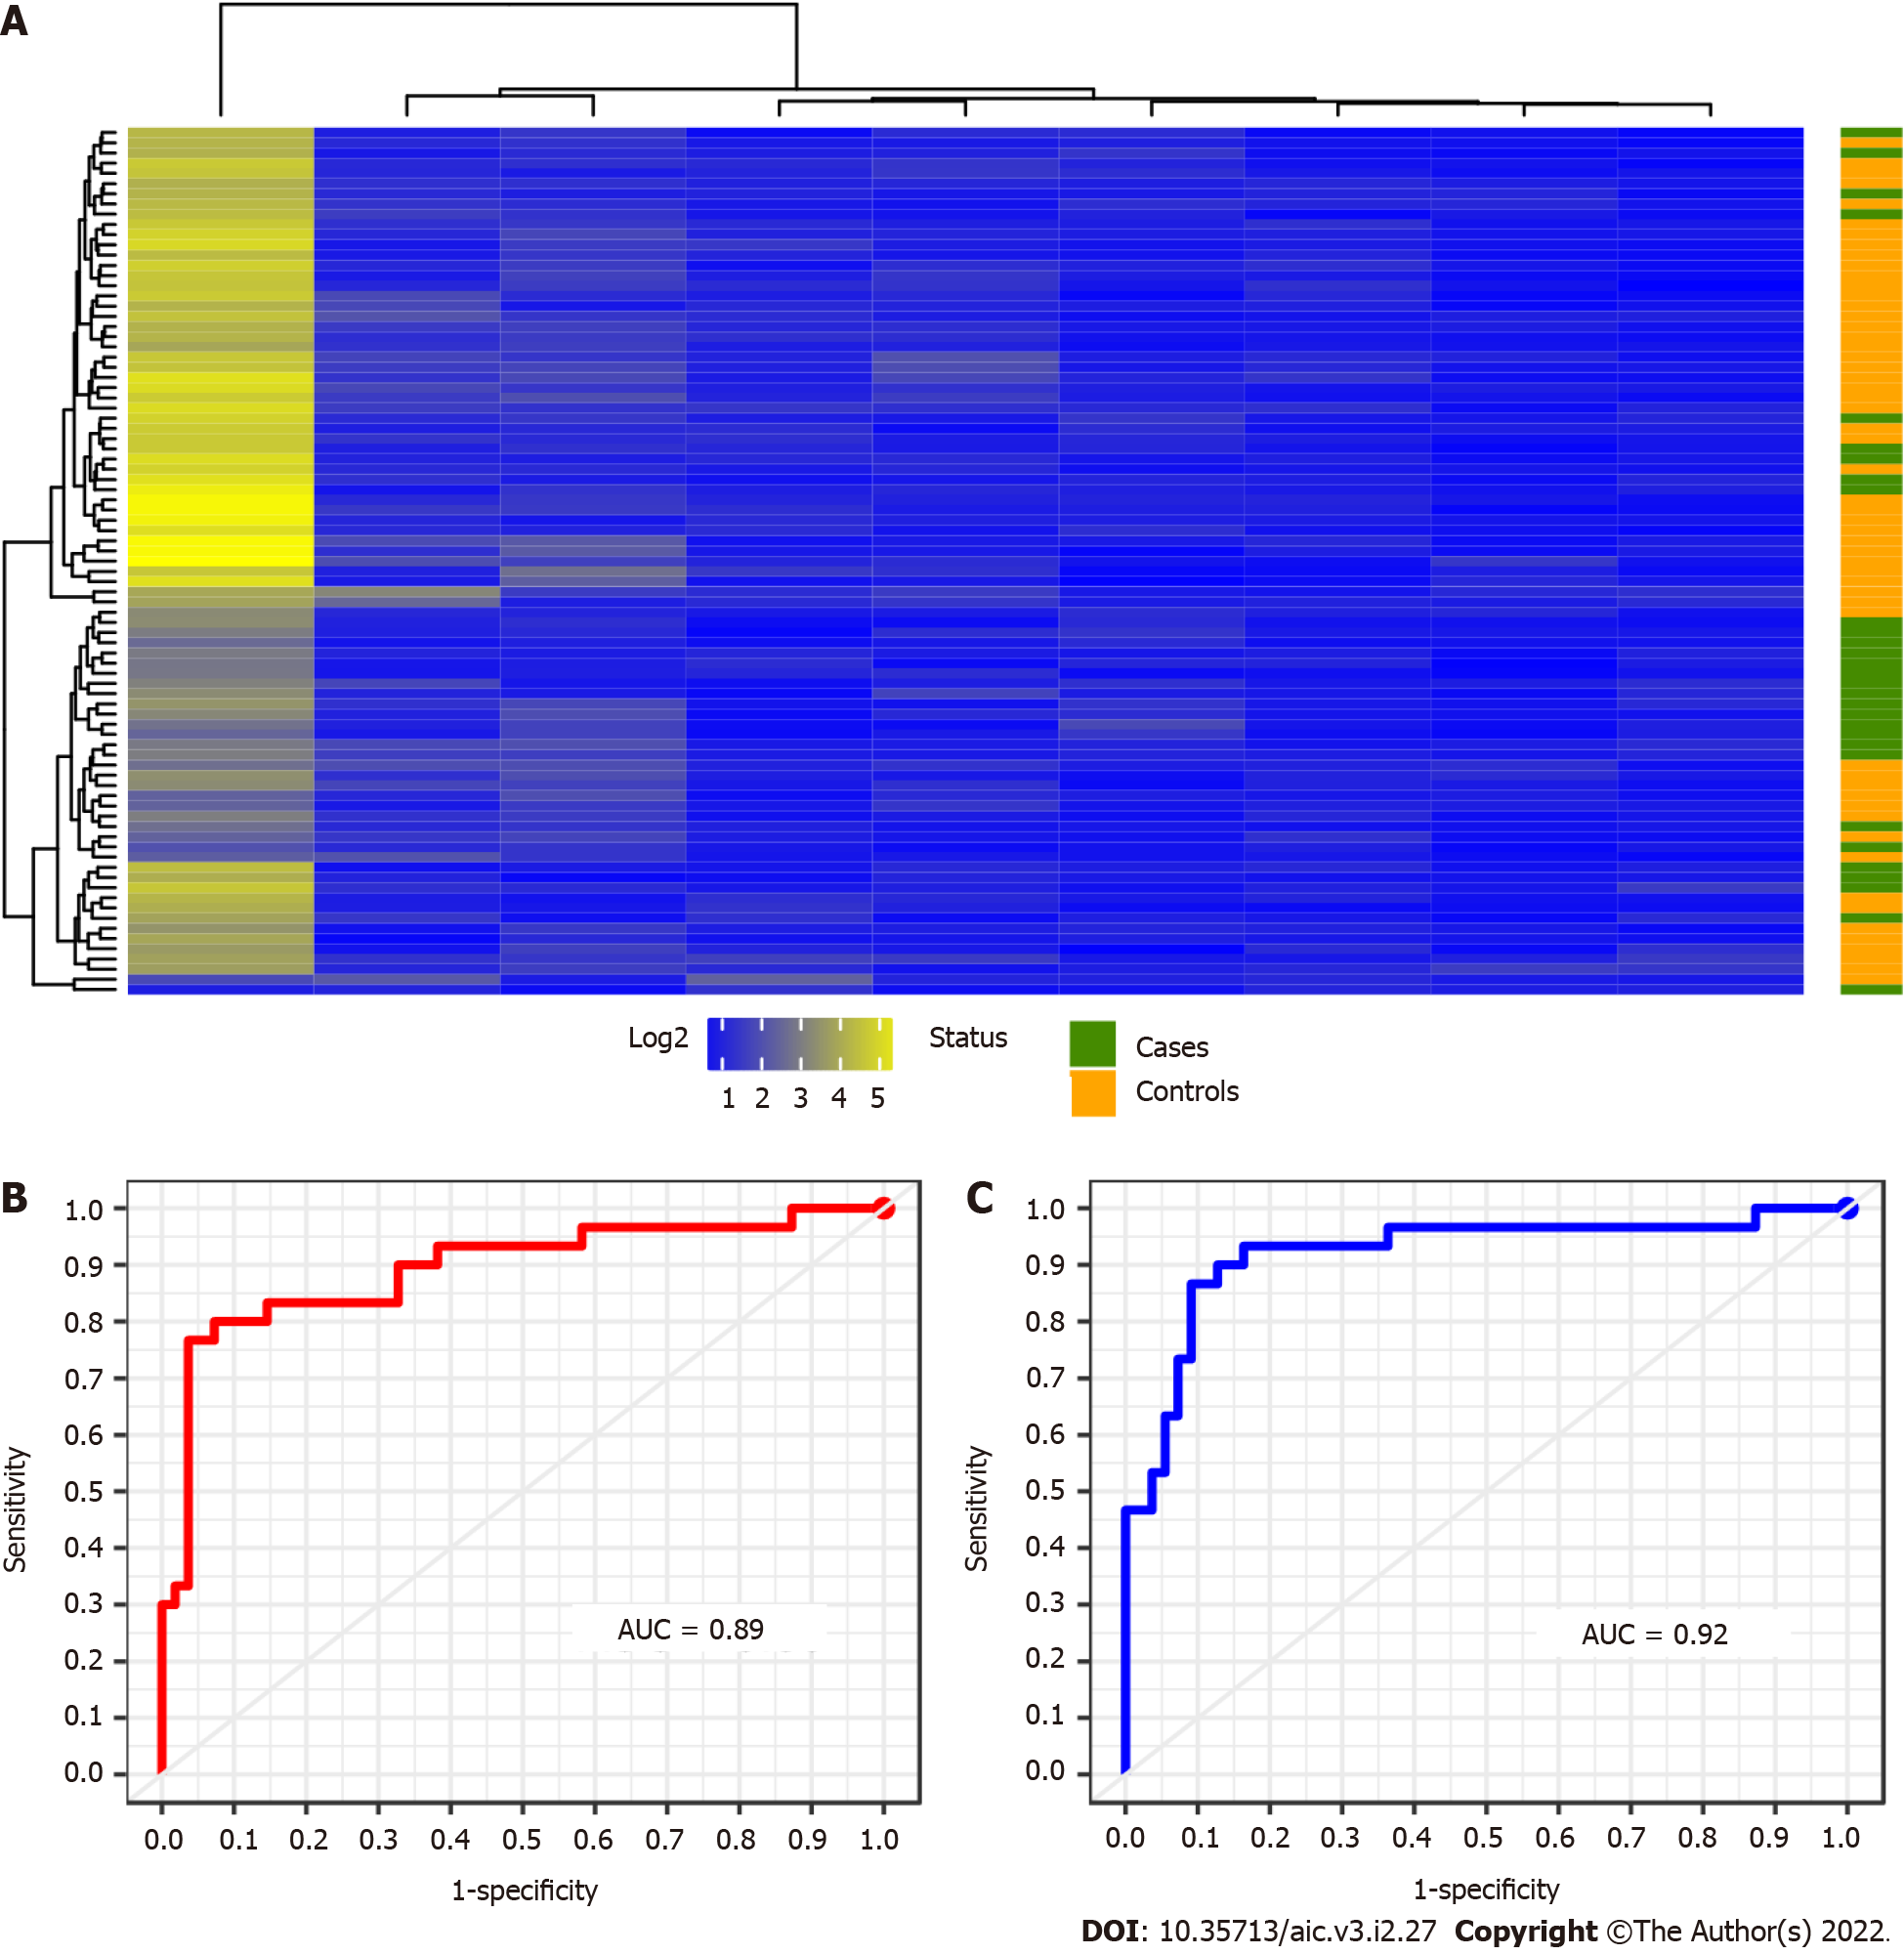
Figure 3 Crohn’s disease patients hierarchical and leaning performance.
A: Heatmap of the 9-selected miRNA intensity. Colour corresponding to the status of the patients: Purple: green: Cases and yellow: Controls; B: Receiver operating characteristic curve for the classification using random forests analysis; C: Using L-SVM models for the 9 selected miRNA. AUC: Area under the curve.
- Citation: Abaach M, Morilla I. Learning models for colorectal cancer signature reconstruction and classification in patients with chronic inflammatory bowel disease. Artif Intell Cancer 2022; 3(2): 27-41
- URL: https://www.wjgnet.com/2644-3228/full/v3/i2/27.htm
- DOI: https://dx.doi.org/10.35713/aic.v3.i2.27


