Copyright
©The Author(s) 2020.
World J Clin Cases. Mar 6, 2020; 8(5): 854-863
Published online Mar 6, 2020. doi: 10.12998/wjcc.v8.i5.854
Published online Mar 6, 2020. doi: 10.12998/wjcc.v8.i5.854
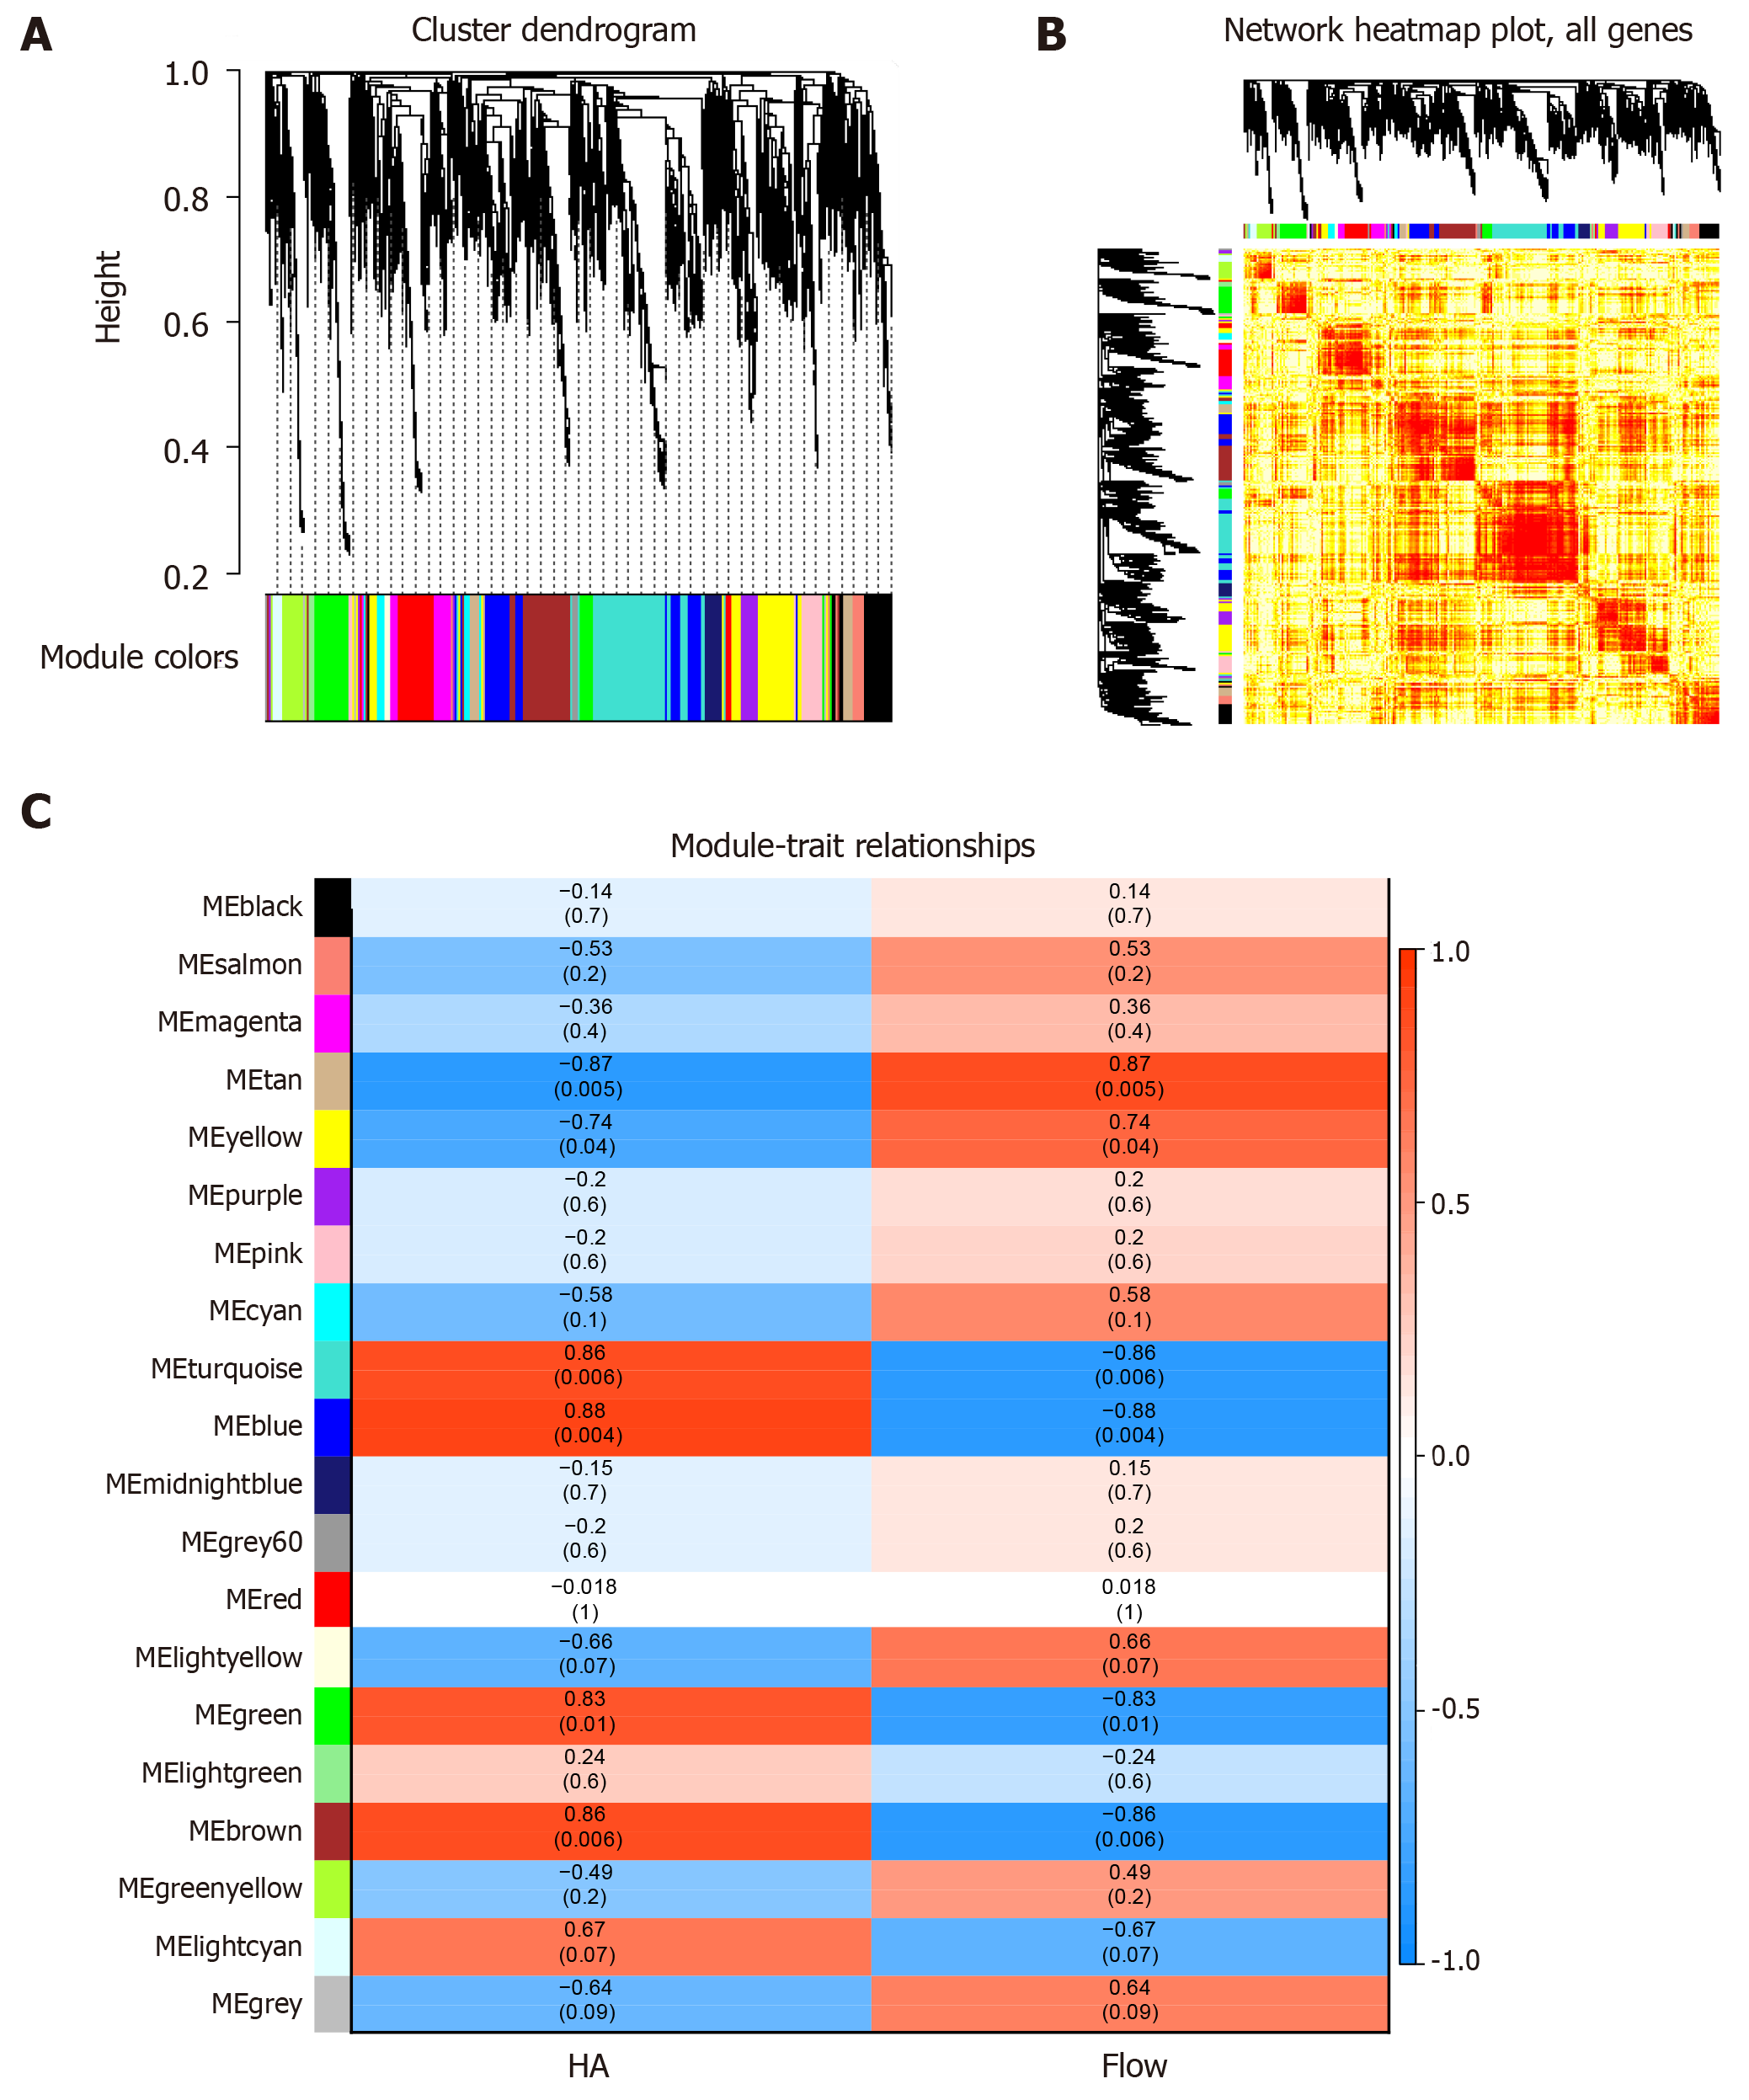
Figure 1 Synergistic expression of differentially expressed genes in patients with spinal cord injury.
A: Nineteen expression groups were identified as modules, and nineteen colors represented nineteen expression modules; B: The expression thermograms of all genes in the samples were clustered into 19 expression modules; C: Each row represents a module, and each column represents a phenotype. The color of each cell is mapped by the corresponding correlation coefficient. The values range from - 1 to 1, and the color changes from blue to white, then to red. The deeper the color, the stronger the correlation.
- Citation: Liu XY, Guo JW, Kou JQ, Sun YL, Zheng XJ. Repair mechanism of astrocytes and non-astrocytes in spinal cord injury. World J Clin Cases 2020; 8(5): 854-863
- URL: https://www.wjgnet.com/2307-8960/full/v8/i5/854.htm
- DOI: https://dx.doi.org/10.12998/wjcc.v8.i5.854


