Copyright
©The Author(s) 2019.
World J Clin Cases. Aug 6, 2019; 7(15): 2065-2074
Published online Aug 6, 2019. doi: 10.12998/wjcc.v7.i15.2065
Published online Aug 6, 2019. doi: 10.12998/wjcc.v7.i15.2065
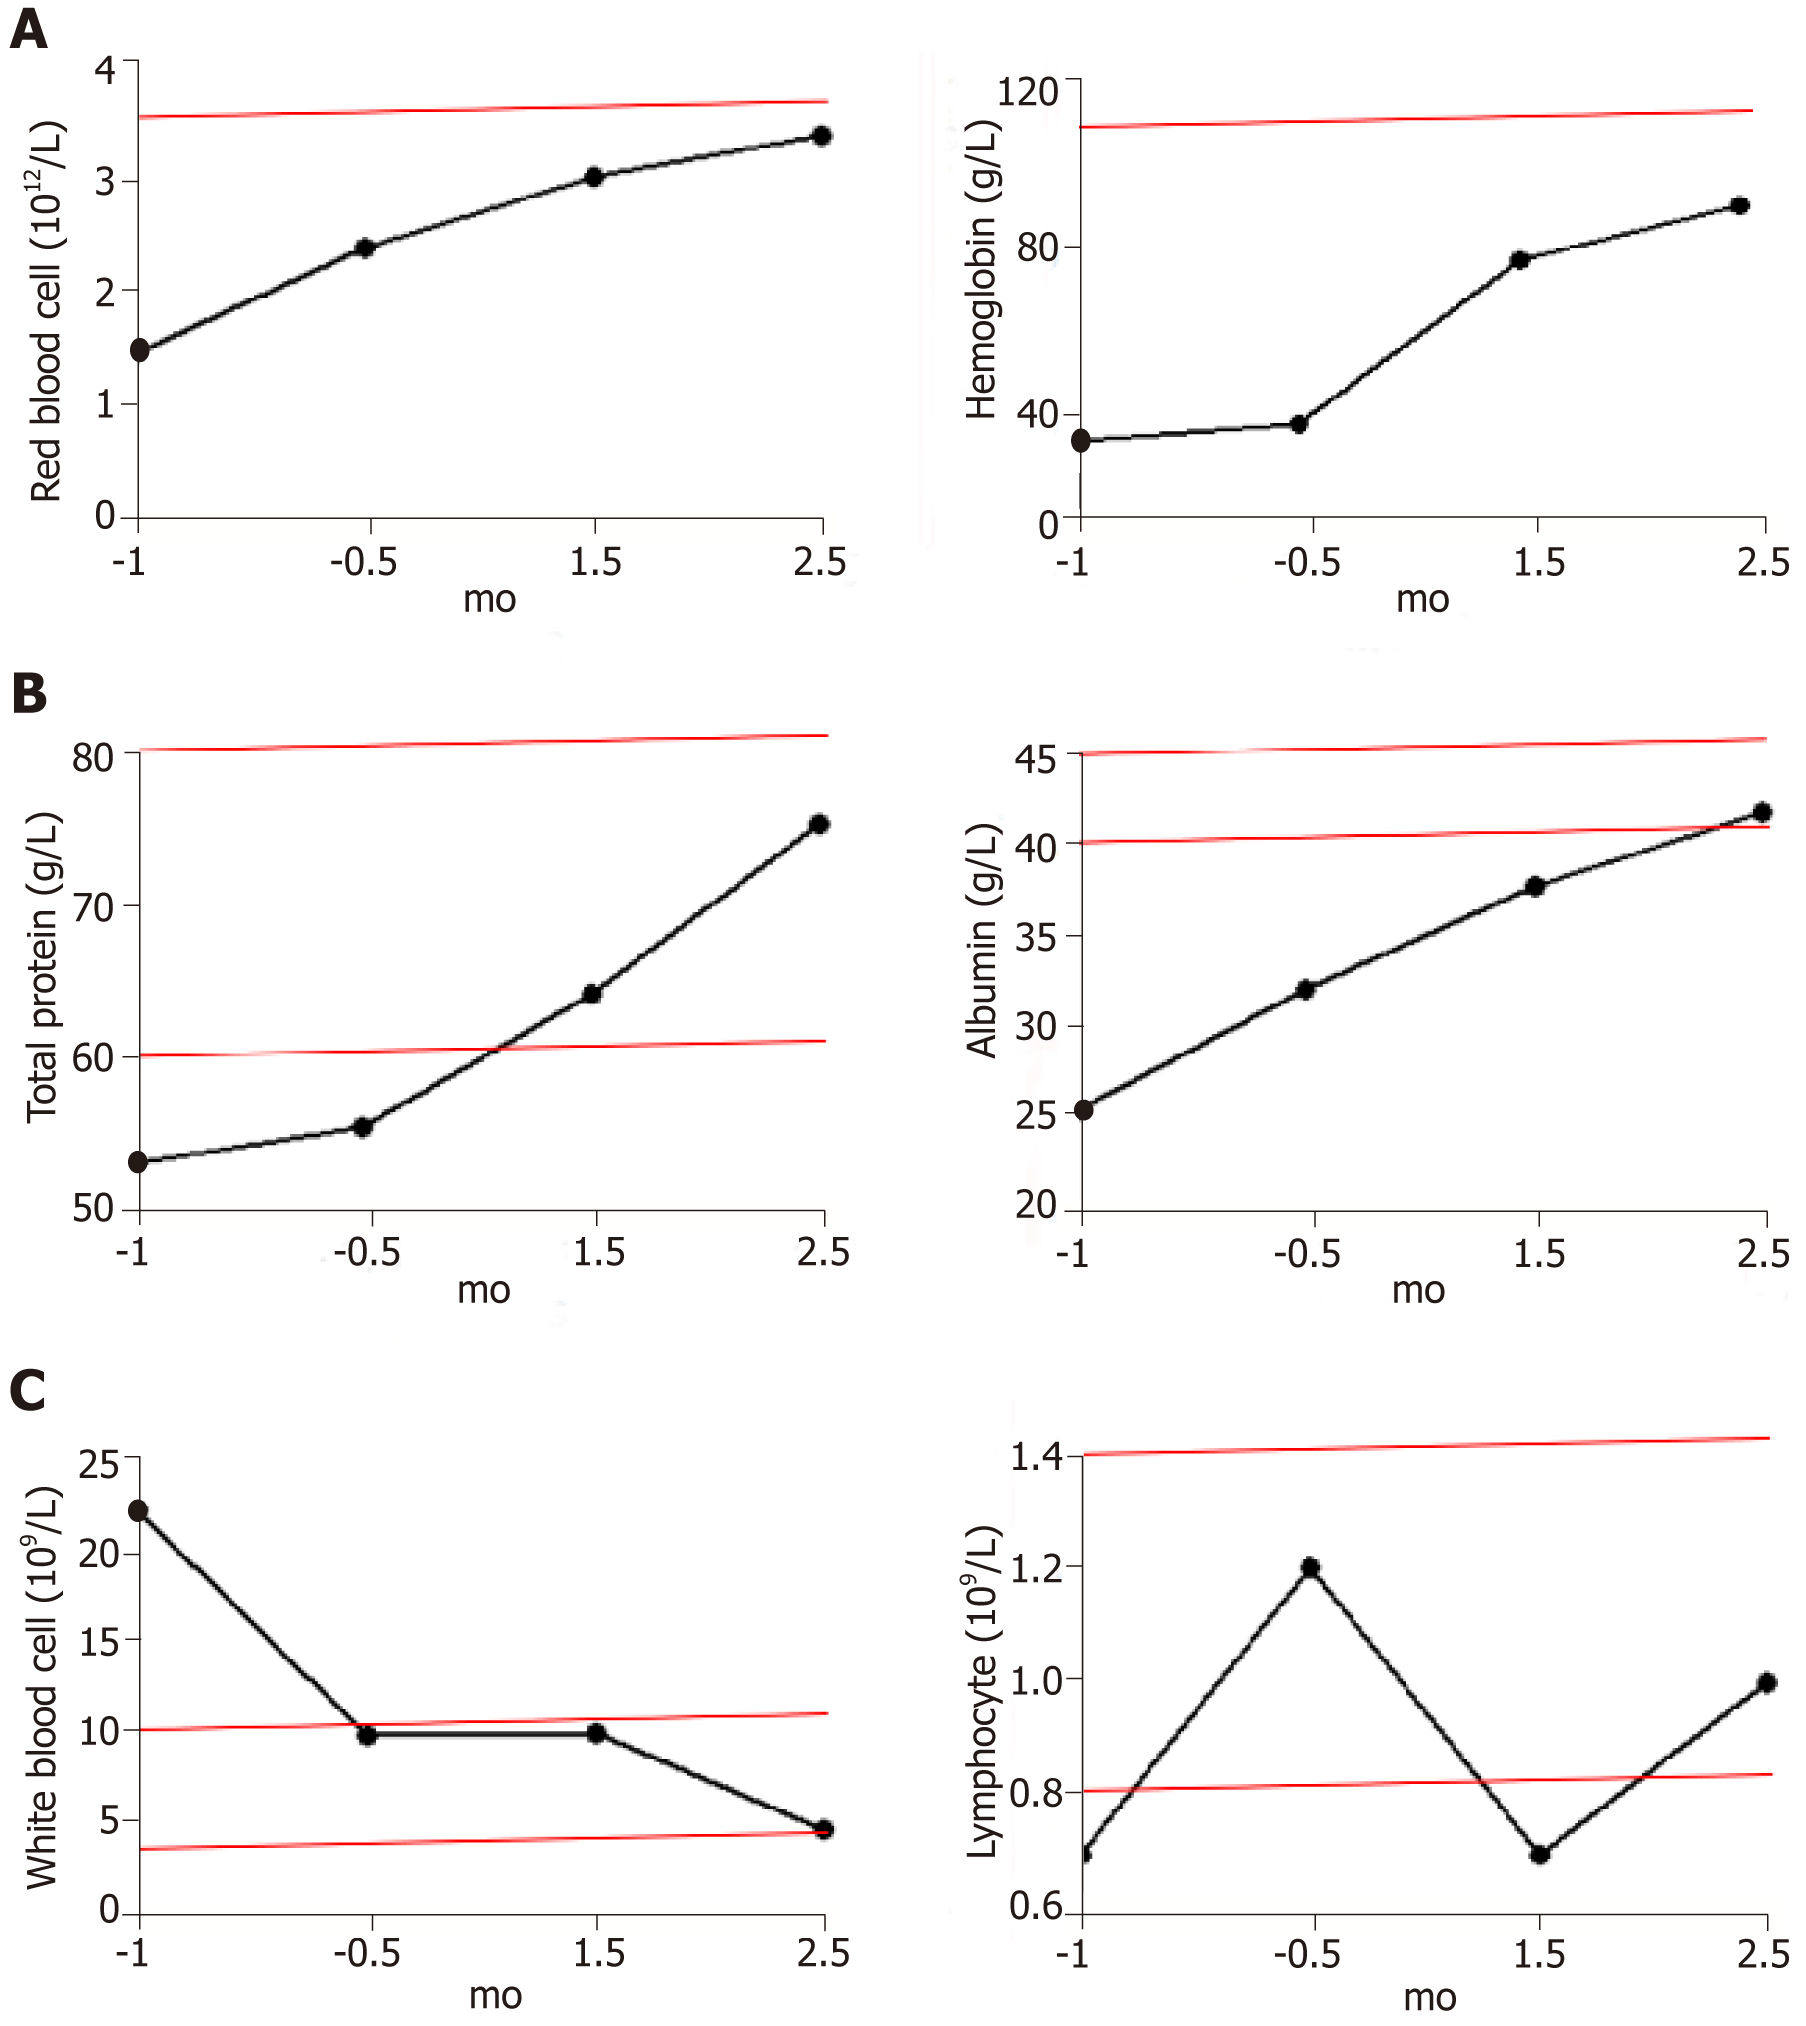
Figure 1 Blood parameters of patients before and after hydrogen treatment.
A: Red blood cell counts and hemoglobin levels; the red line in the figures represents the lower limit of the reference range; B: Total protein and albumin concentrations; the red lines in the figures represent the reference range; C: White blood cell and lymphocyte counts; the red lines in the figures represent the reference range.
- Citation: Chen JB, Pan ZB, Du DM, Qian W, Ma YY, Mu F, Xu KC. Hydrogen gas therapy induced shrinkage of metastatic gallbladder cancer: A case report. World J Clin Cases 2019; 7(15): 2065-2074
- URL: https://www.wjgnet.com/2307-8960/full/v7/i15/2065.htm
- DOI: https://dx.doi.org/10.12998/wjcc.v7.i15.2065


