Copyright
©The Author(s) 2021.
World J Clin Cases. Mar 6, 2021; 9(7): 1720-1727
Published online Mar 6, 2021. doi: 10.12998/wjcc.v9.i7.1720
Published online Mar 6, 2021. doi: 10.12998/wjcc.v9.i7.1720
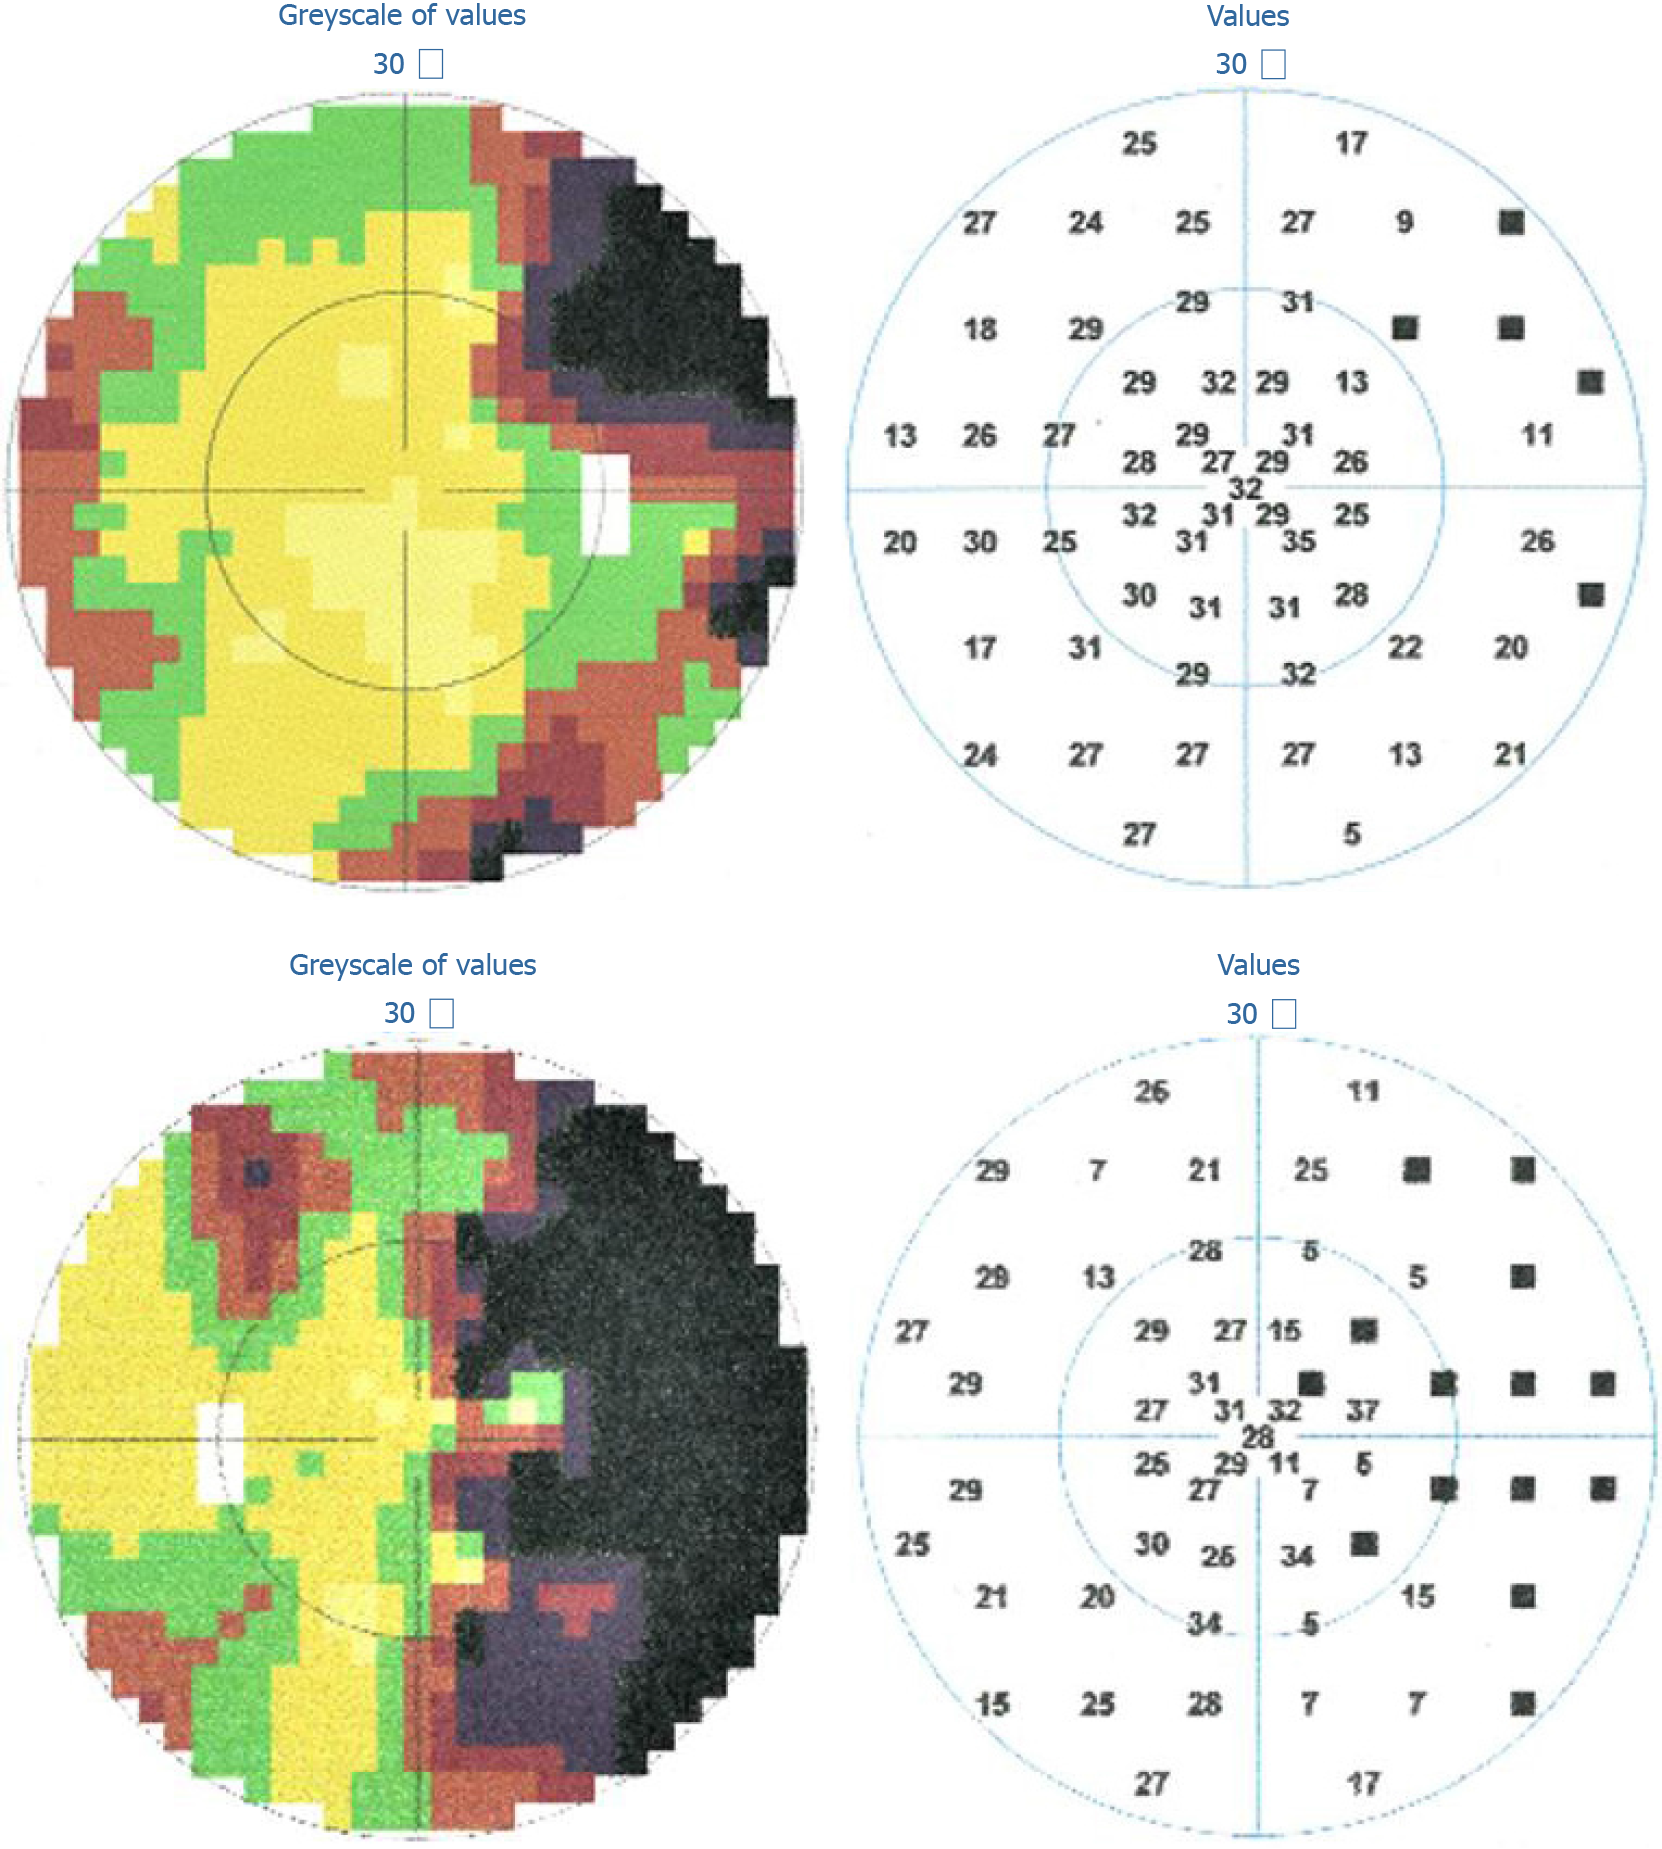
Figure 1
Visual field over the central 30 degrees showed a right homonymous hemianopia.
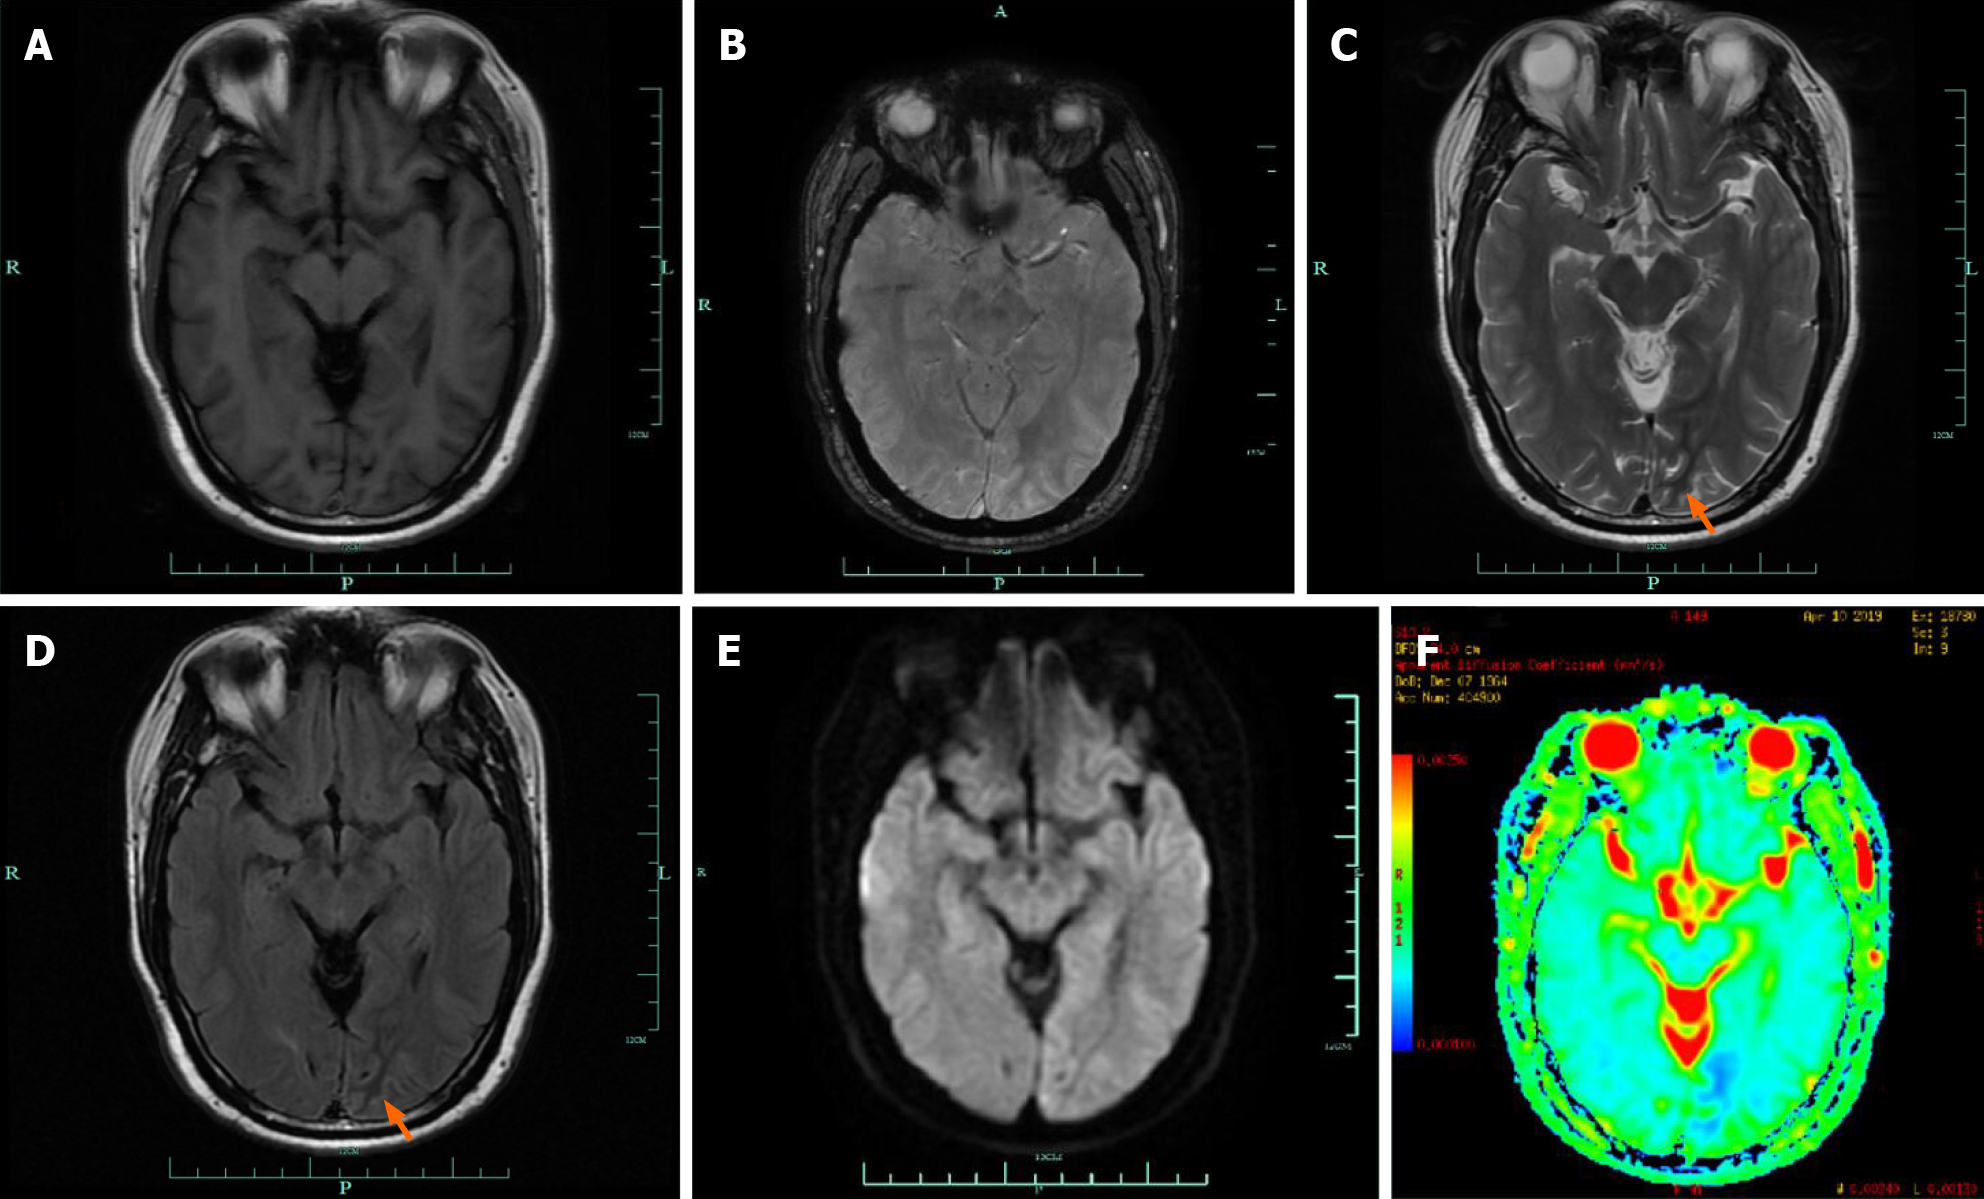
Figure 2 Magnetic resonance imaging showed low signal intensity in the apparent diffusion coefficient map.
A: Magnetic resonance imaging of the brain demonstrating isointensity on T1 sequence; B: Susceptibility weighted imaging; C: Left occipital subcortical T2; D: Fluid-attenuated inversion recovery hypointensity (orange arrow); E: Restricted diffusion; and F: Low signal intensity of the ADC map.
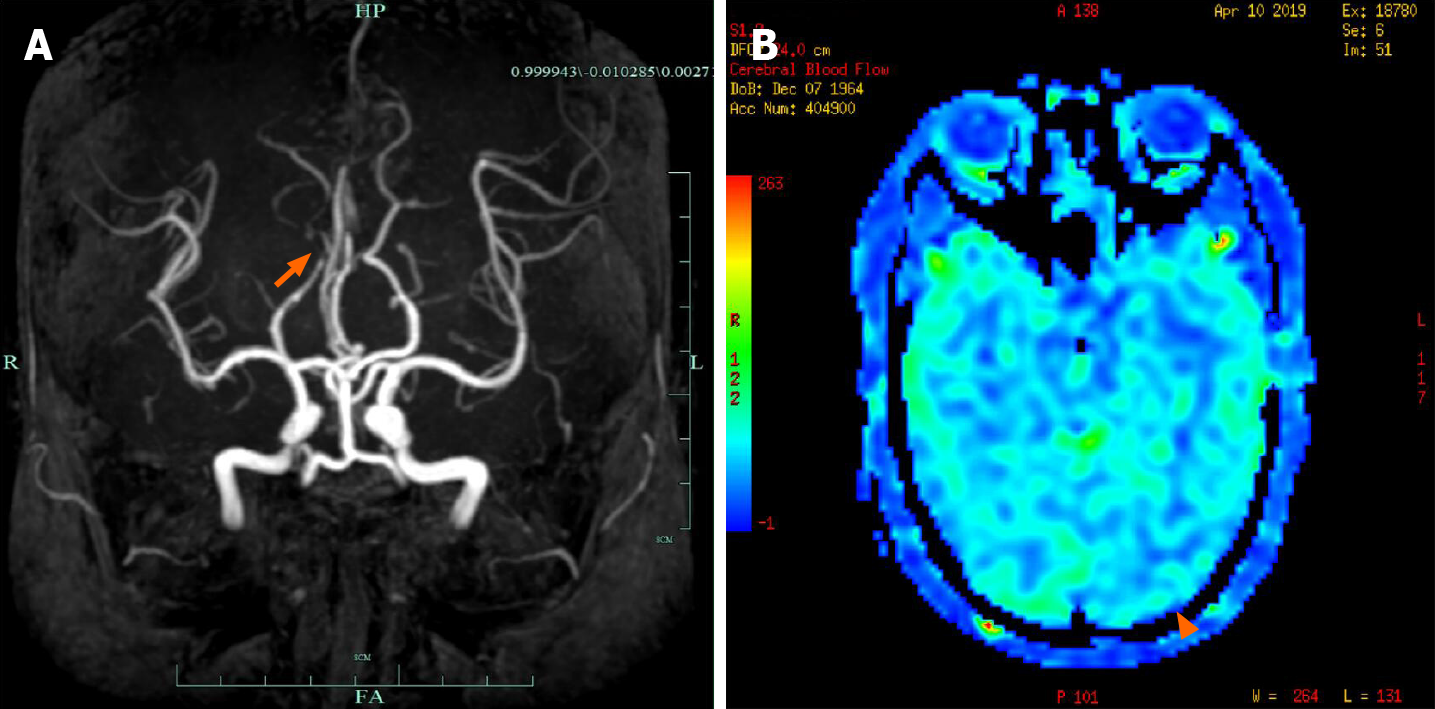
Figure 3 Magnetic resonance angiography imaging of the brain showed a mild stenosis.
A: Magnetic resonance angiography demonstrating mild stenosis of the right posterior cerebral artery (orange arrow); and B: Arterial spin labeling showing decreased perfusion of the lesion (arrowhead).
- Citation: Xiang XH, Fang JJ, Yang M, Zhao GH. Hyperglycemic hemianopia: A case report. World J Clin Cases 2021; 9(7): 1720-1727
- URL: https://www.wjgnet.com/2307-8960/full/v9/i7/1720.htm
- DOI: https://dx.doi.org/10.12998/wjcc.v9.i7.1720


