Copyright
©The Author(s) 2021.
World J Clin Cases. Sep 16, 2021; 9(26): 7811-7817
Published online Sep 16, 2021. doi: 10.12998/wjcc.v9.i26.7811
Published online Sep 16, 2021. doi: 10.12998/wjcc.v9.i26.7811
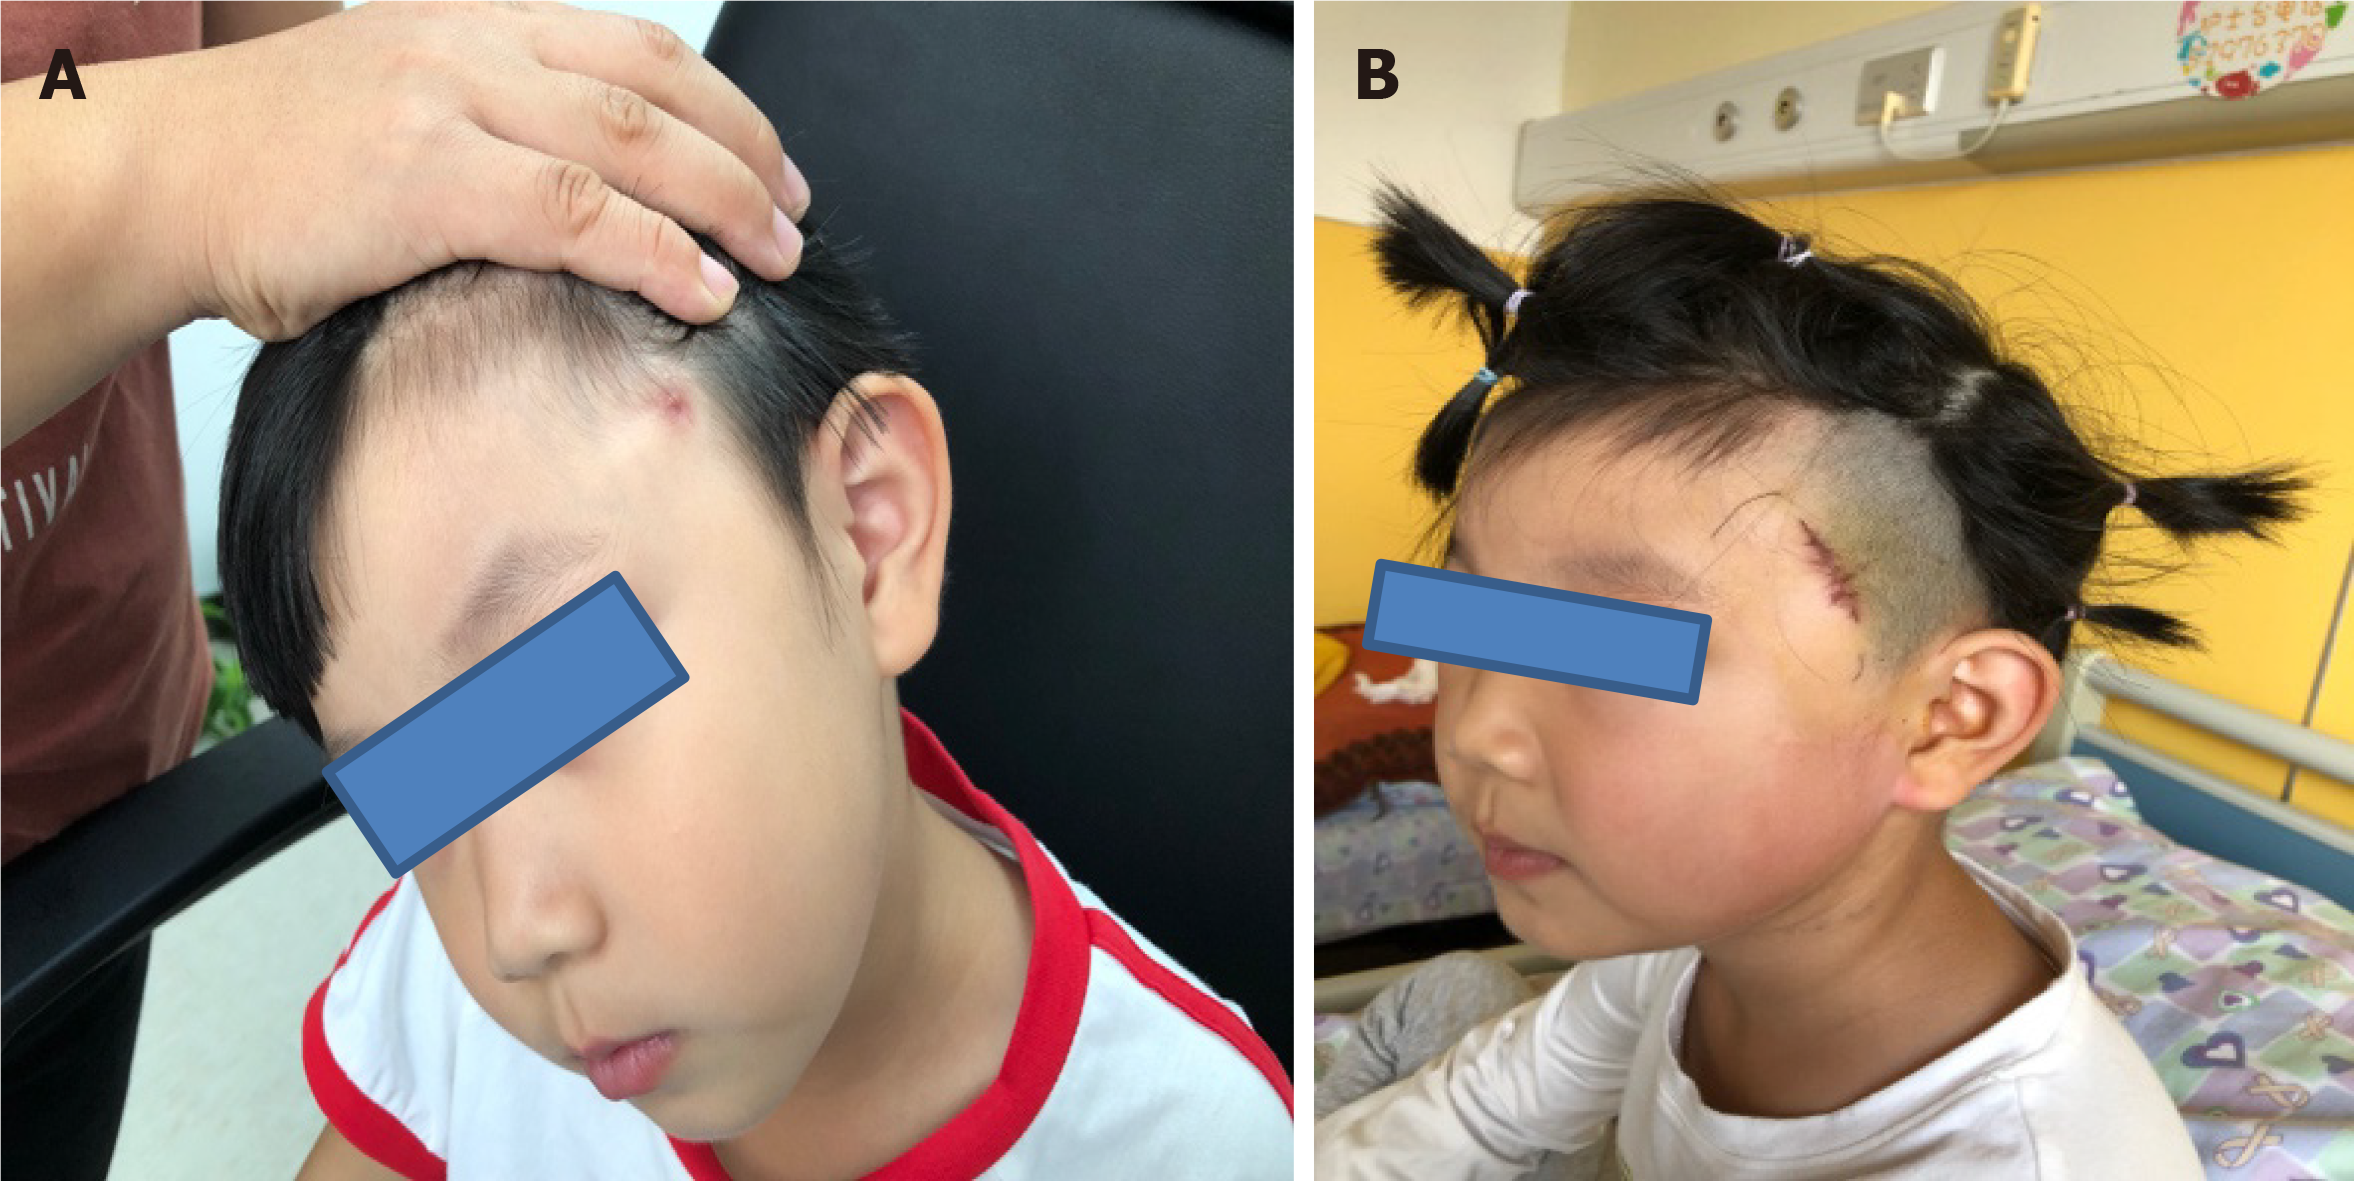
Figure 1 Physical examination.
A: Preoperative left temporal fistula; B: Postoperative wound.
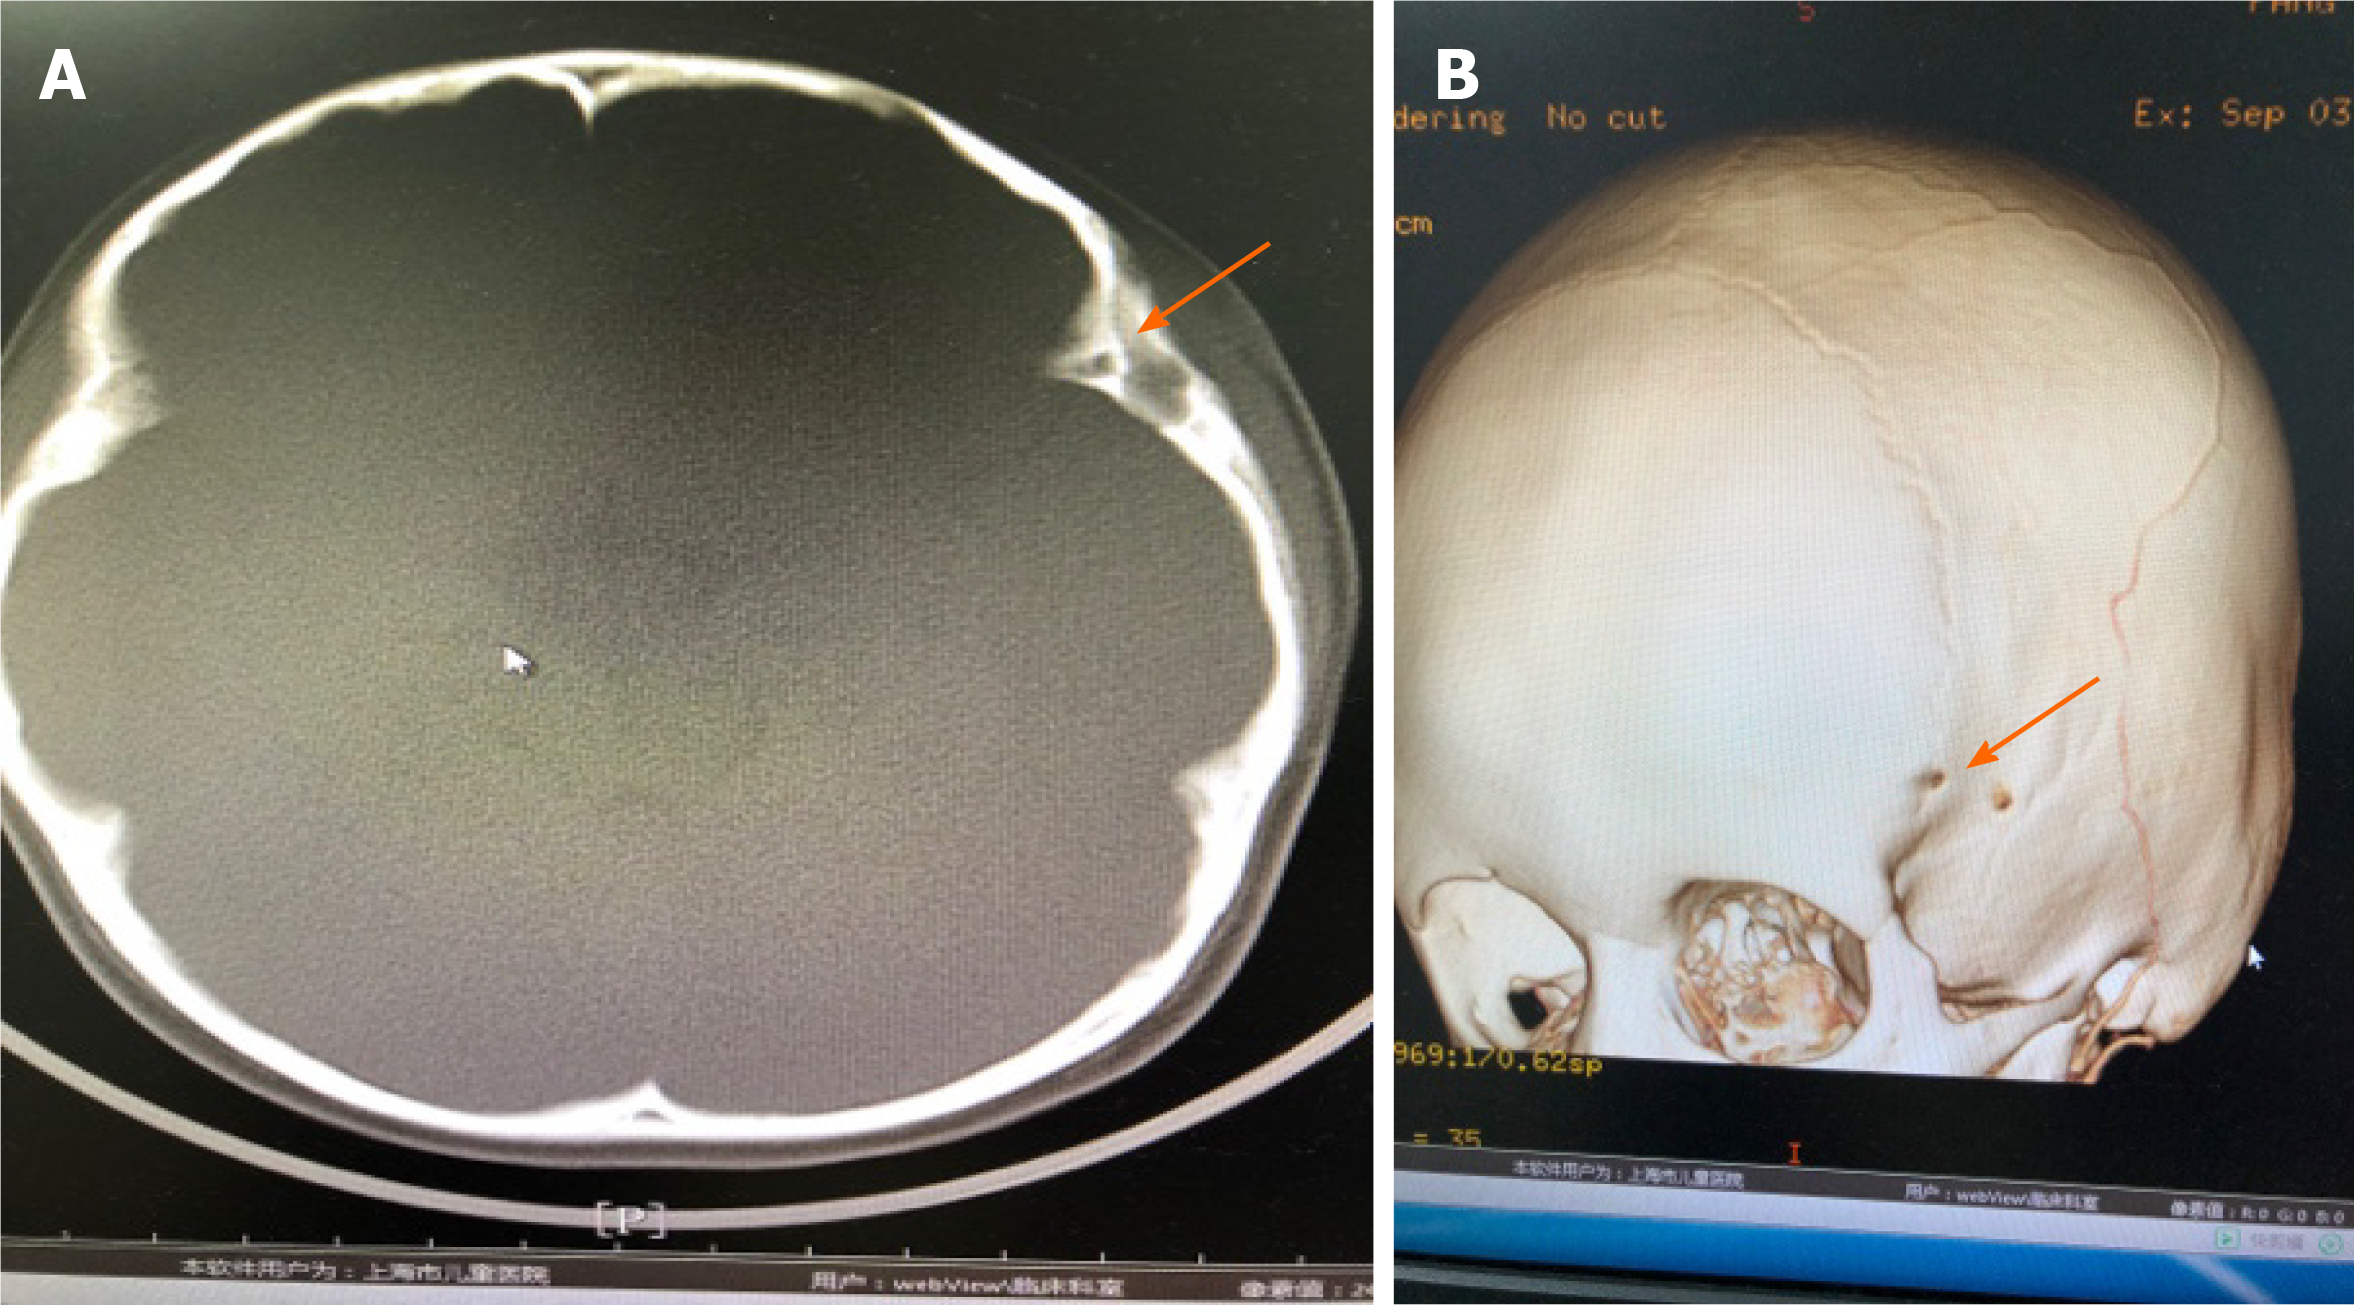
Figure 2 Computed tomography and three-dimensional imaging of the left frontotemporal.
A: Computed tomography (CT) images. At the left frontotemporal junction, an irregular low-density mass with a size of about 15.28 mm × 5.64 mm × 14.16 mm was observed subcutaneously, and the density was uneven. The CT value was about 32 HU. After enhancement, the edge of the lesion was enhanced, and the CT value was about 61 HU in the arterial phase and 86 HU in the venous phase. The local tubular foci extended to the deep left frontal temporal bone, which seemed to penetrate the inner plate of the skull. Osteosclerosis was visible in the marginal bone. The boundary between the lesion and adjacent muscles was not clear, and local skin become thick with abnormal enhancement changes; B: Three-dimensional imaging. Orange arrows indicate the fistula.
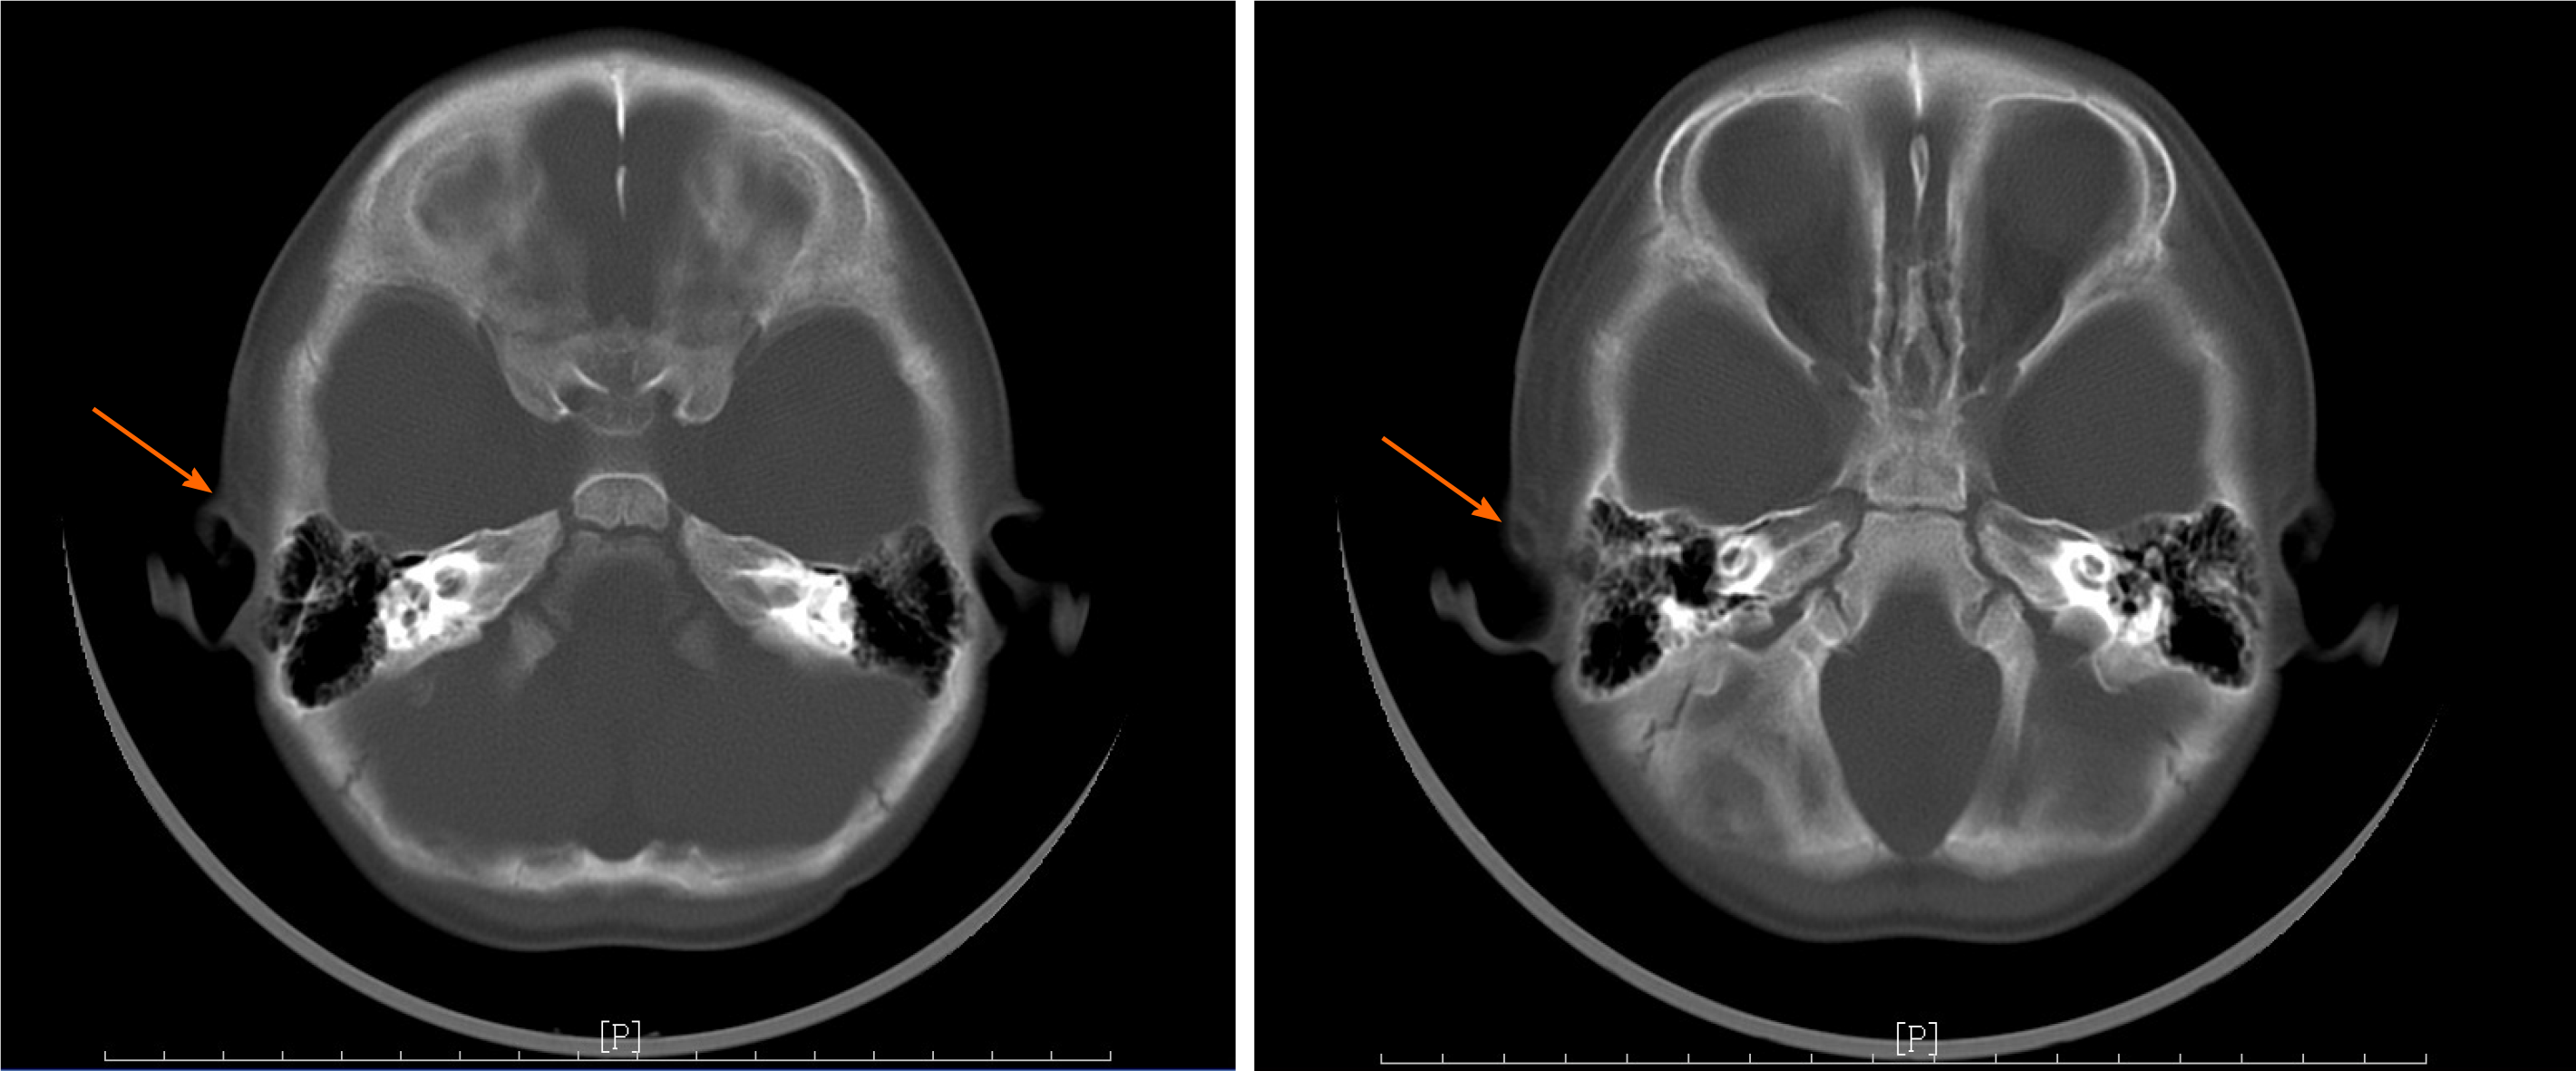
Figure 3 Computed tomography images.
A low-density nodular shadow with a size of 2.2 mm × 7.6 mm × 9.1 mm was observed subcutaneously in the right temporal region. CT value was about 1-17 HU, which was uneven after enhancement. It was about 44-46 HU in the arterial phase and 37-70 HU in the venous phase. Orange arrows indicate the fistula.
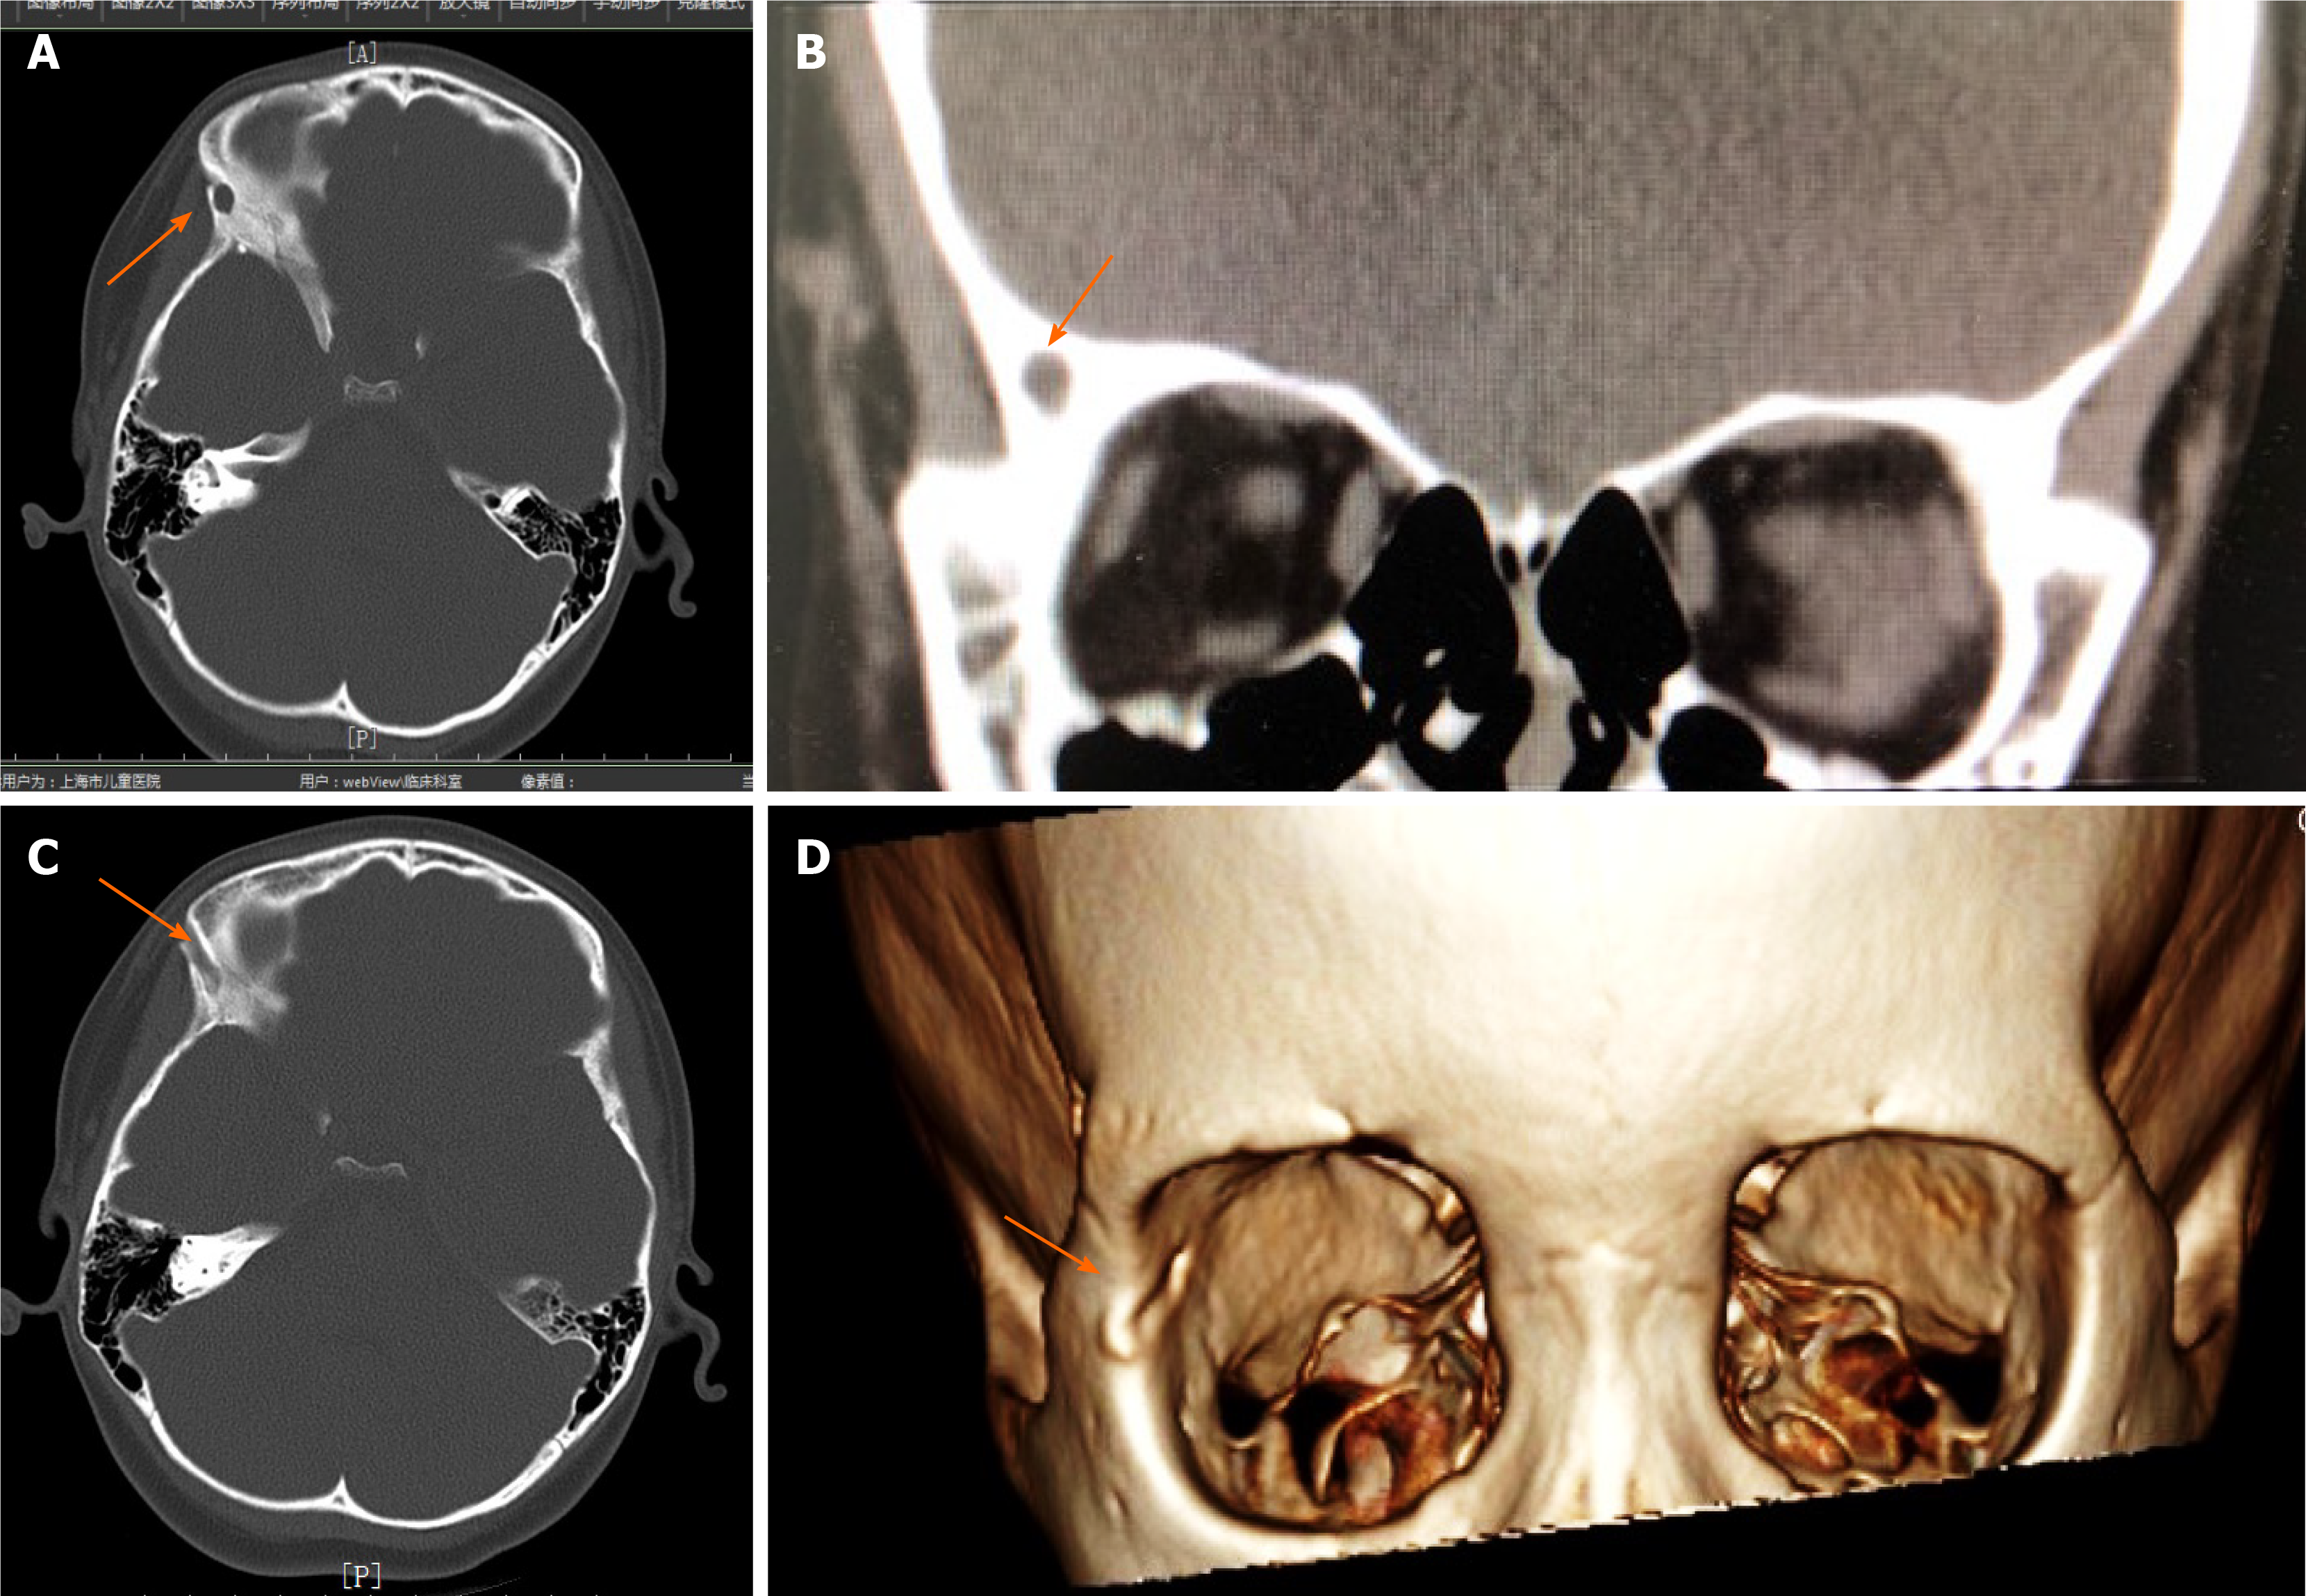
Figure 4 Computed tomography and three-dimensional imaging of the frontotemporal region.
Local subcutaneous soft tissue swelling in the right temporal region was noted. Computed tomography value was about 31 HU. The shape, size, and position of the ventricle system were normal, and no obvious bone destruction or other abnormal changes were observed in the remaining skull. A-C: Computed tomography images; D: Three-dimensional imaging. Orange arrows indicate the fistula.
- Citation: Gu MZ, Xu HM, Chen F, Xia WW, Li XY. Pediatric temporal fistula: Report of three cases. World J Clin Cases 2021; 9(26): 7811-7817
- URL: https://www.wjgnet.com/2307-8960/full/v9/i26/7811.htm
- DOI: https://dx.doi.org/10.12998/wjcc.v9.i26.7811


