Copyright
©The Author(s) 2021.
World J Clin Cases. Jul 26, 2021; 9(21): 6155-6169
Published online Jul 26, 2021. doi: 10.12998/wjcc.v9.i21.6155
Published online Jul 26, 2021. doi: 10.12998/wjcc.v9.i21.6155
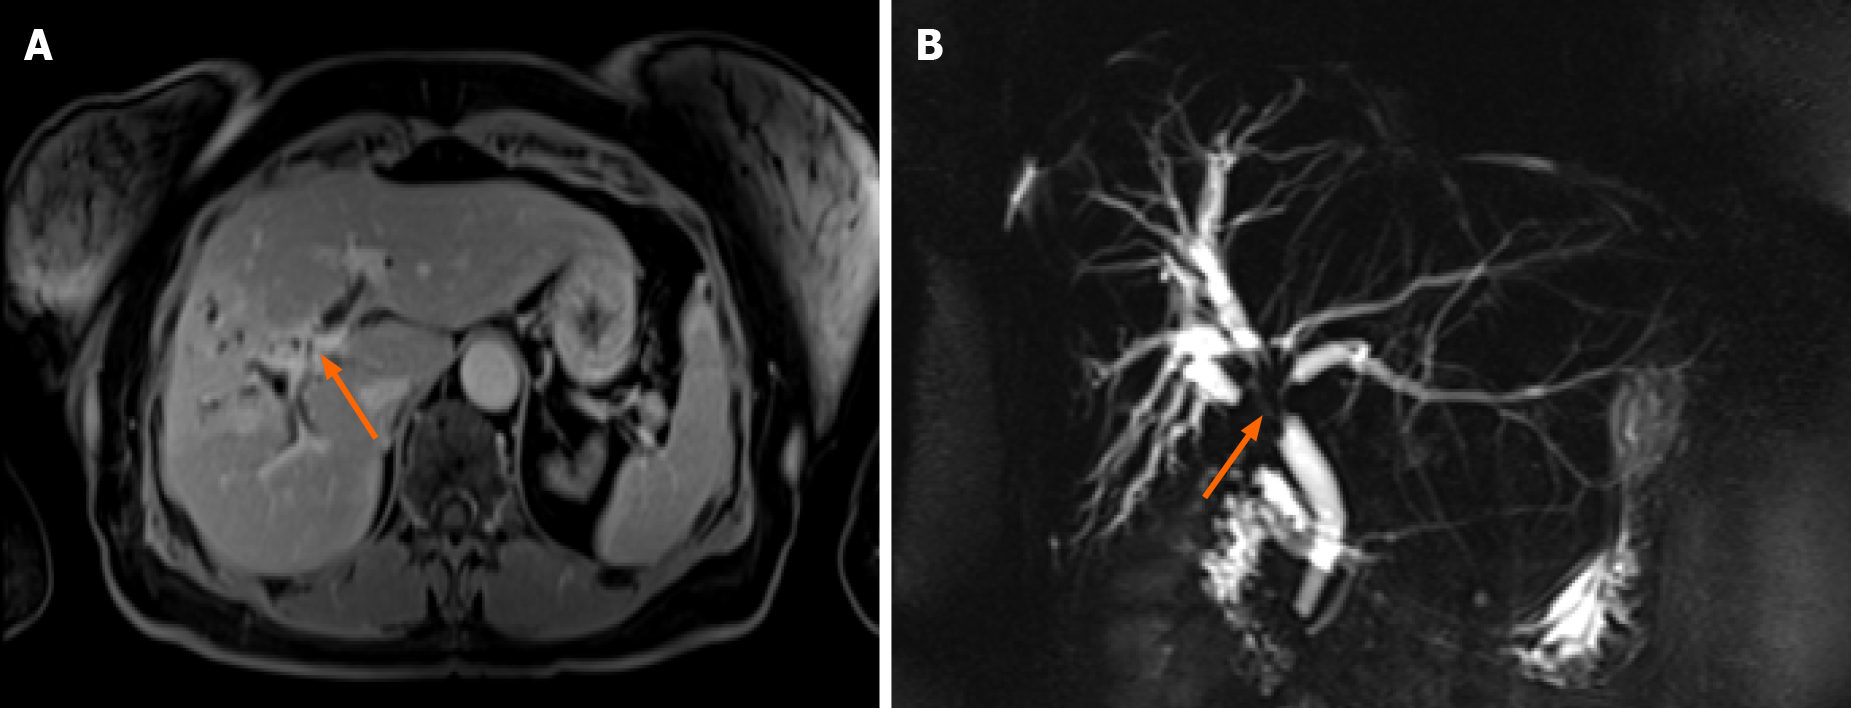
Figure 1 Magnetic resonance cholangiopancreatography images at presentation.
A: T1 FS late phase contrast-enhanced image showing soft tissue mass with gradual enhancement in the late phase around the wall of the common hepatic duct; B: Three-dimensional magnetic resonance cholangiopancreatography images showing a mass extending to segmental intrahepatic ducts on both lobes with dilatation of peripheral ducts.
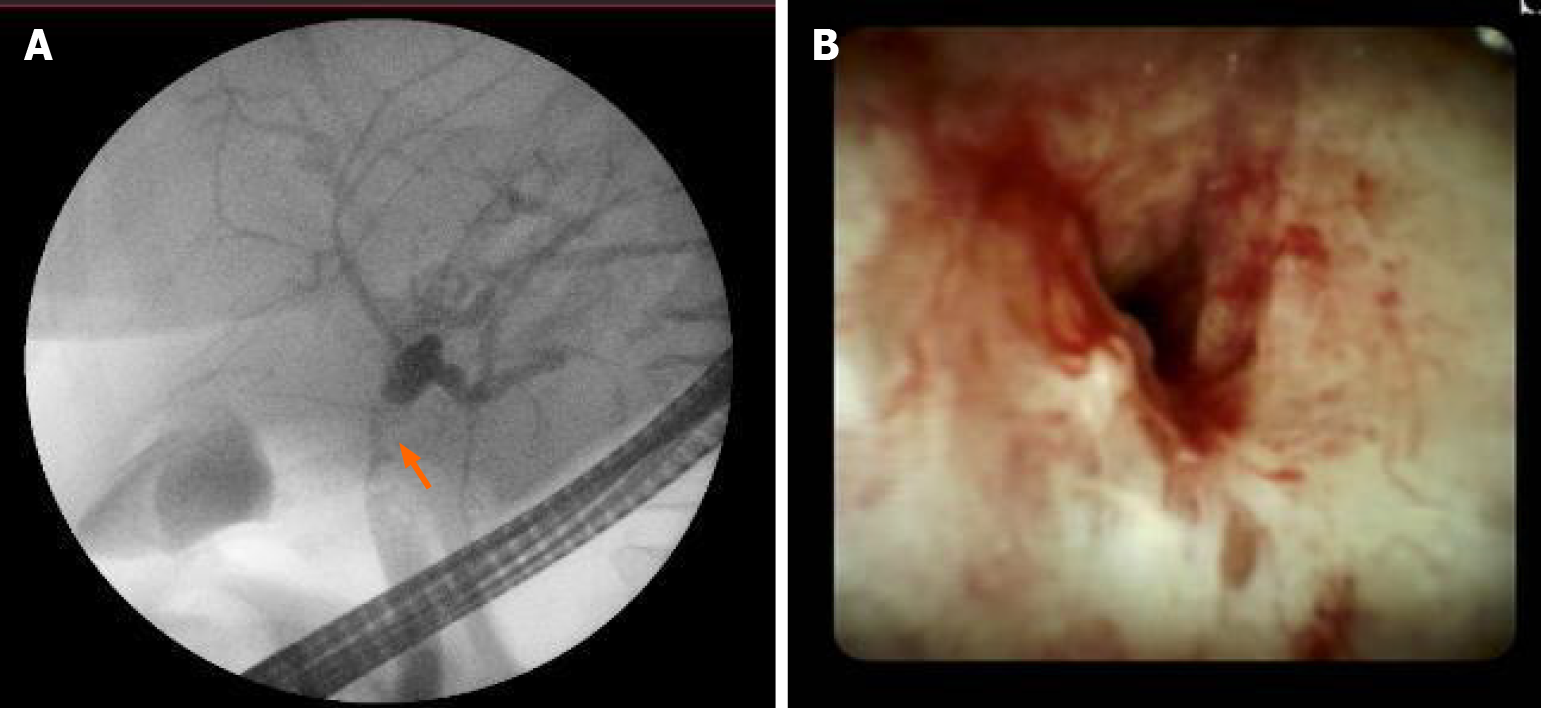
Figure 2 Endoscopic retrograde cholangiopancreatography and direct cholangioscopy images.
A: Endoscopic retrograde cholangiopancrea
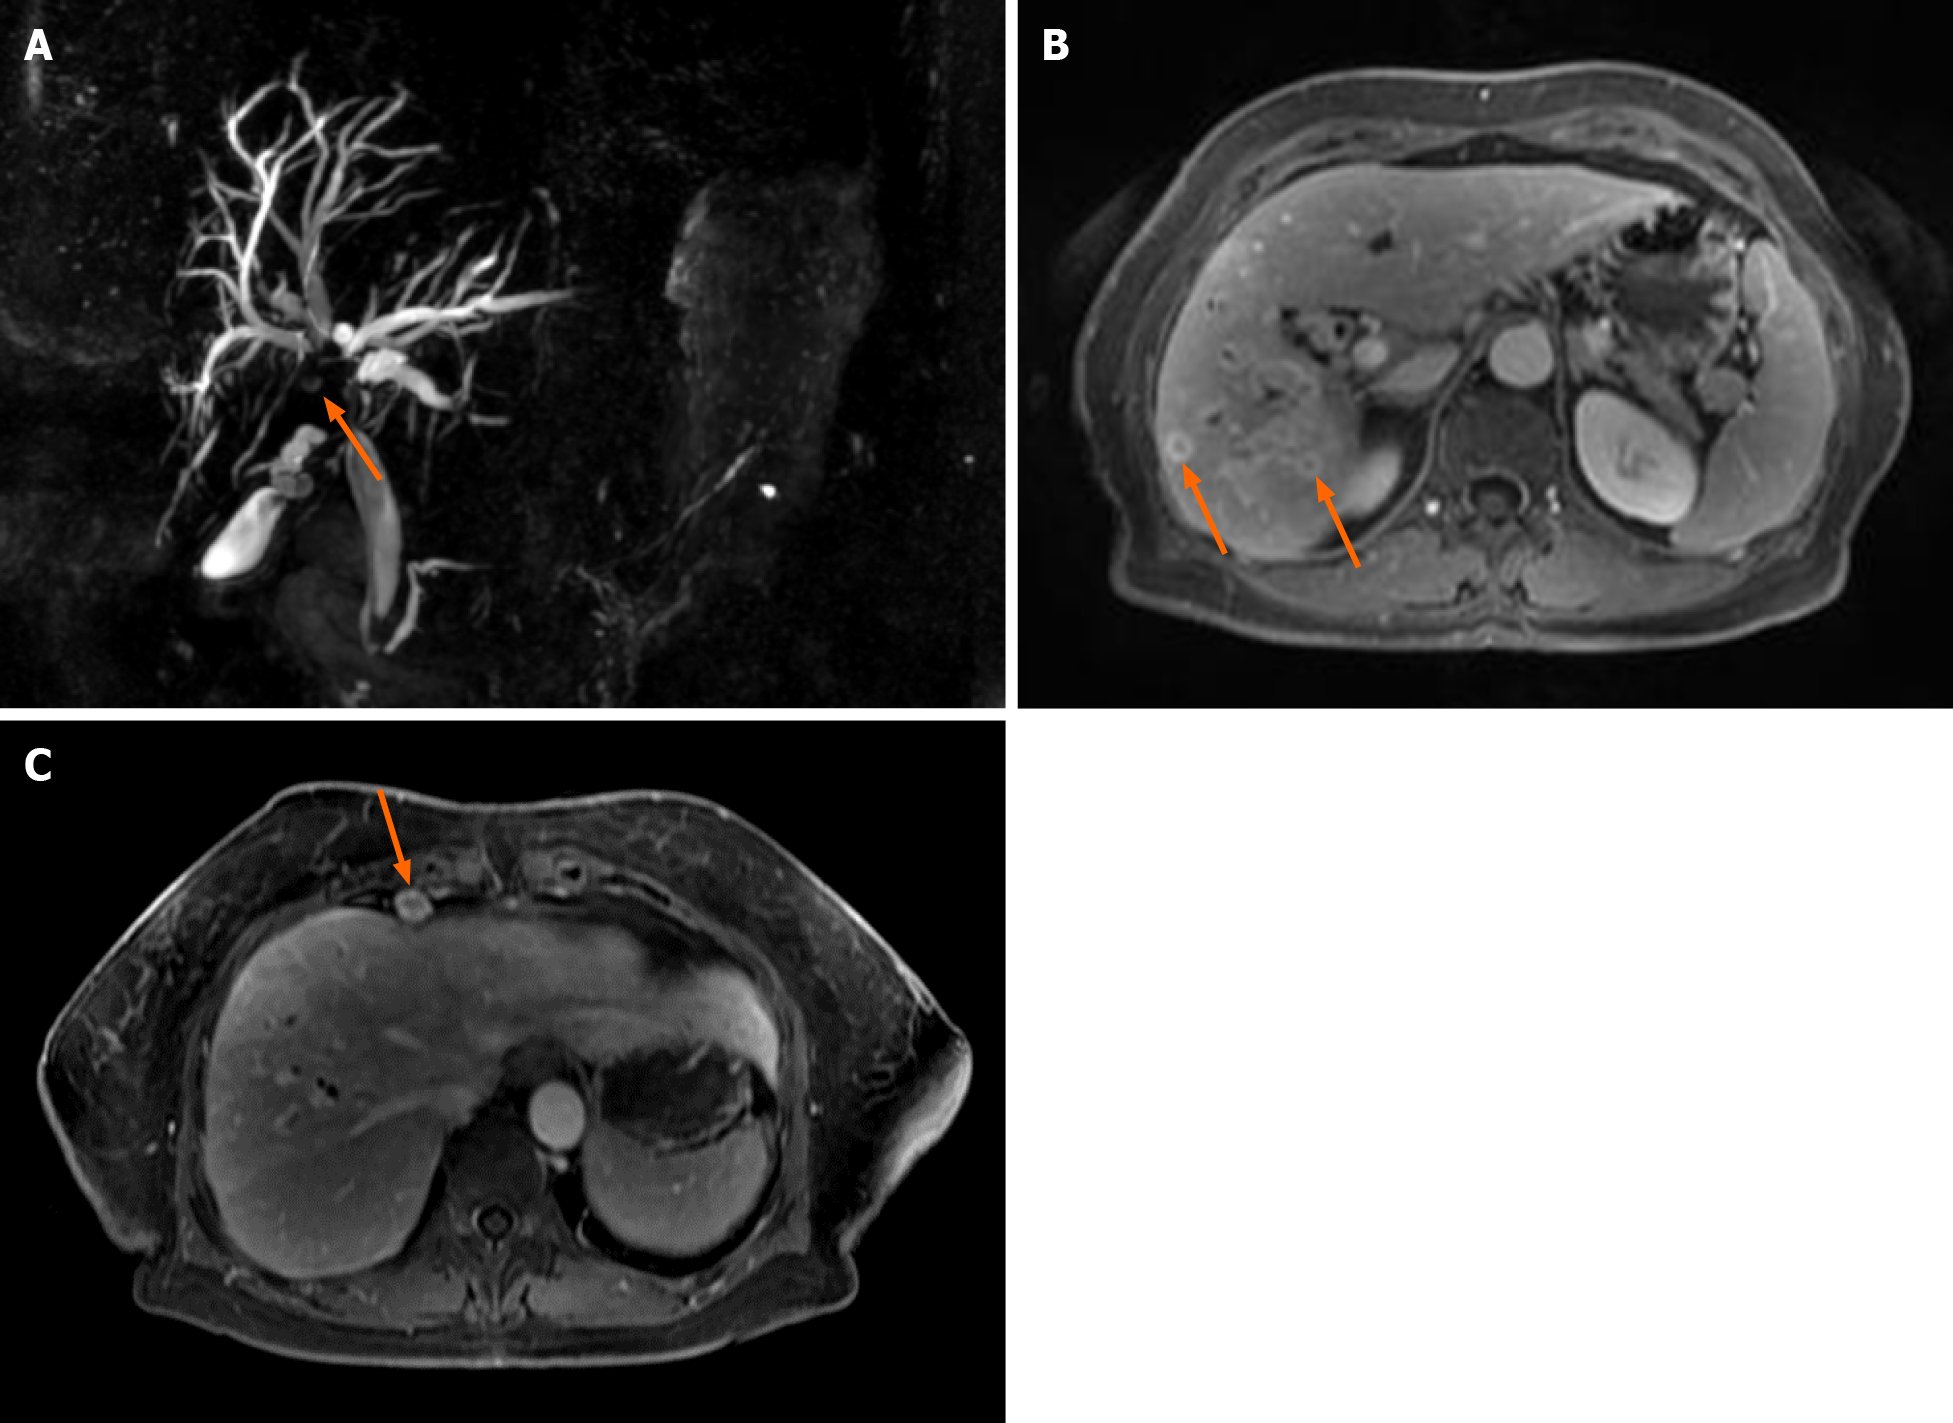
Figure 3 Magnetic resonance cholangiopancreatography images 3 mo later.
A: Three-dimensional magnetic resonance cholangiopancreatography (MRCP) images showing a common hepatic duct stricture (arrow) extending to intrahepatic segmental ducts extent to similar extent as on the previous MRCP with peripheral duct dilatation; B: FS contrast-enhanced images showing a cluster of rim enhancing lesions most likely small abscesses due to cholangitis (arrows); C: Enlarged cardiophrenic lymph nodes (arrow).
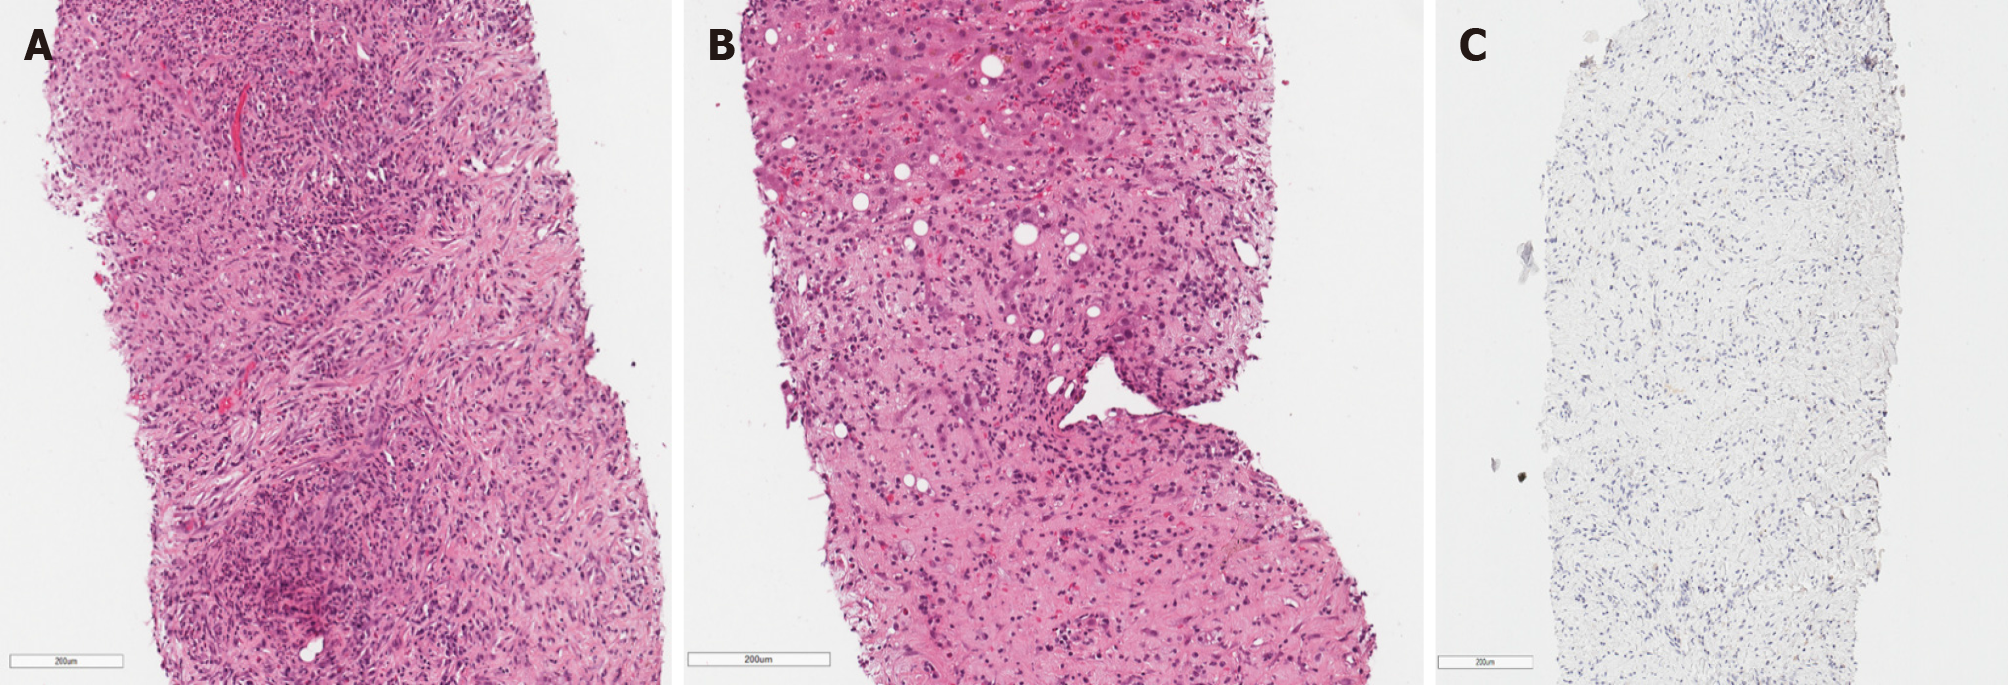
Figure 4 Histological images.
A, B: The tumor is formed of disordered myofibroblasts and fibroblasts. Focal abundant polymorphonuclear infiltration can be seen (top and bottom left) (HE x 200); C: Negative ALK-1 immunohistochemical reaction.
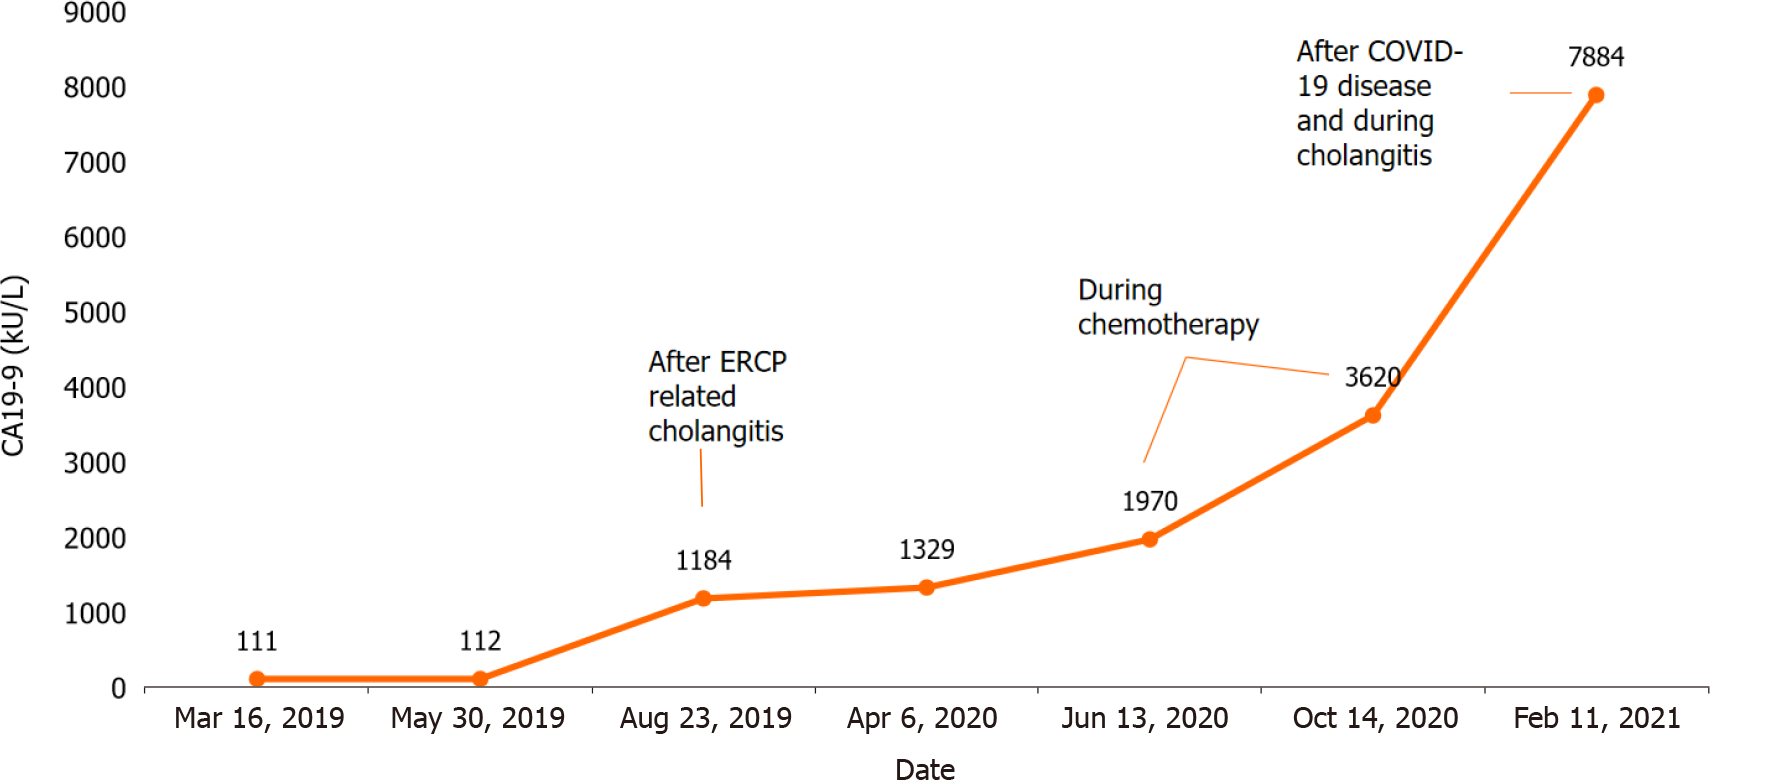
Figure 5 Carbohydrate antigen 19-9 dynamics during the treatment.
CA 19-9: Carbohydrate antigen 19-9; ERCP: Endoscopic retrograde cholangio
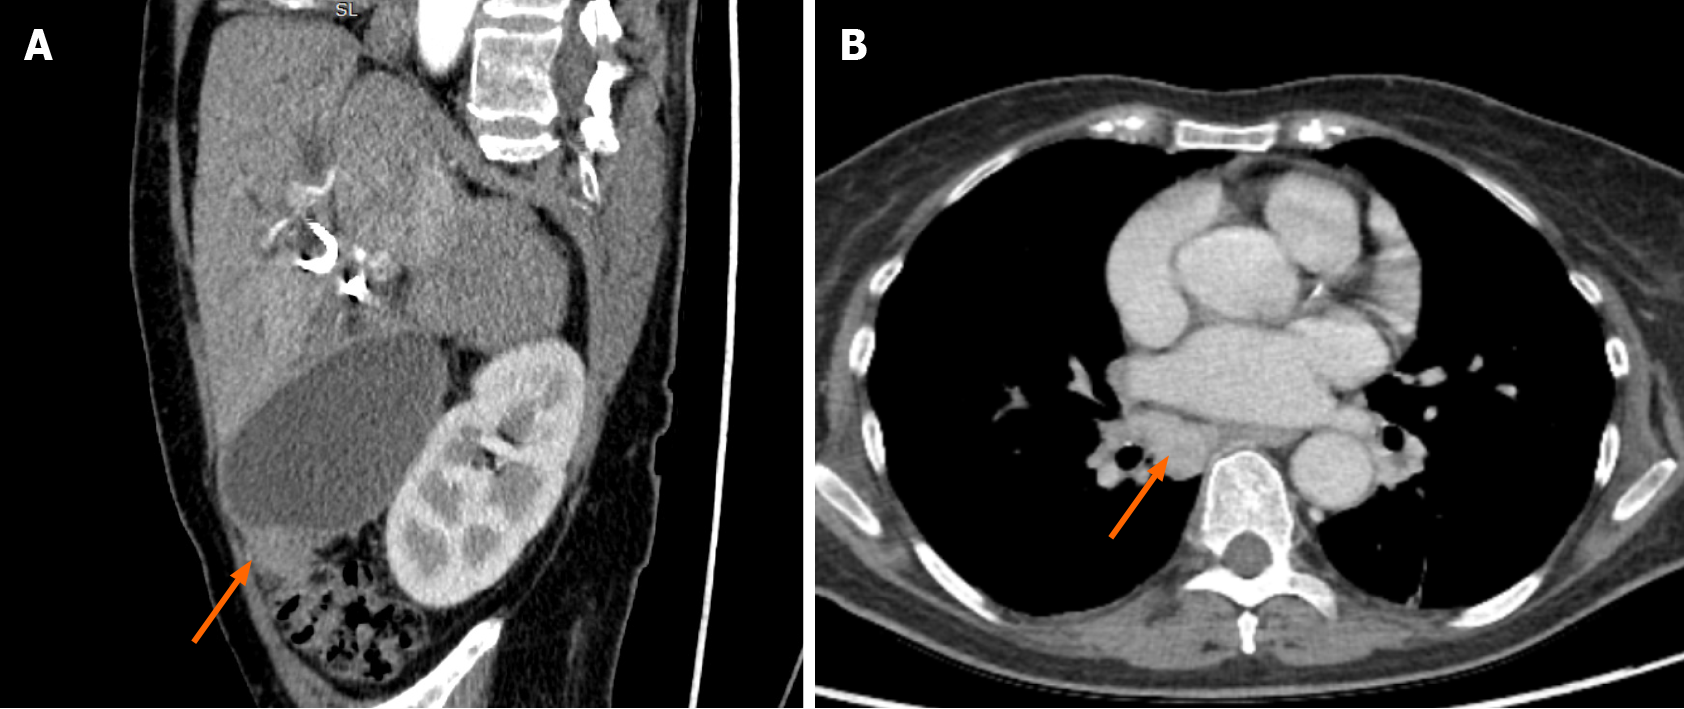
Figure 6 Computed tomography images 22 mo after the initial diagnosis.
A: Reformatted two-dimensional computed tomography (CT) images in the portal venous phase showing a contrast-enhancing soft tissue mass (arrow) arising from the gall bladder fundus and extending into colon mesenterium; B: Axial CT portal venous phase images showing a large lymph node (arrow) in the right lung hilum.
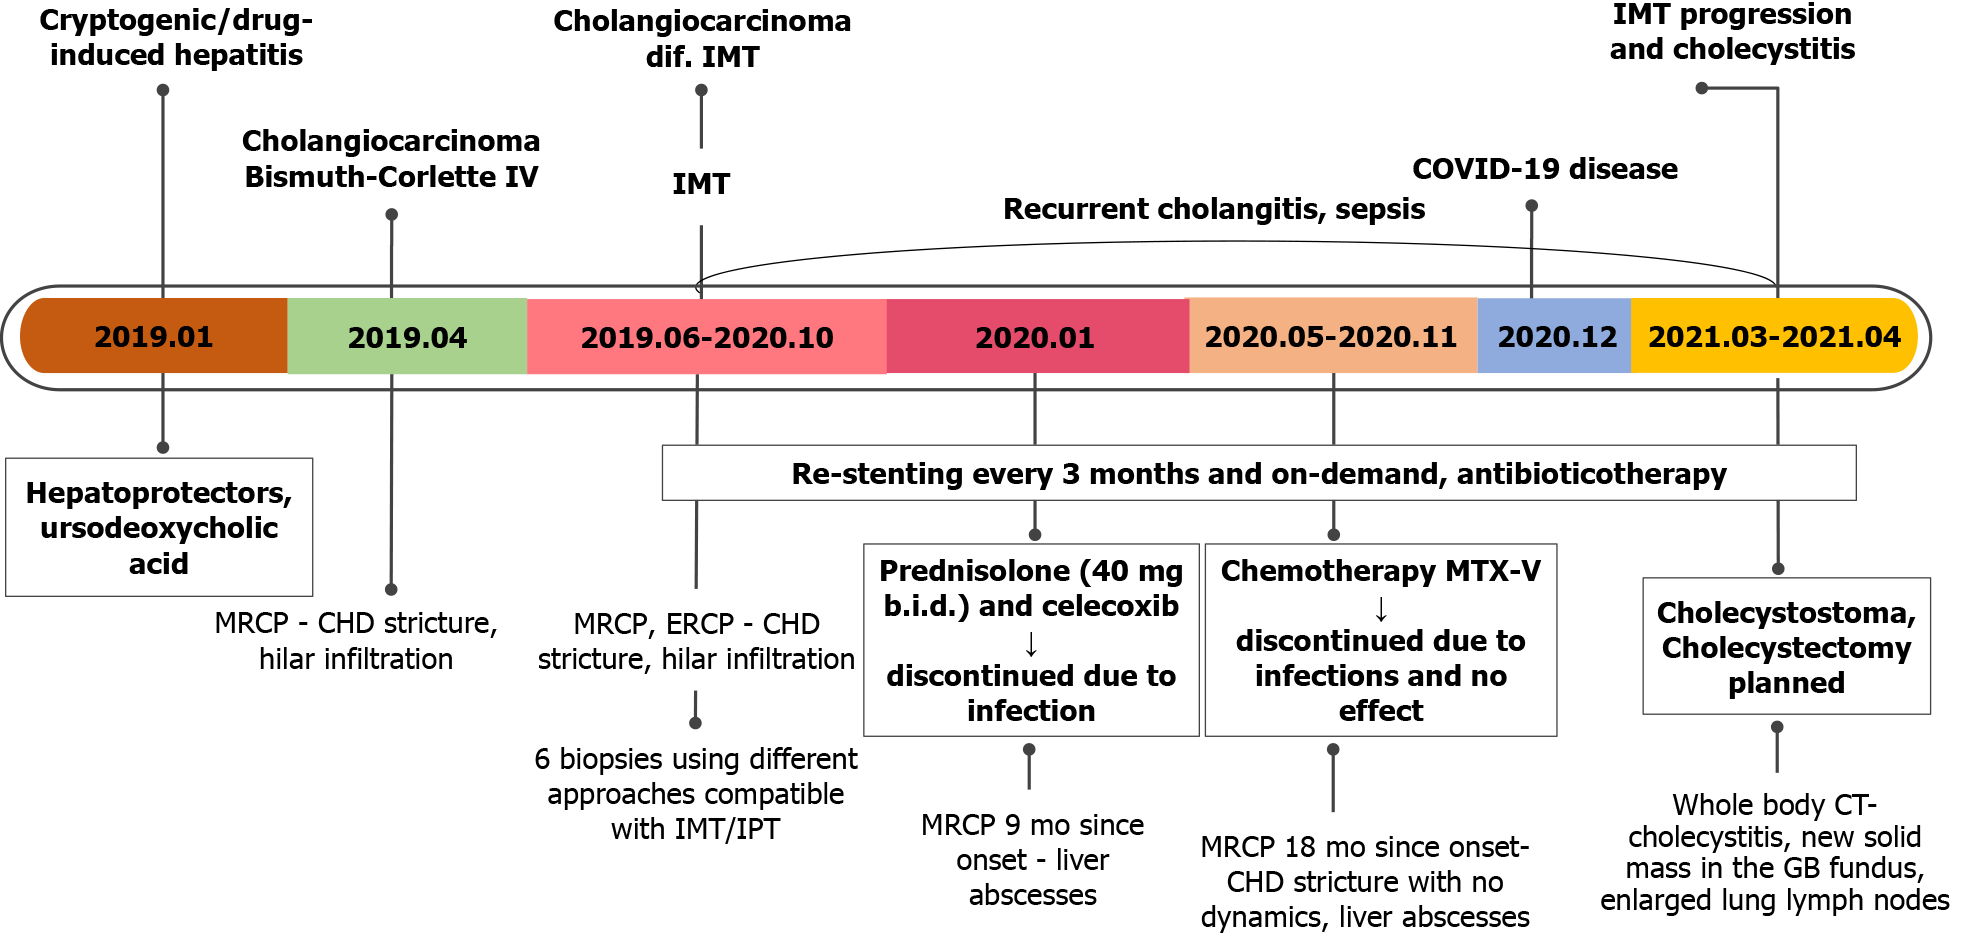
Figure 7 Case history timeline.
MRCP: Magnetic resonance cholangiopancreatography; CHD: Common hepatic duct; IMT: Inflammatory myofibroblastic tumor; ERCP: Endoscopic retrograde cholangiopancreatography; IPT: Inflammatory pseudotumor; MTX-V: Methotrexate-vinorelbine; CT: Computed tomography; GB: Gallbladder.
- Citation: Strainiene S, Sedleckaite K, Jarasunas J, Savlan I, Stanaitis J, Stundiene I, Strainys T, Liakina V, Valantinas J. Complicated course of biliary inflammatory myofibroblastic tumor mimicking hilar cholangiocarcinoma: A case report and literature review. World J Clin Cases 2021; 9(21): 6155-6169
- URL: https://www.wjgnet.com/2307-8960/full/v9/i21/6155.htm
- DOI: https://dx.doi.org/10.12998/wjcc.v9.i21.6155


