Copyright
©The Author(s) 2021.
World J Clin Cases. Jul 26, 2021; 9(21): 5812-5821
Published online Jul 26, 2021. doi: 10.12998/wjcc.v9.i21.5812
Published online Jul 26, 2021. doi: 10.12998/wjcc.v9.i21.5812
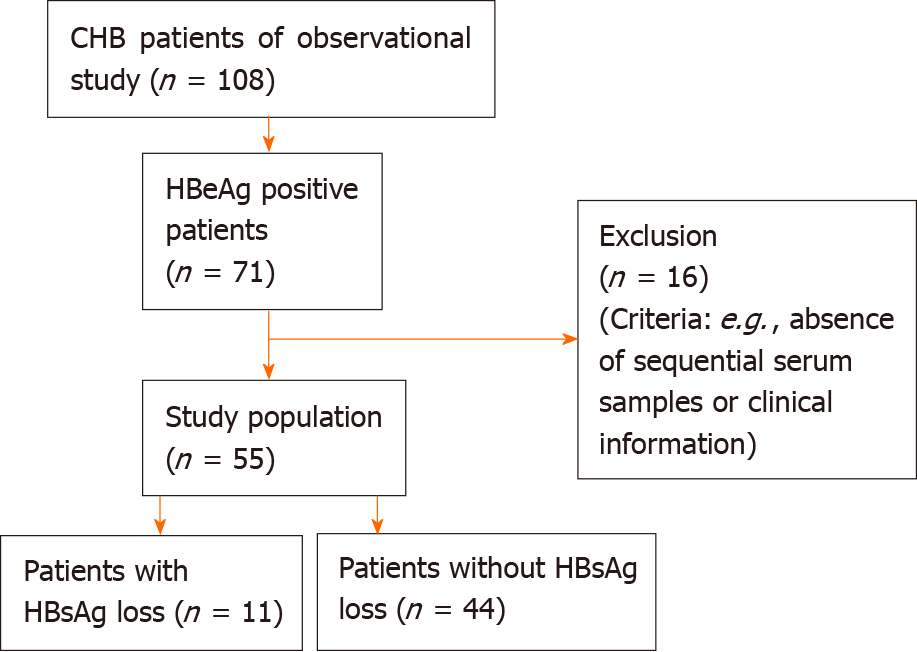
Figure 1 Overview of the inclusion process of the study population.
CHB: Chronic hepatitis B; HBeAg: Hepatitis B e antigen; HBsAg: Hepatitis B surface antigen.
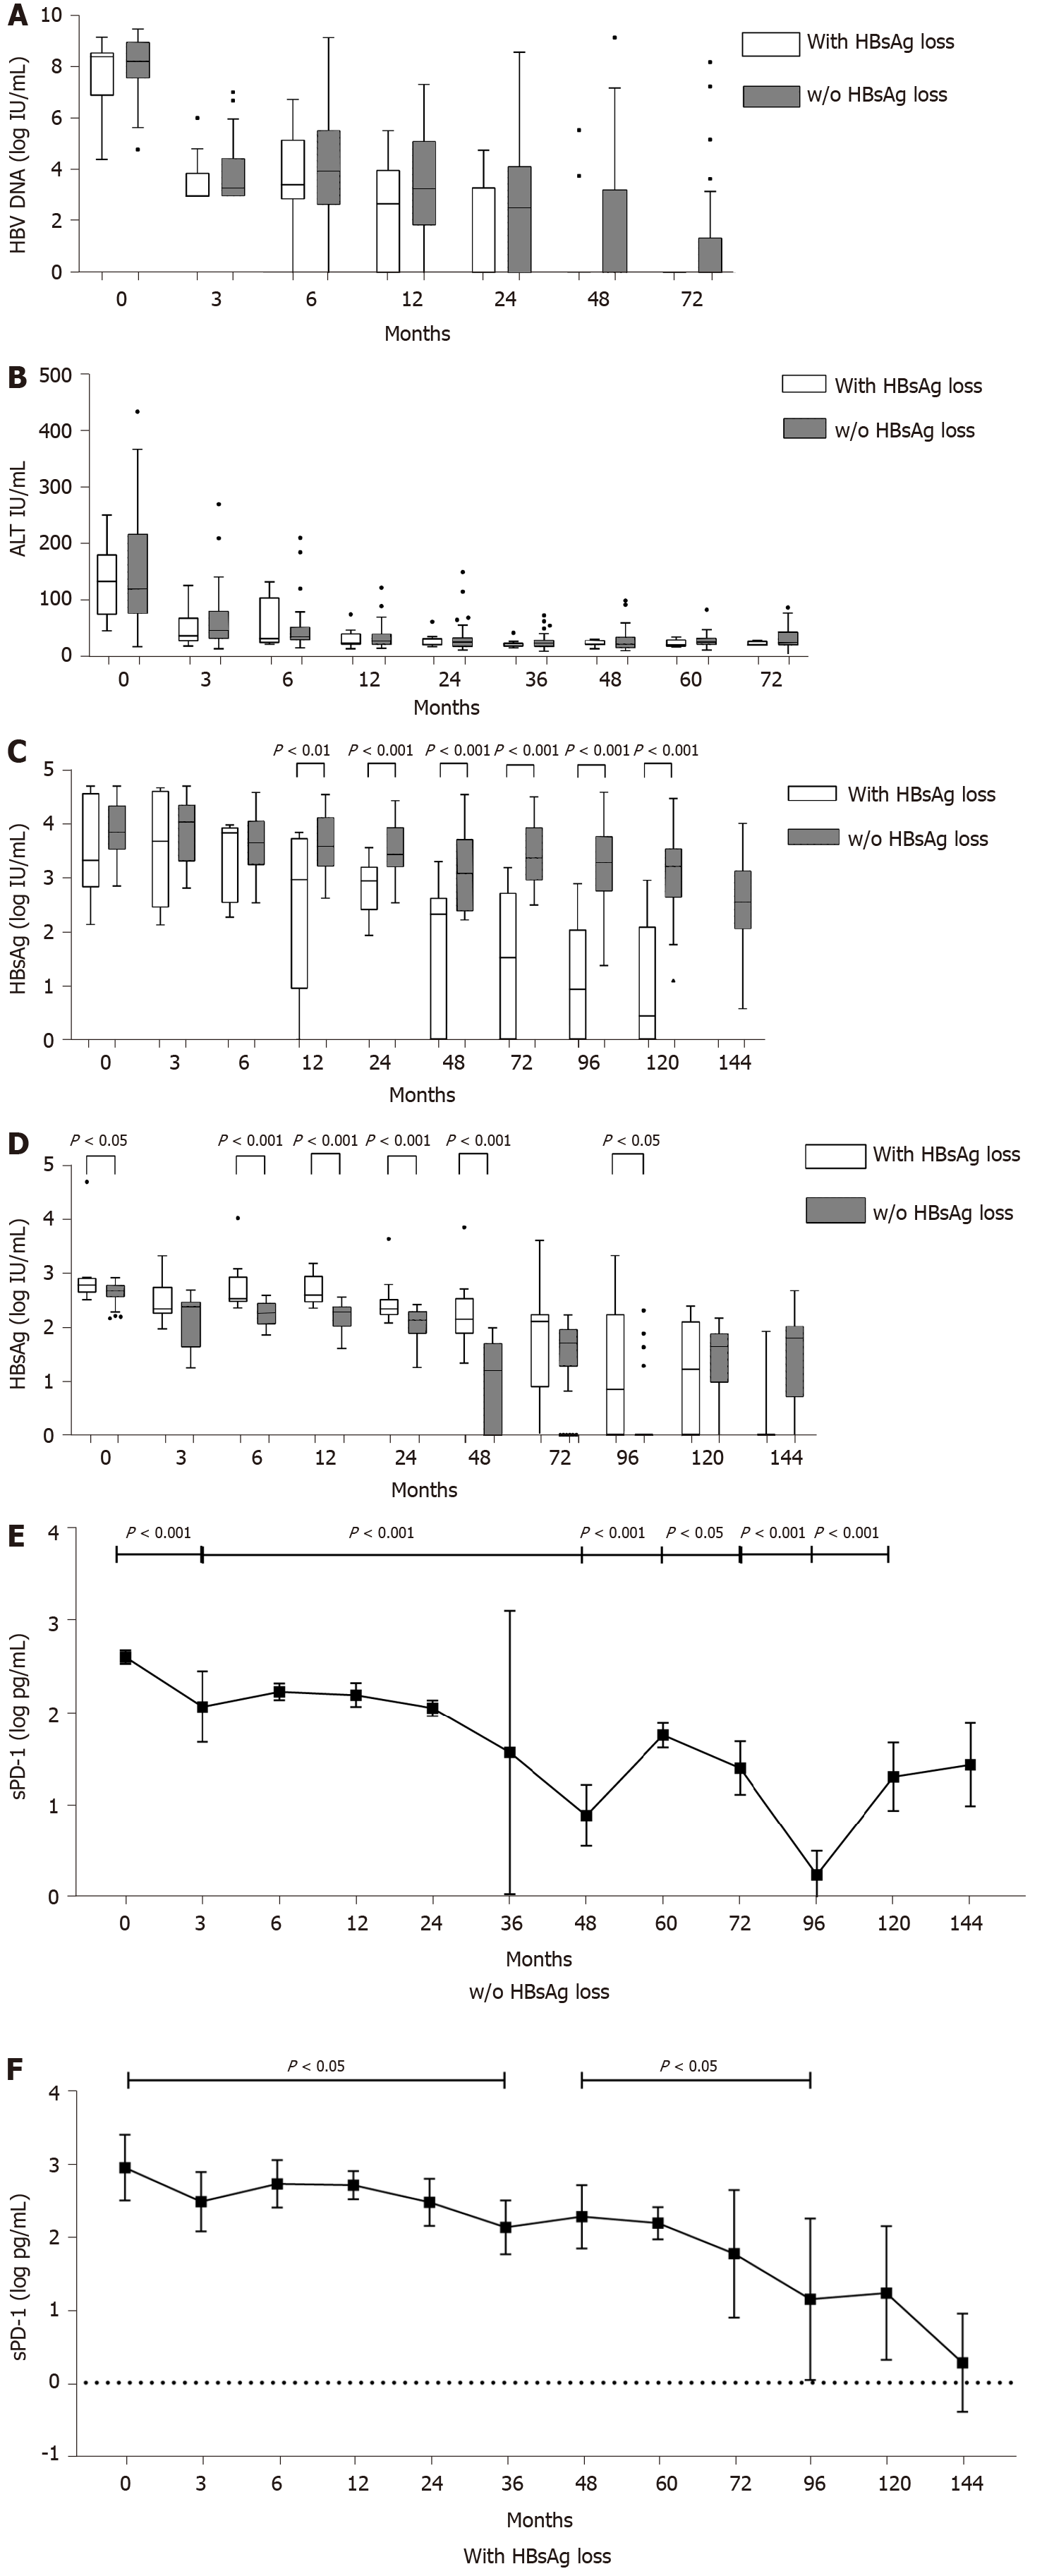
Figure 2 Dynamics during nucleos(t)ide analogue treatment.
A: Hepatitis B virus (HBV) DNA; B: Alanine transaminase (ALT); C: Hepatitis B surface antigen (HBsAg); D: Soluble programmed death-1 (sPD-1) levels; soluble programmed death-1; E, F: Levels in patients without (E)/with (F) HBsAg loss at different time points.
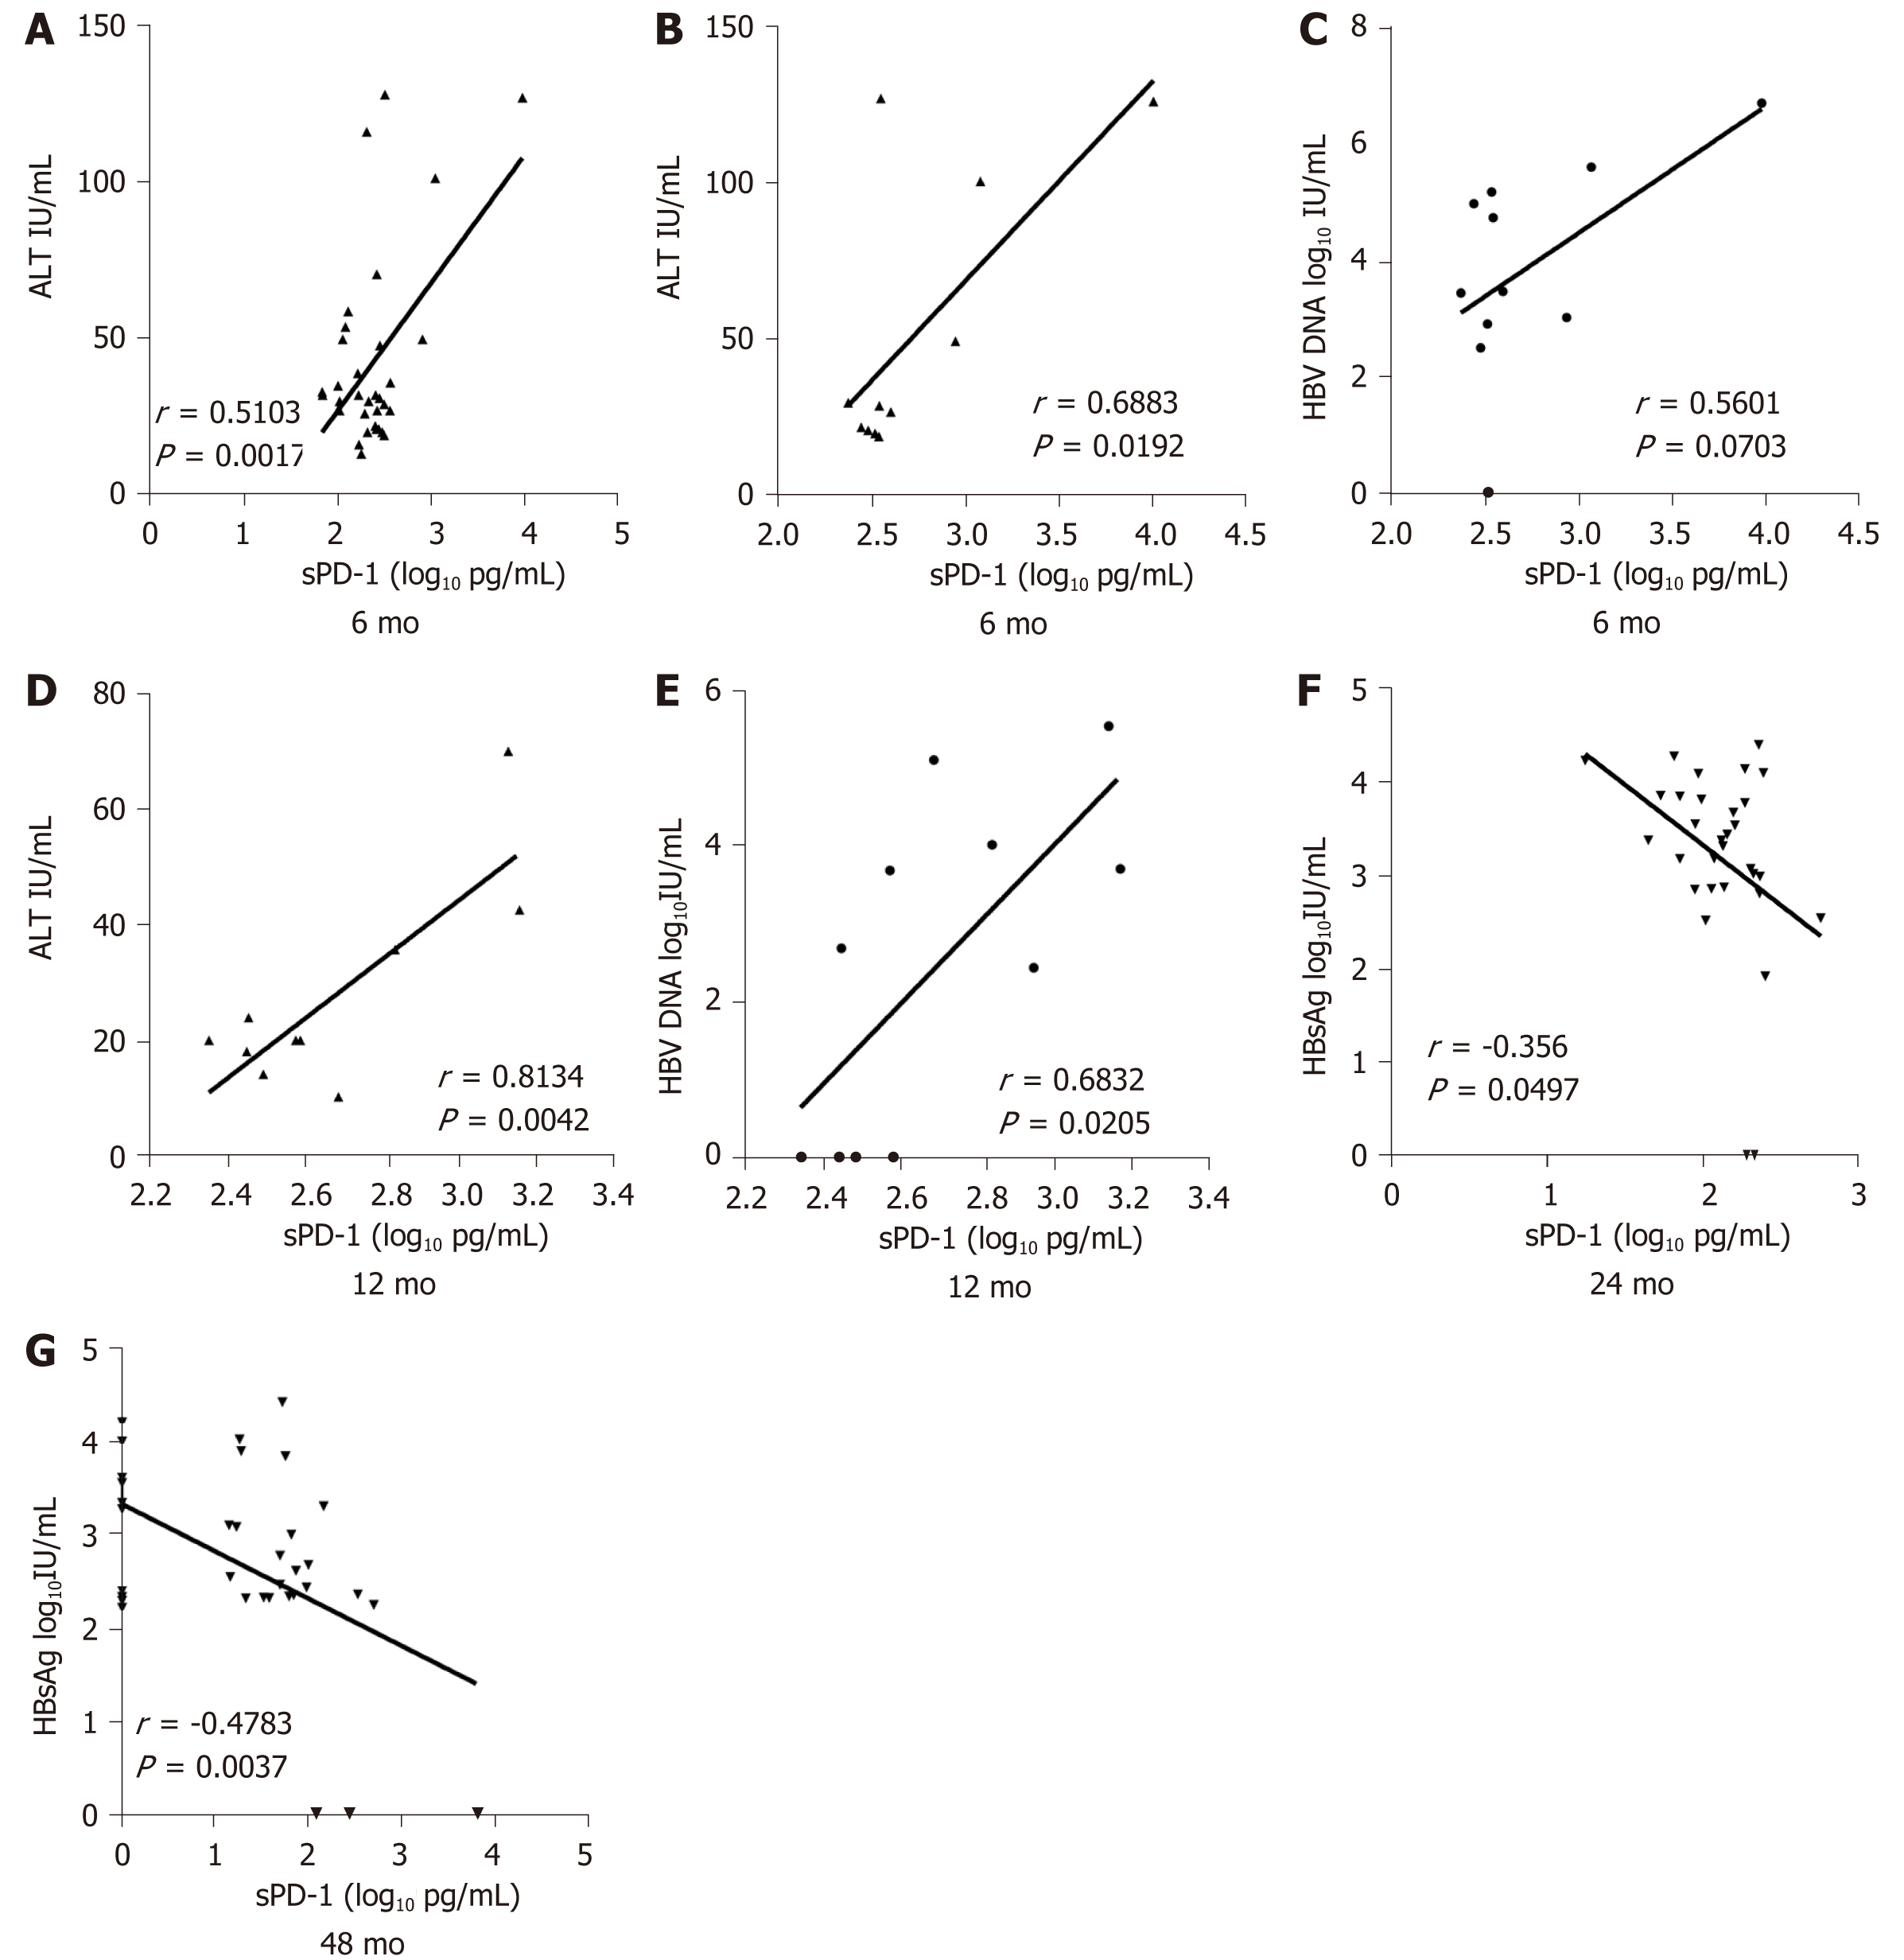
Figure 3 Soluble programmed death-1 levels.
A: Levels were positively correlated with alanine transaminase (ALT) levels in all patients after 6 mo; B, C: Levels were positively correlated with ALT (B) and hepatitis B virus (HBV) DNA levels (C) in patients with hepatitis B surface antigen (HBsAg) loss after 6 mo; D, E: Levels were positively correlated with ALT (D) and HBV DNA levels (E) in patients with HBsAg loss after 12 mo; F, G: Levels were negatively correlated with HBsAg levels in all patients after 24 mo (F) and 48 mo (G). sPD-1: Soluble programmed death-1.
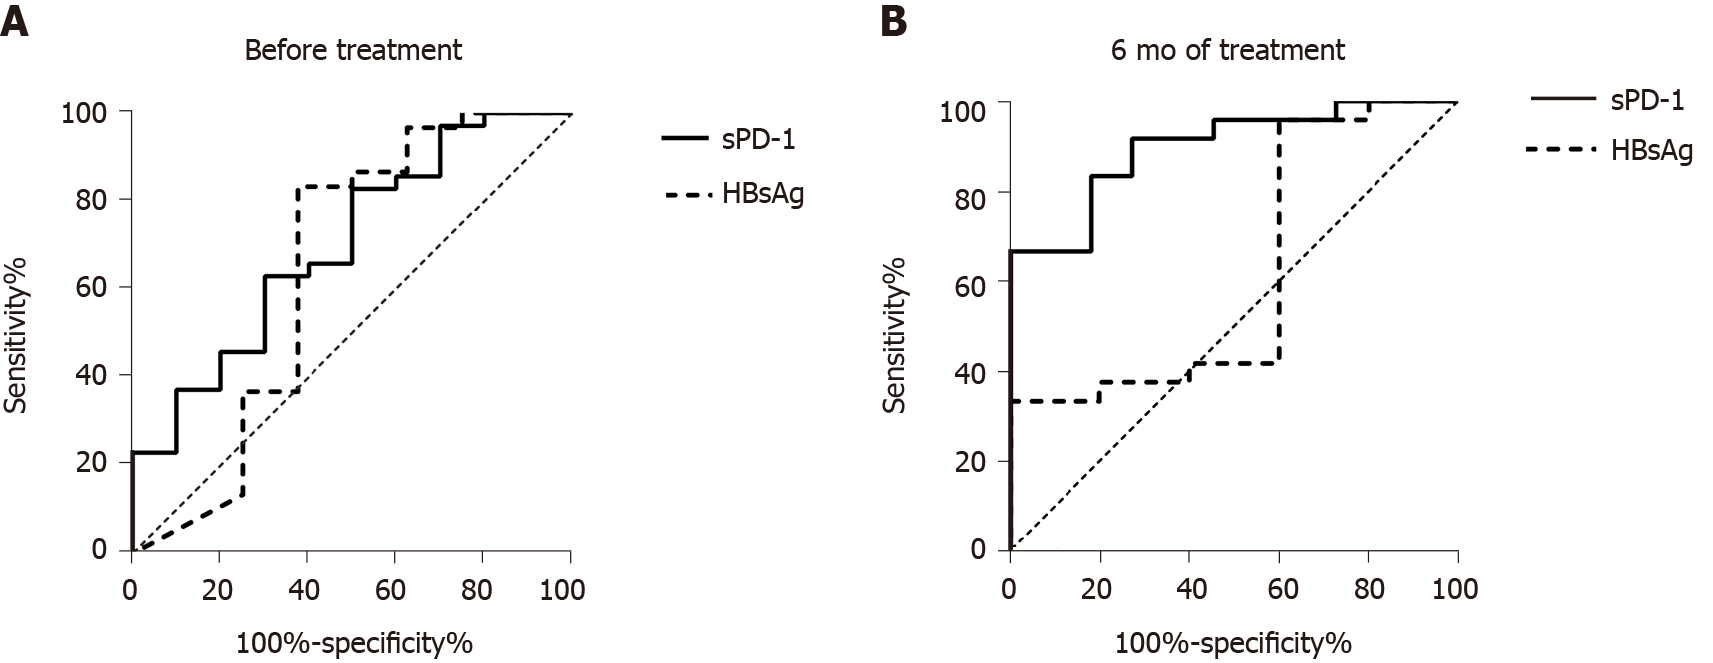
Figure 4 Receiver operating characteristic curves of soluble programmed death-1 and hepatitis B surface antigen levels in the prediction of subsequent hepatitis B surface antigen loss.
A: Before treatment; B: After 6 mo of treatment. sPD-1: Soluble programmed death-1; HBsAg: Hepatitis B surface antigen.
- Citation: Tan N, Luo H, Kang Q, Pan JL, Cheng R, Xi HL, Chen HY, Han YF, yang YP, Xu XY. Soluble programmed death-1 is predictive of hepatitis B surface antigen loss in chronic hepatitis B patients after antiviral treatment. World J Clin Cases 2021; 9(21): 5812-5821
- URL: https://www.wjgnet.com/2307-8960/full/v9/i21/5812.htm
- DOI: https://dx.doi.org/10.12998/wjcc.v9.i21.5812


