Copyright
©The Author(s) 2020.
World J Clin Cases. Mar 26, 2020; 8(6): 1074-1086
Published online Mar 26, 2020. doi: 10.12998/wjcc.v8.i6.1074
Published online Mar 26, 2020. doi: 10.12998/wjcc.v8.i6.1074
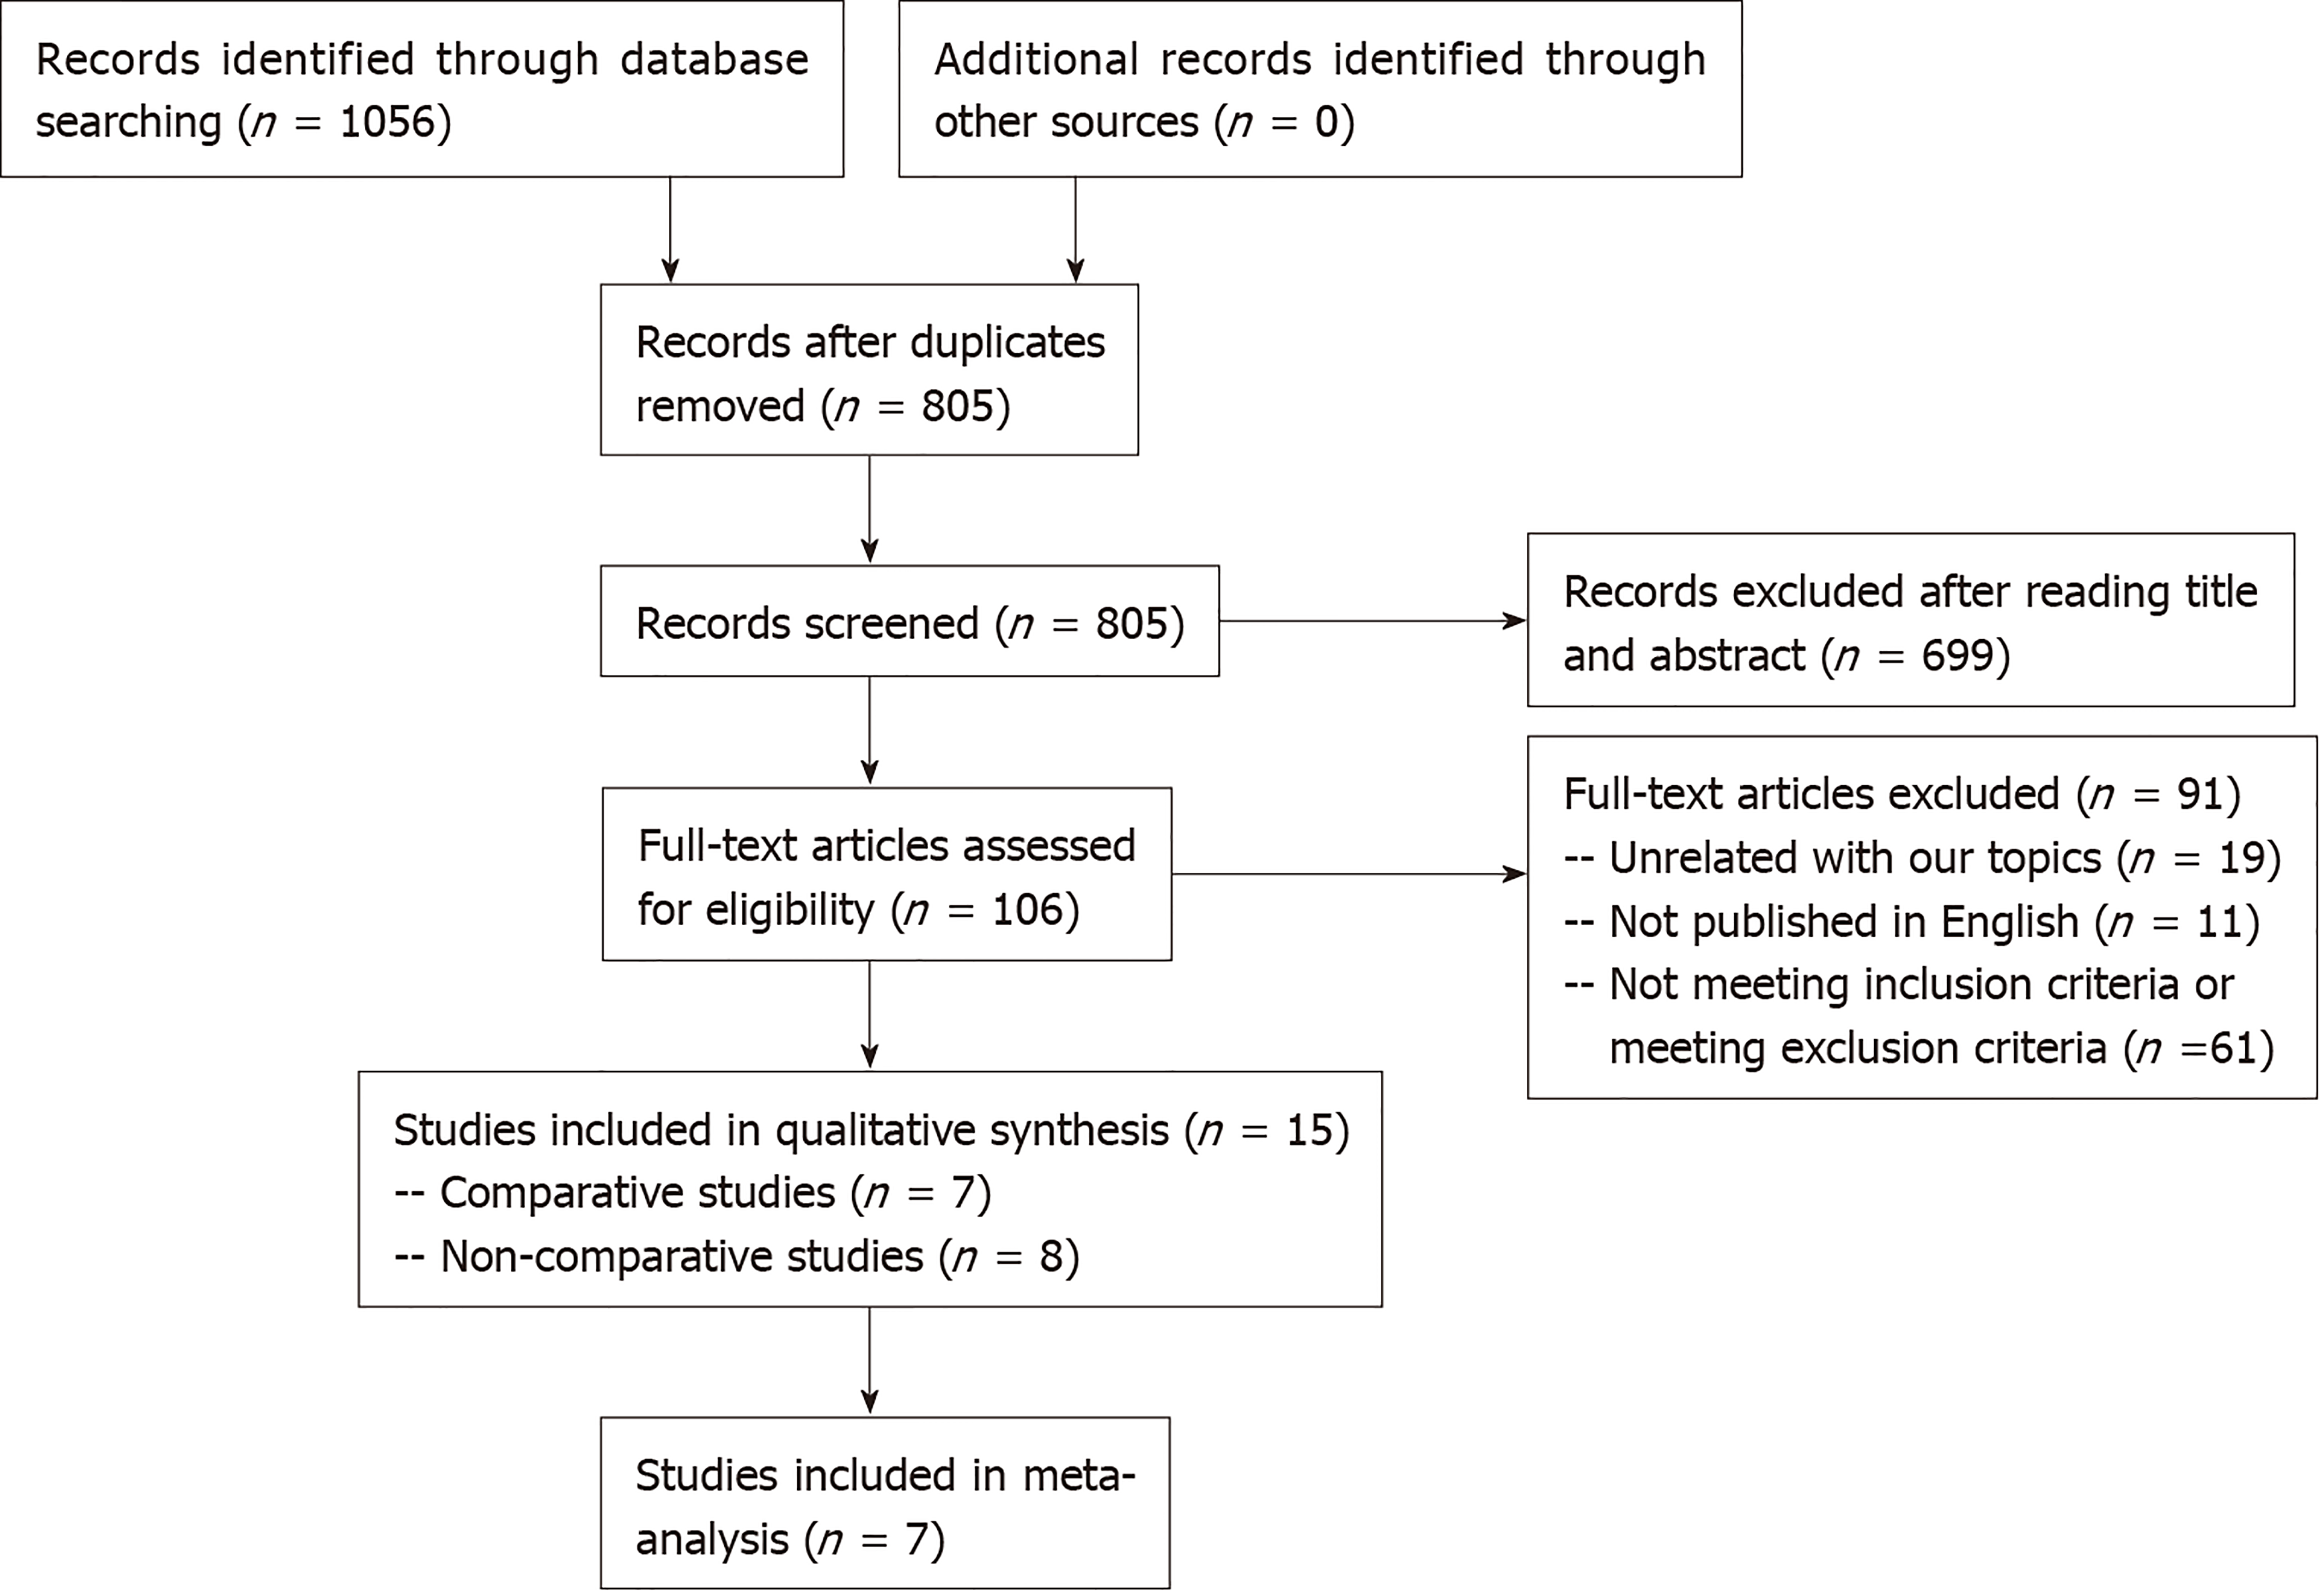
Figure 1 A preferred reporting items for systematic reviews and meta-analyses diagram detailing the search strategy and identification of studies for the systematic review and meta-analysis.
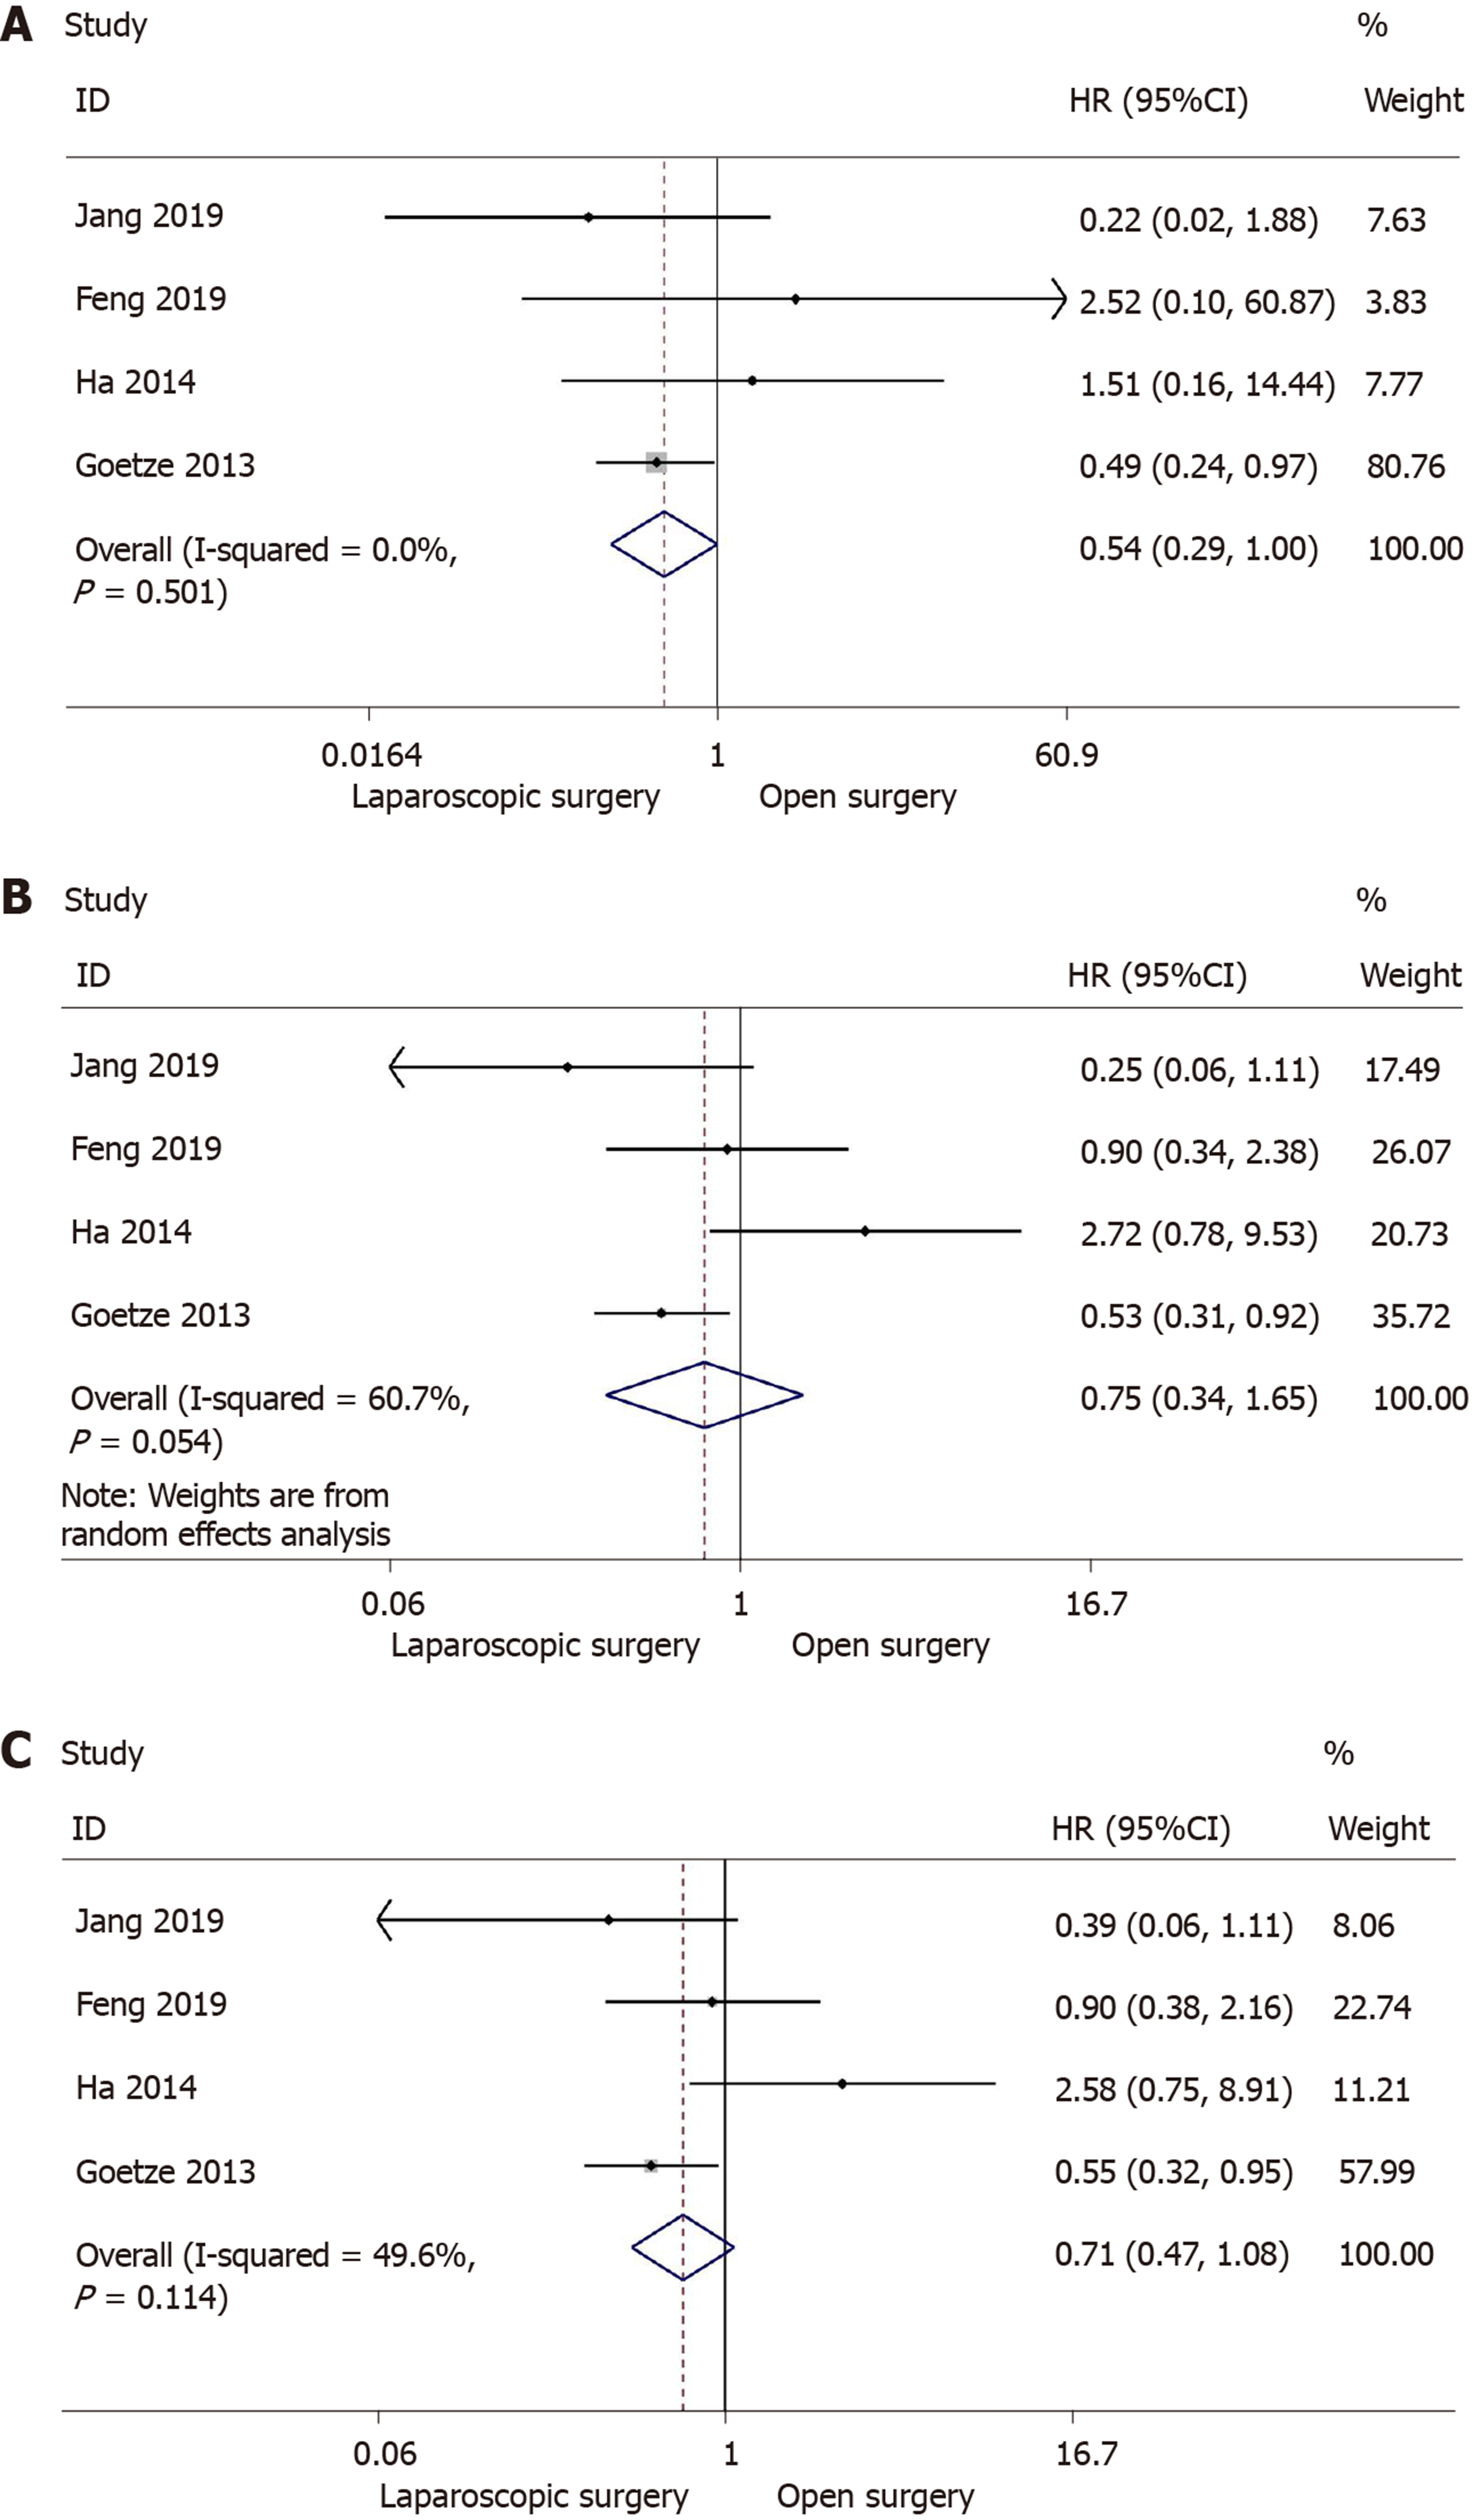
Figure 2 Forest plot and meta-analysis of primary outcome.
A: Forest plot and meta-analysis of 1-year overall survival; B: Forest plot and meta-analysis of 3-year overall survival; C: Forest plot and meta-analysis of 5-year overall survival.
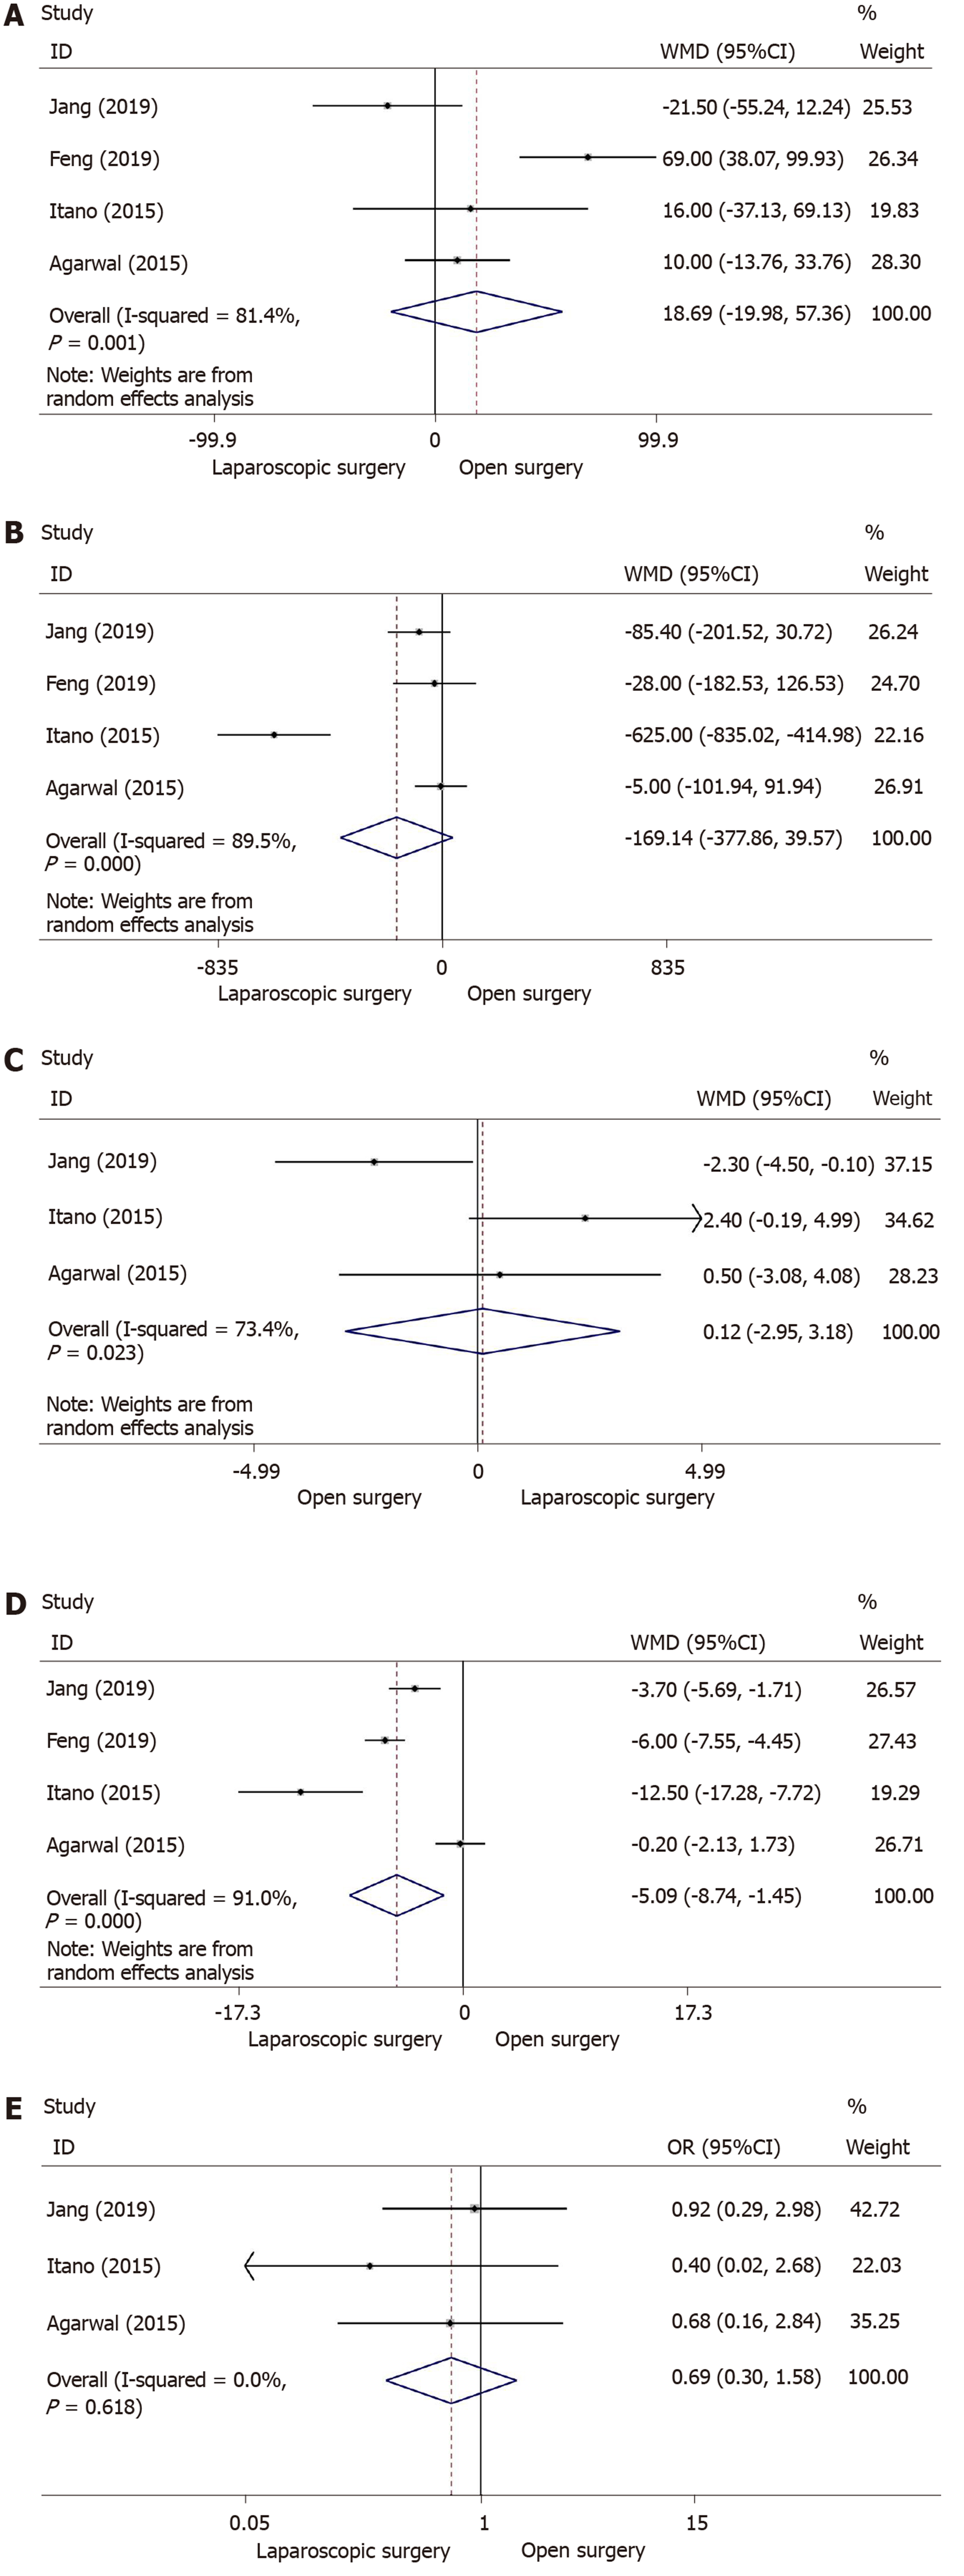
Figure 3 Forest plot of meta-analysis of secondary outcomes.
A: Forest plot of weighted mean difference (WMD) of operation time; B: Forest plot of WMD of intraoperative blood loss; C: Forest plot of WMD of the number of lymph node dissected; D: Forest plot of WMD of postoperative hospital stay; E: Forest plot of odds ratio of postoperative complications. WMD: Weighted mean difference.
- Citation: Feng X, Cao JS, Chen MY, Zhang B, Juengpanich S, Hu JH, Topatana W, Li SJ, Shen JL, Xiao GY, Cai XJ, Yu H. Laparoscopic surgery for early gallbladder carcinoma: A systematic review and meta-analysis. World J Clin Cases 2020; 8(6): 1074-1086
- URL: https://www.wjgnet.com/2307-8960/full/v8/i6/1074.htm
- DOI: https://dx.doi.org/10.12998/wjcc.v8.i6.1074


