Copyright
©The Author(s) 2020.
World J Clin Cases. Aug 6, 2020; 8(15): 3349-3354
Published online Aug 6, 2020. doi: 10.12998/wjcc.v8.i15.3349
Published online Aug 6, 2020. doi: 10.12998/wjcc.v8.i15.3349
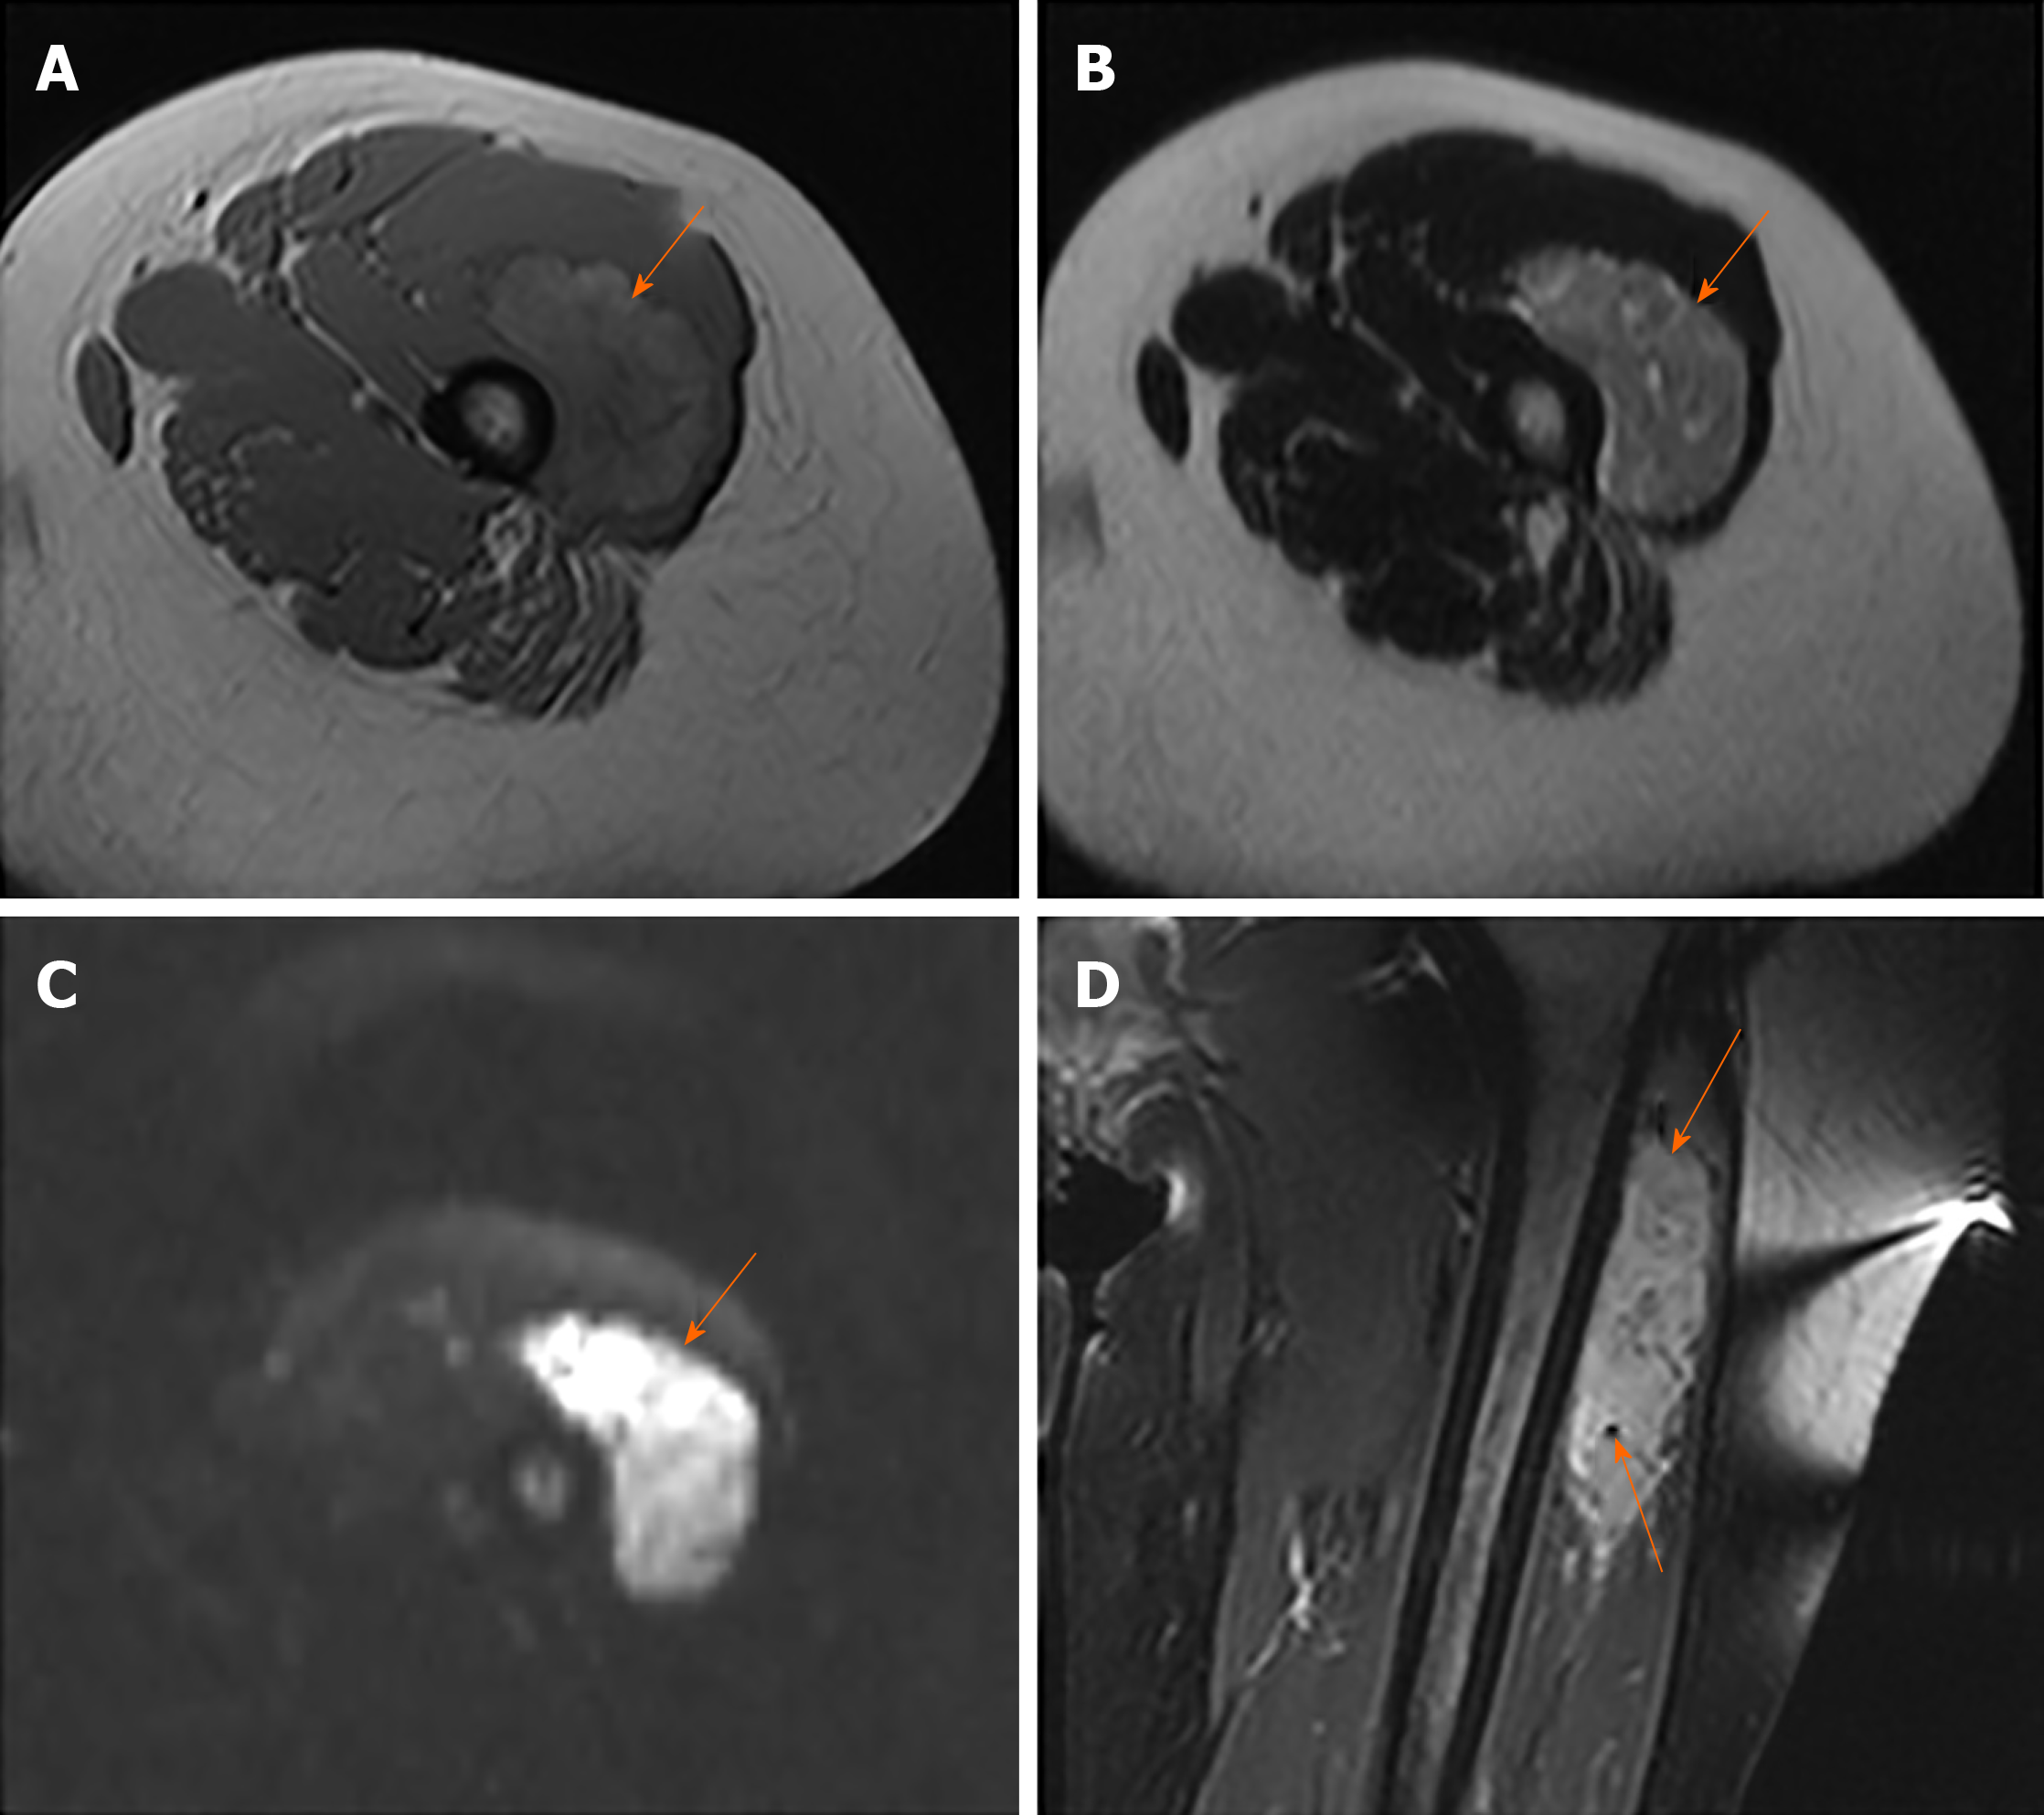
Figure 1 Alveolar soft part sarcoma in a 35-year-old woman.
A: T1-weighted image showing an inhomogeneous lesion (orange arrow) with slightly high signal intensity in the left thigh; B: T2-weighted image demonstrating an inhomogeneous mass (orange arrow) with high signal intensity; C: Diffusion-weighted imaging showing a mass of high signal intensity (orange arrow); D: Coronal T2-weighted image with fat suppression revealing numerous signal voids (intra-/extra-tumor, orange arrow).
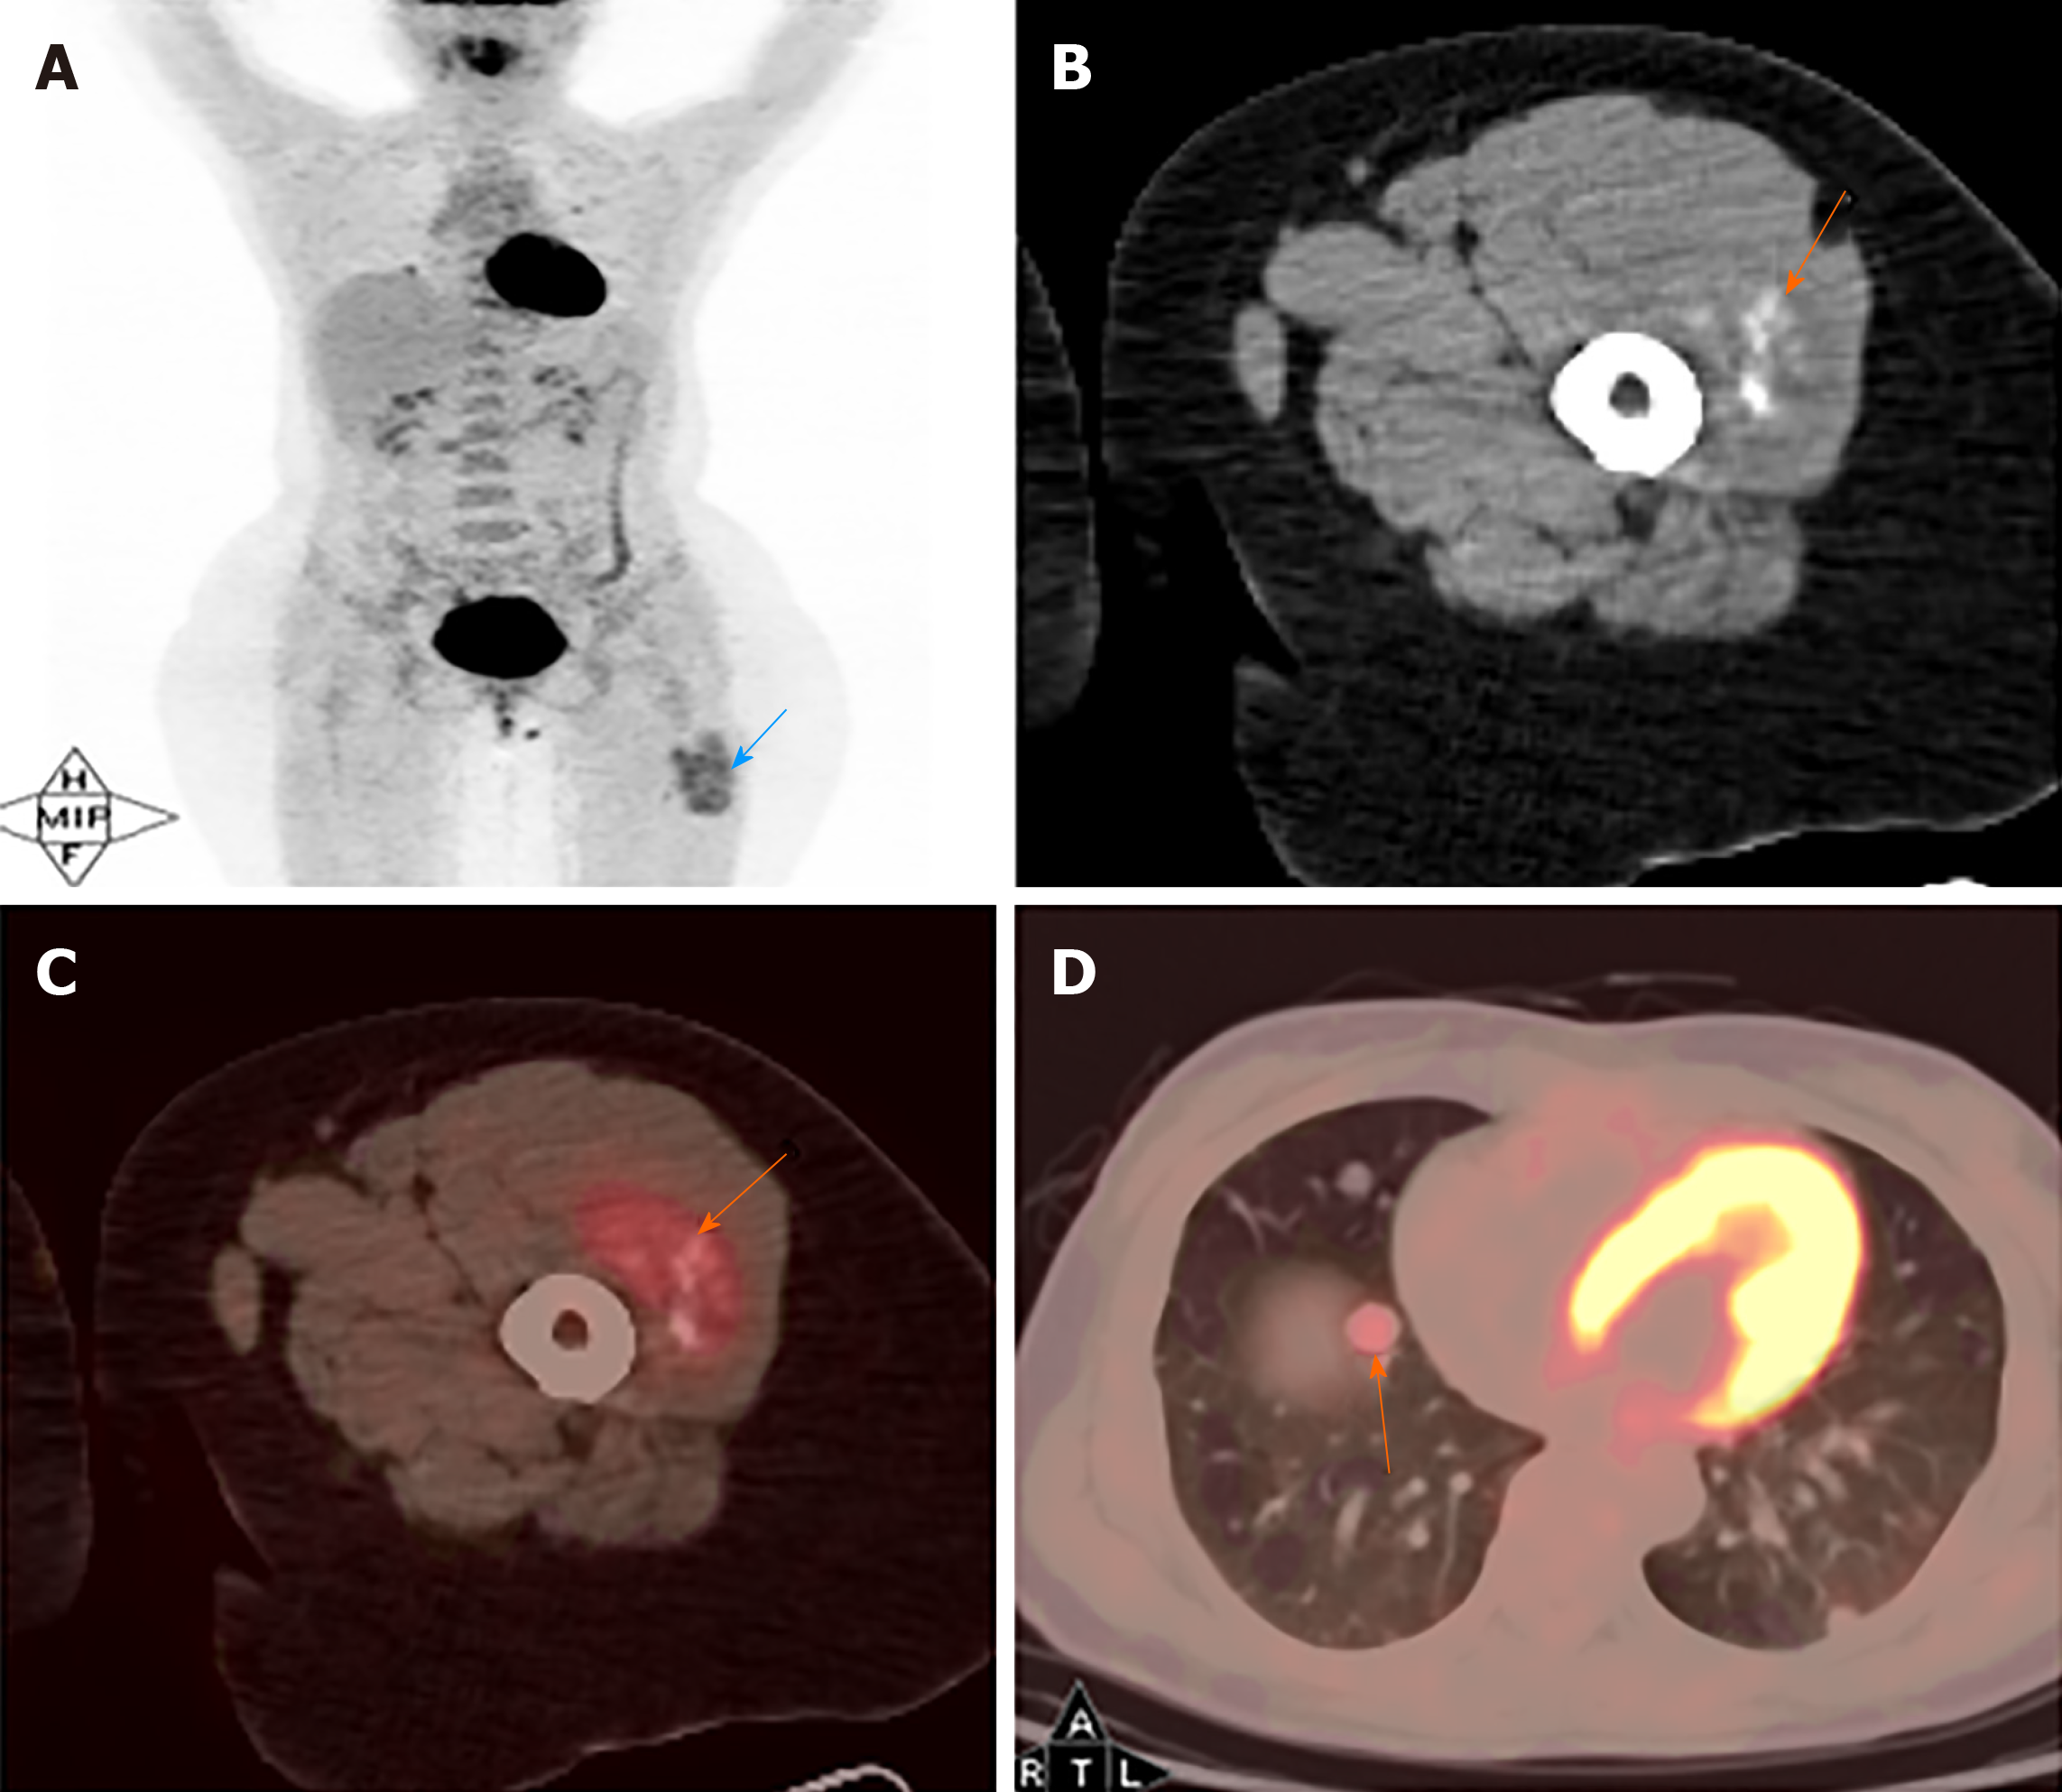
Figure 2 Positron emission computed tomography/computed tomography findings of the same patient.
A: Maximum intensity projection demonstrating an intense hypermetabolic mass (blue arrow) in the left thigh and hypermetabolic nodules in the lungs; B: Computed tomography image revealing a slightly hypodense or isodense mass with patchy calcifications (orange arrow); C: Positron emission computed tomography/computed tomography fusion image showing an inhomogeneous mass of increased F-deoxyglucose uptake (orange arrow) with standardized uptake valuemax of 4.23; D: Hypermetabolic subpleural pulmonary metastases (orange arrow) with standardized uptake valuemax of 3.58 detected on positron emission computed tomography/computed tomography fusion images.
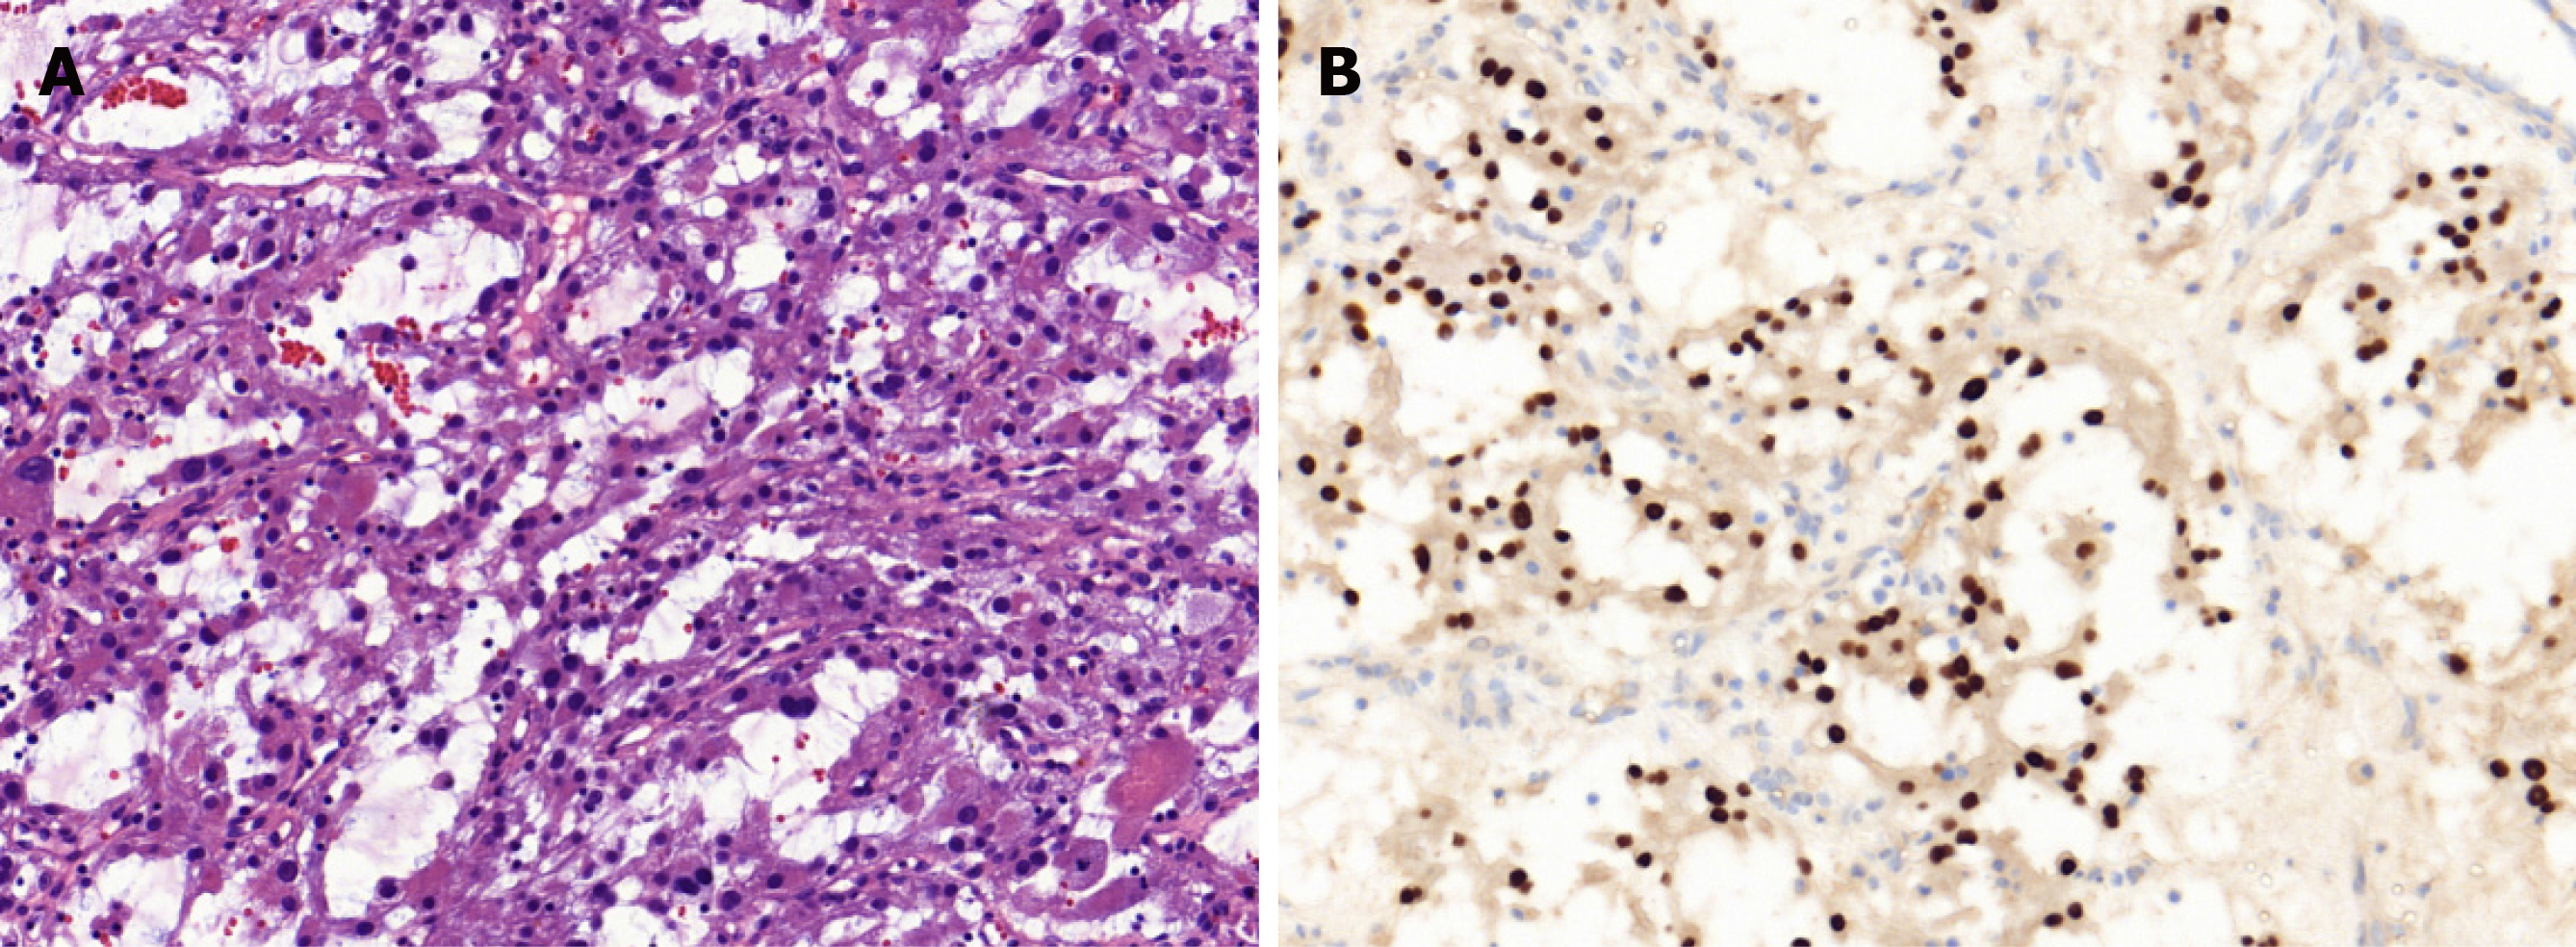
Figure 3 Histopathological examination of the same patient.
A: Showing a pseudoalveolar pattern with nests of large granular cells separated by sinusoidal vascular channels (hematoxylin–eosin stain, magnification × 20); B: Showing that the nuclear cells were positive for transcription factor E3 (magnification × 20).
- Citation: Wu ZJ, Bian TT, Zhan XH, Dong C, Wang YL, Xu WJ. Computed tomography, magnetic resonance imaging, and F-deoxyglucose positron emission computed tomography/computed tomography findings of alveolar soft part sarcoma with calcification in the thigh: A case report. World J Clin Cases 2020; 8(15): 3349-3354
- URL: https://www.wjgnet.com/2307-8960/full/v8/i15/3349.htm
- DOI: https://dx.doi.org/10.12998/wjcc.v8.i15.3349


