Copyright
©The Author(s) 2020.
World J Clin Cases. Jul 6, 2020; 8(13): 2817-2832
Published online Jul 6, 2020. doi: 10.12998/wjcc.v8.i13.2817
Published online Jul 6, 2020. doi: 10.12998/wjcc.v8.i13.2817
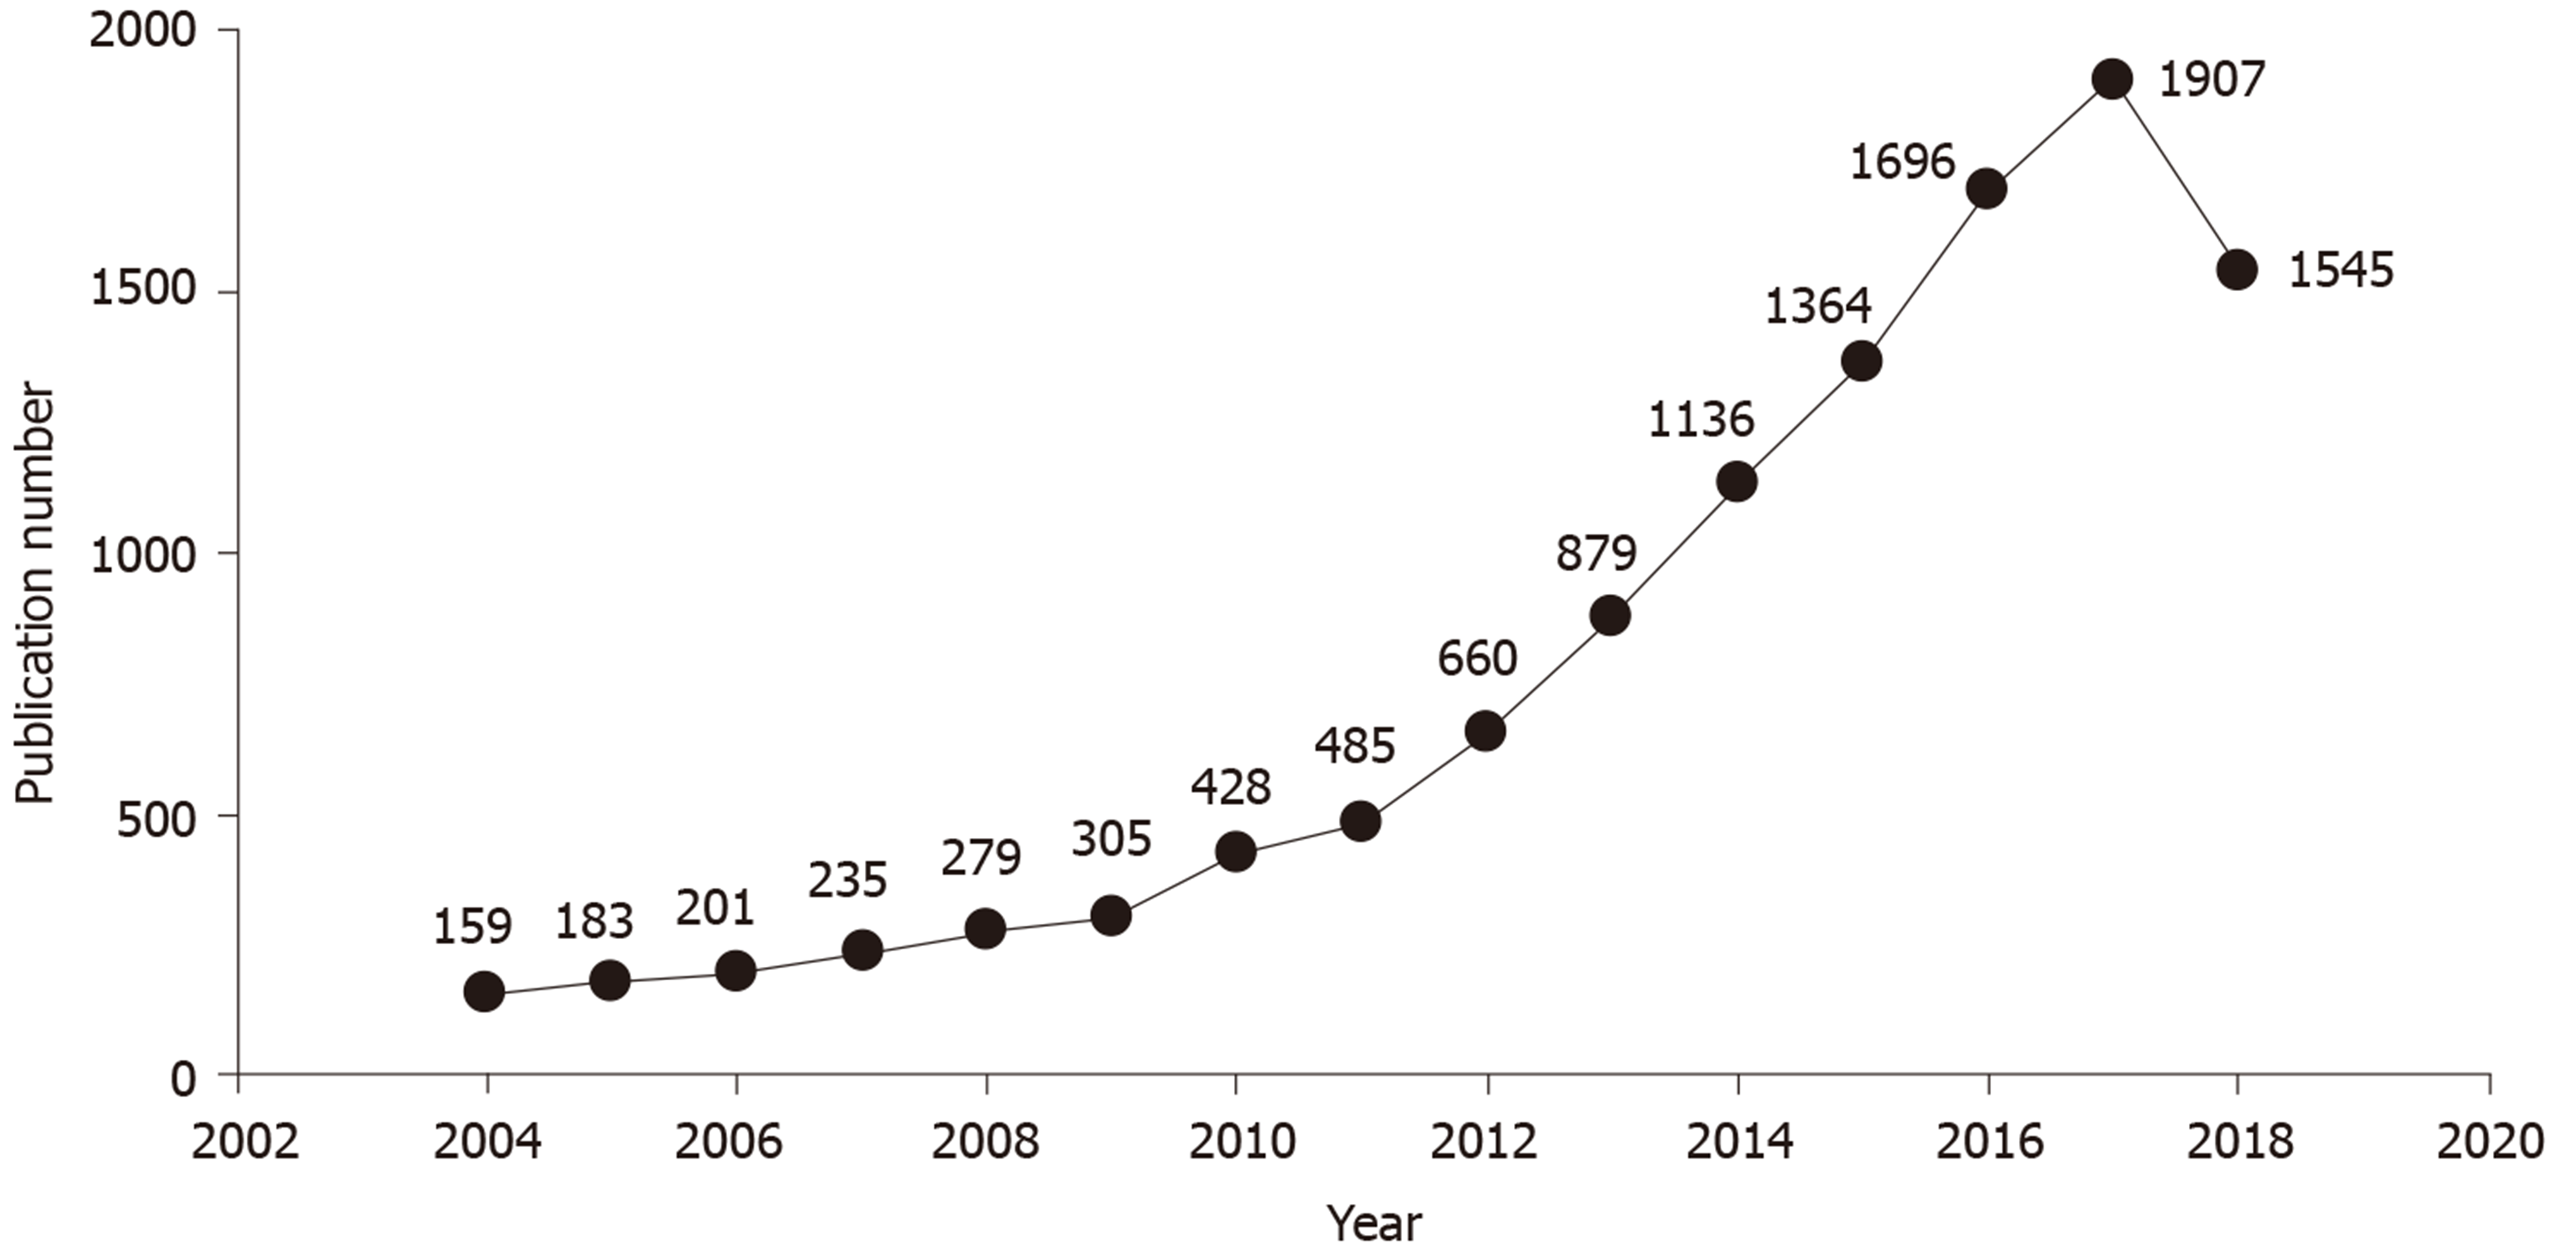
Figure 1 The number of gut microbiota related publications in 2004-2018.
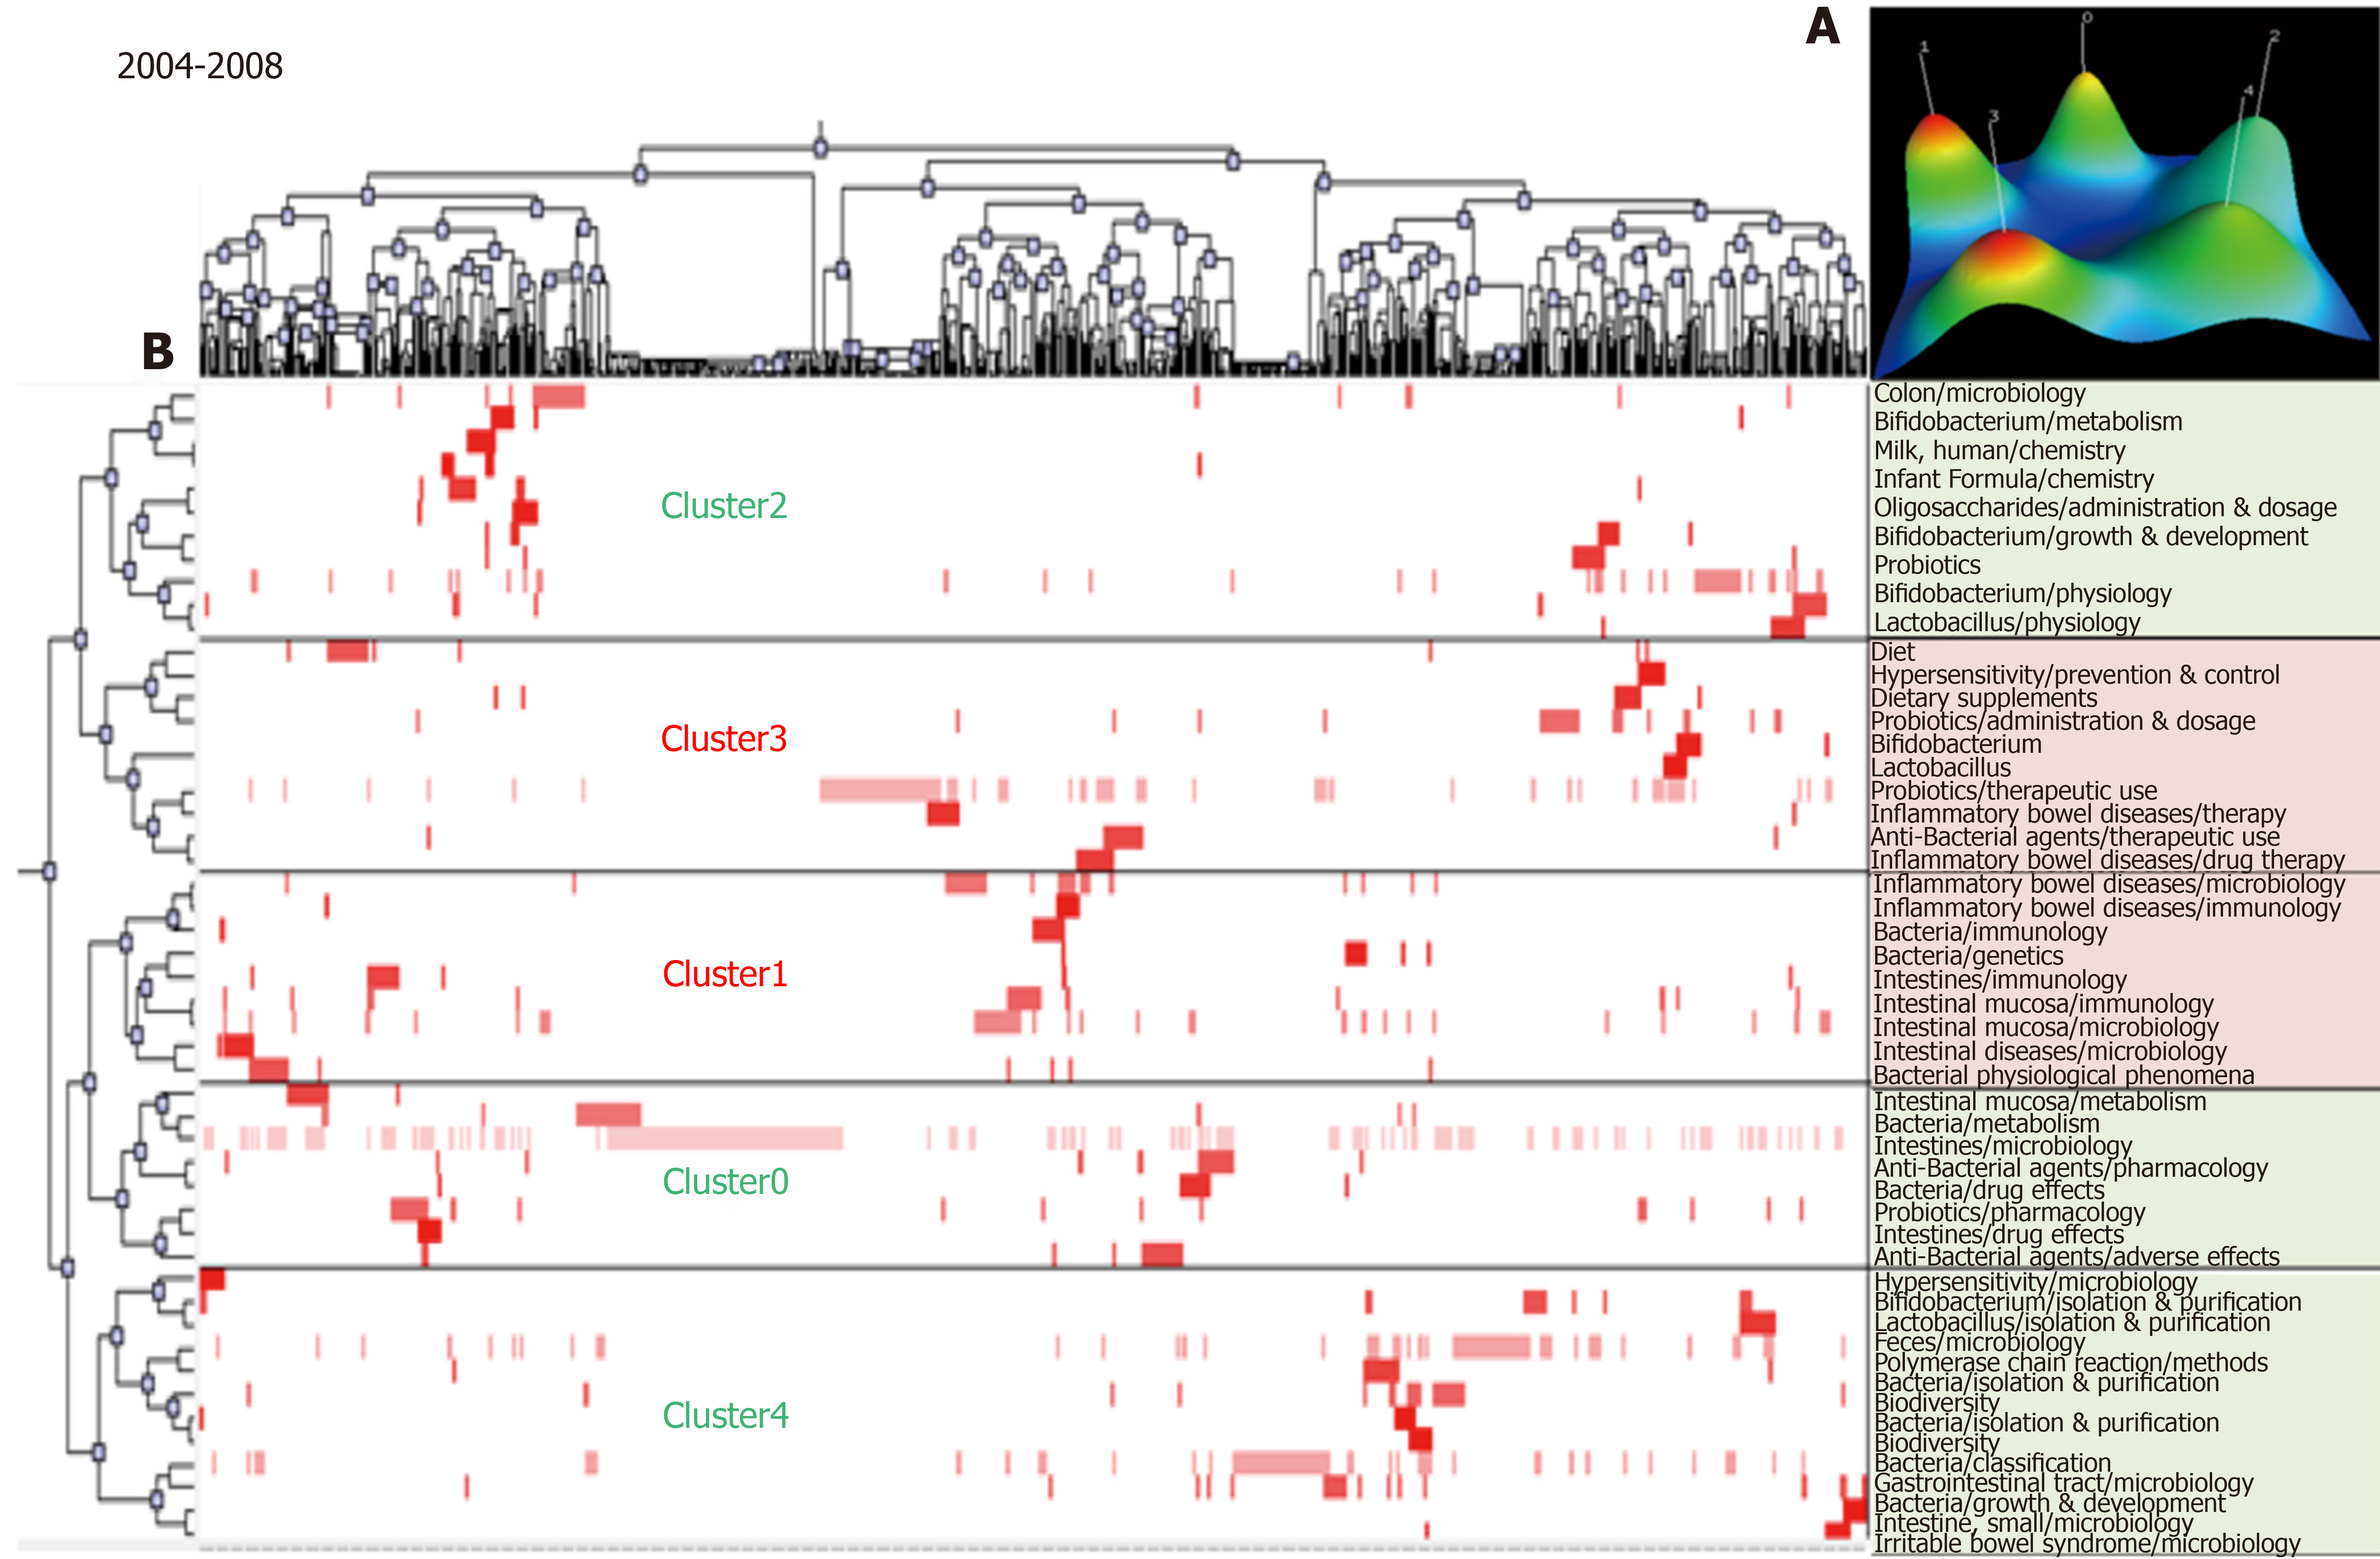
Figure 2 Biclustering analysis of 50 high frequency major Medical Subject Heading terms/Medical Subject Heading subheadings from 2004 to 2008.
A: Mountain visualization of biclustering of 50 high frequency major Medical Subject Heading (MeSH) terms/MeSH subheadings and articles; B: Matrix visualization of biclustering for 50 high-frequency major MeSH terms/MeSH subheadings and PubMed unique identifiers.
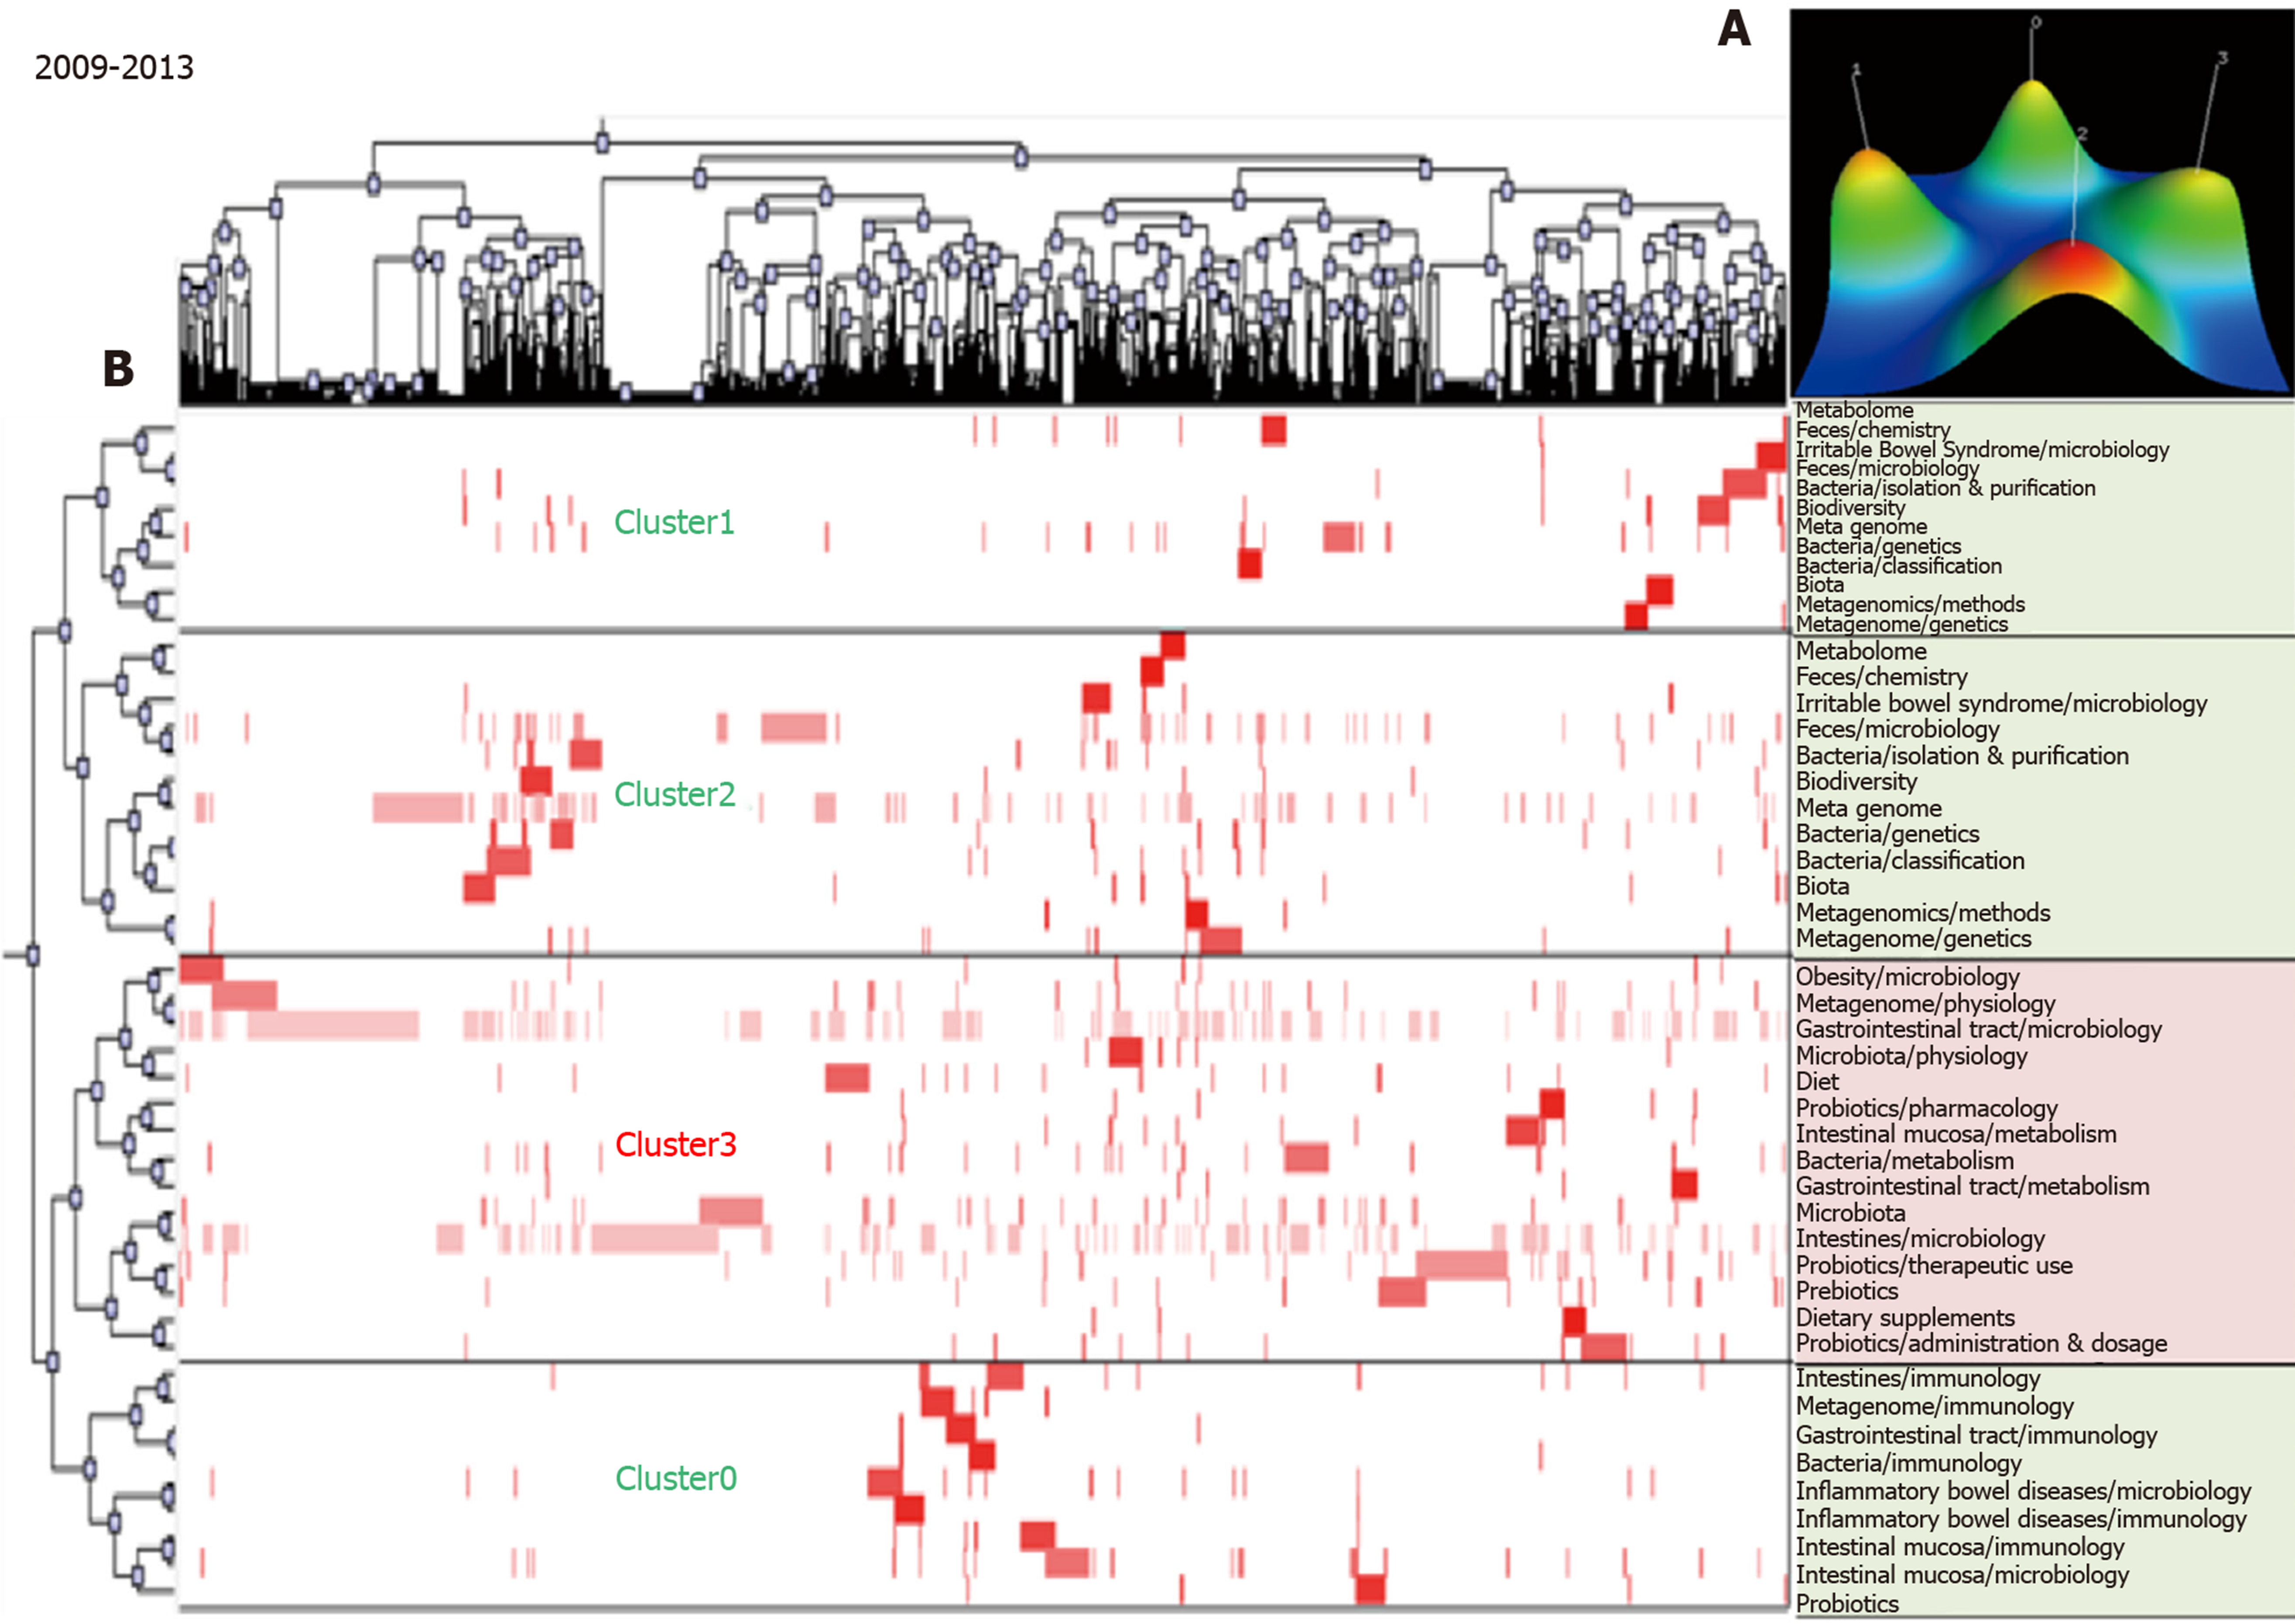
Figure 3 Biclustering analysis of 44 high frequency major Medical Subject Heading terms/Medical Subject Heading subheadings from 2009 to 2013.
A: Mountain visualization of biclustering of 44 high frequency major Medical Subject Heading (MeSH) terms/MeSH subheadings and articles; B: Matrix visualization of biclustering for 44 high-frequency major MeSH terms/MeSH subheadings and PubMed unique identifiers.
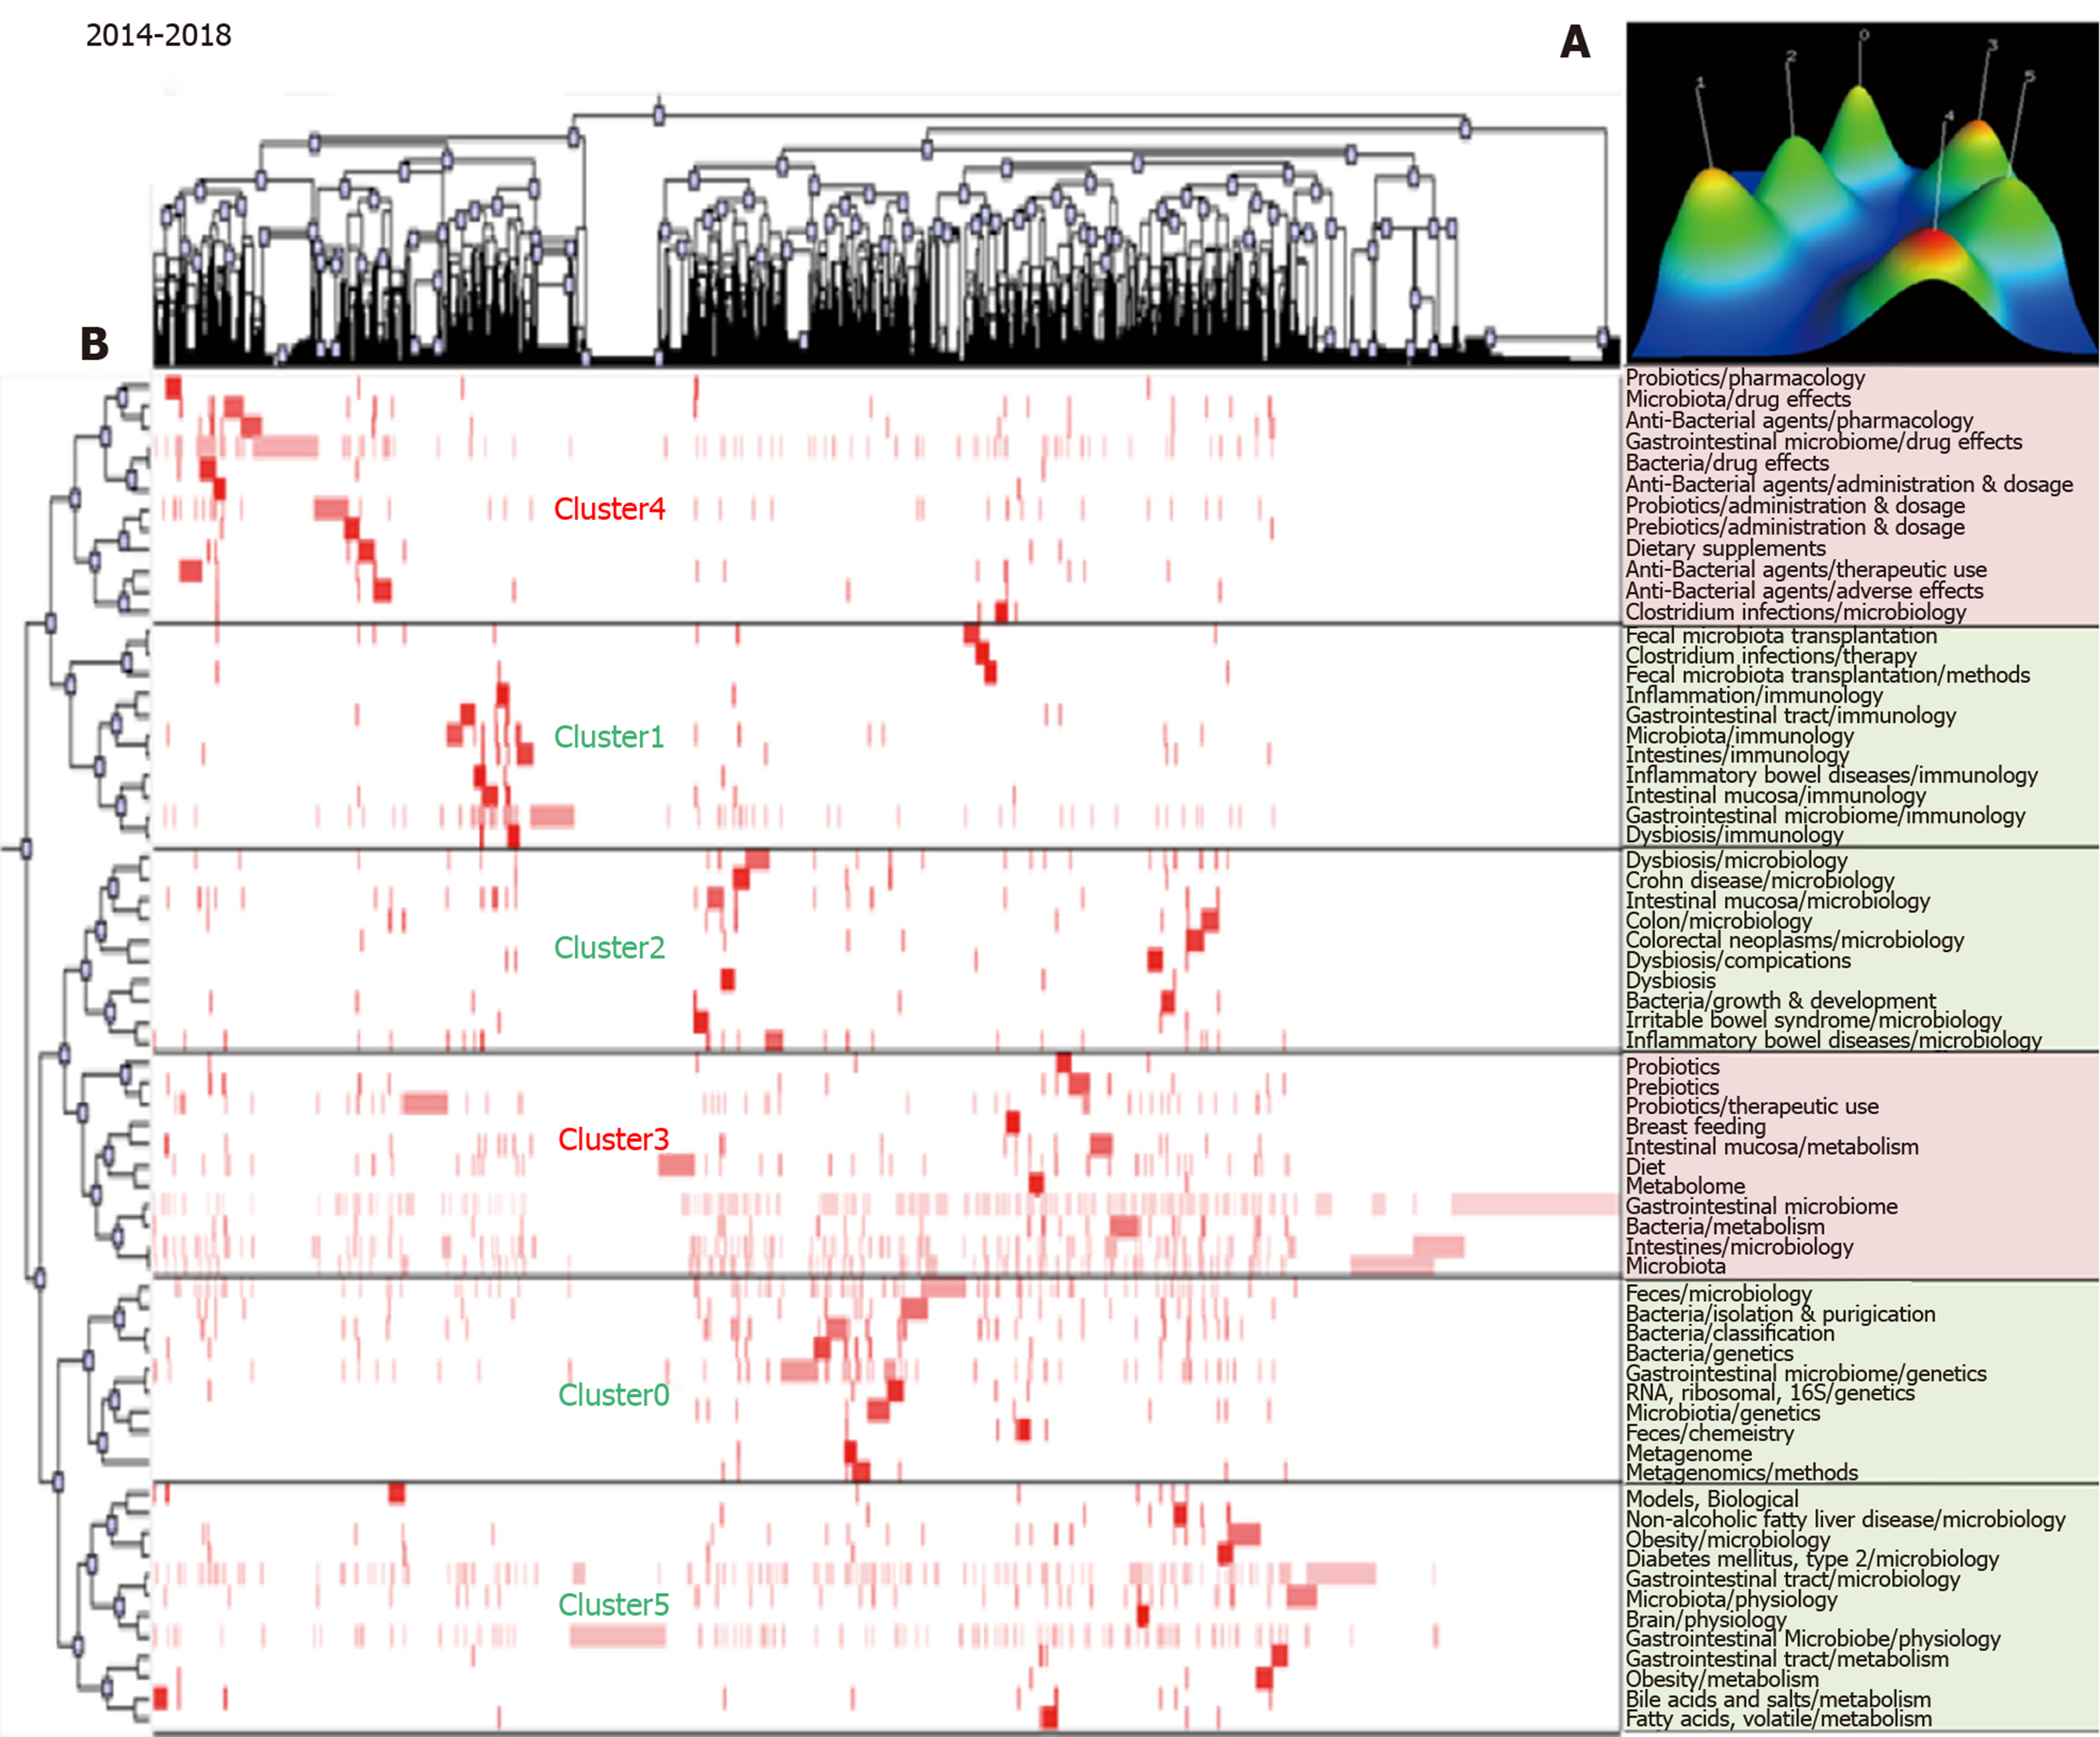
Figure 4 Biclustering analysis of 66 high frequency major Medical Subject Heading terms/Medical Subject Heading subheadings from 2014 to 2018.
A: Mountain visualization of biclustering of 66 high frequency major Medical Subject Heading (MeSH) terms/MeSH subheadings and articles; B: Matrix visualization of biclustering for 66 high-frequency major MeSH terms/MeSH subheadings and PubMed unique identifiers.
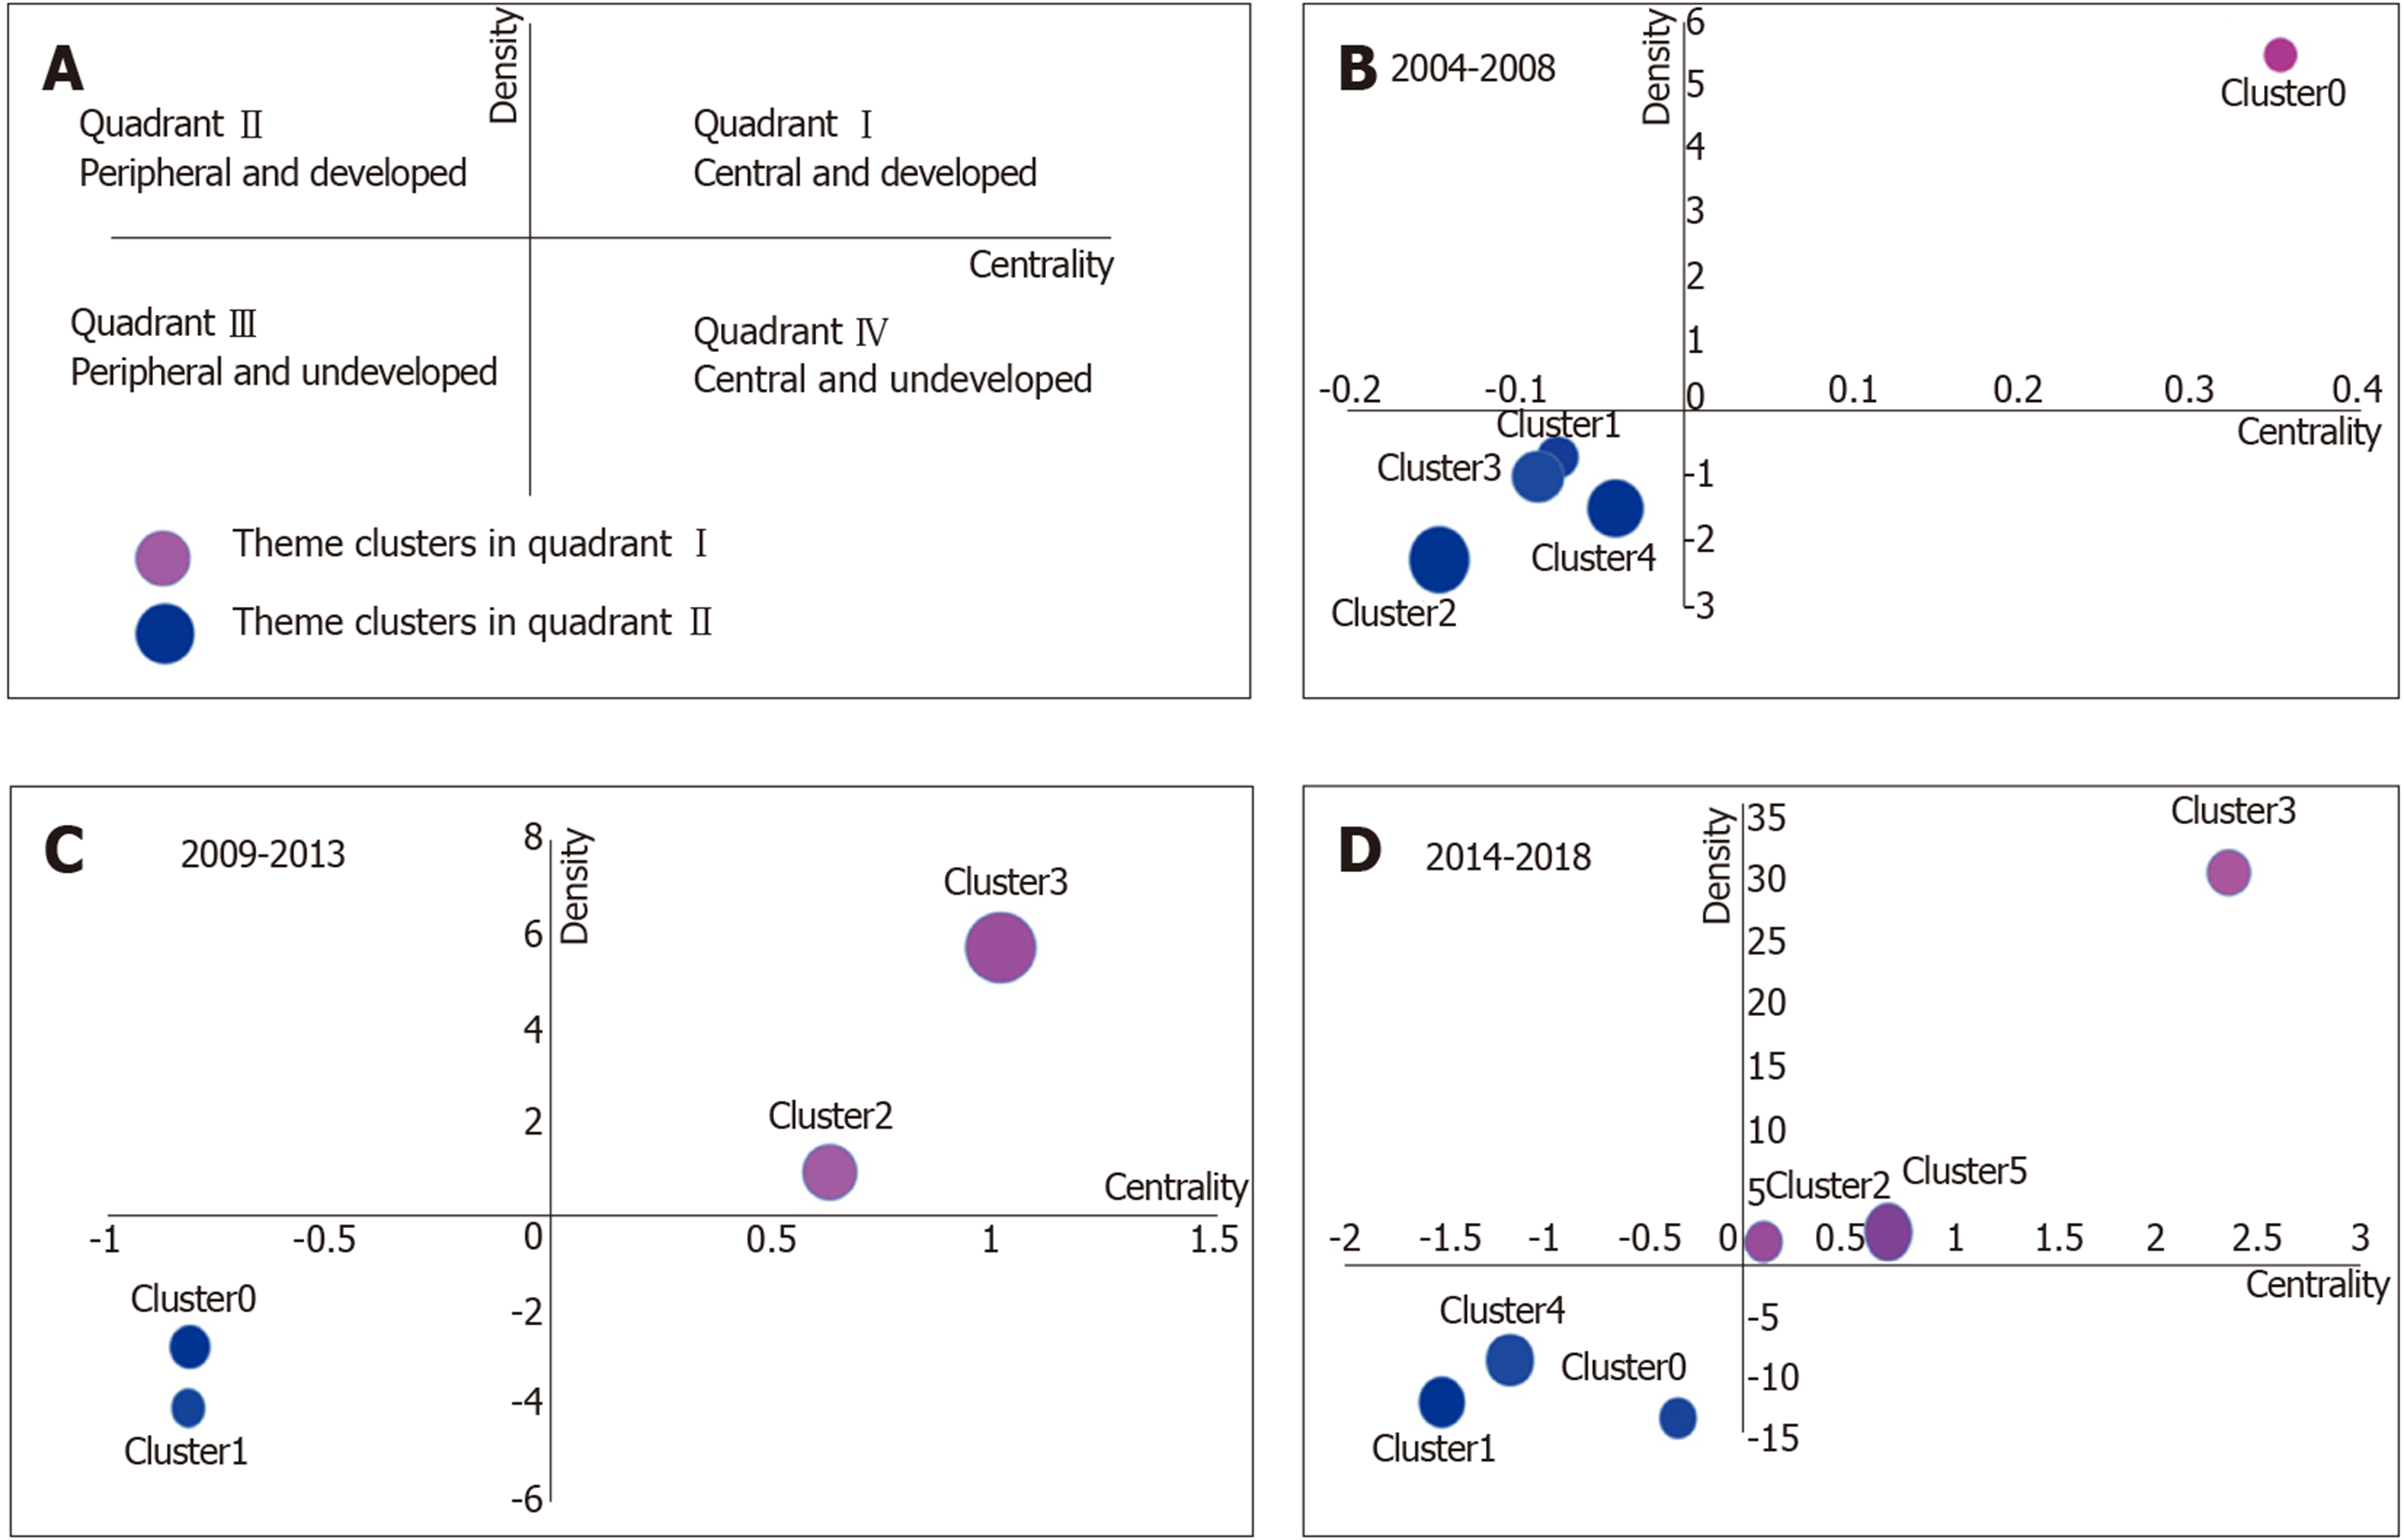
Figure 5 Strategic diagrams of gut microbiota.
A: Signification of strategic diagrams; B: Strategic diagrams of gut microbiota in 2004-2008; C: Strategic diagrams of gut microbiota in 2009–2013; D: Strategic diagrams of gut microbiota in 2014-2018.
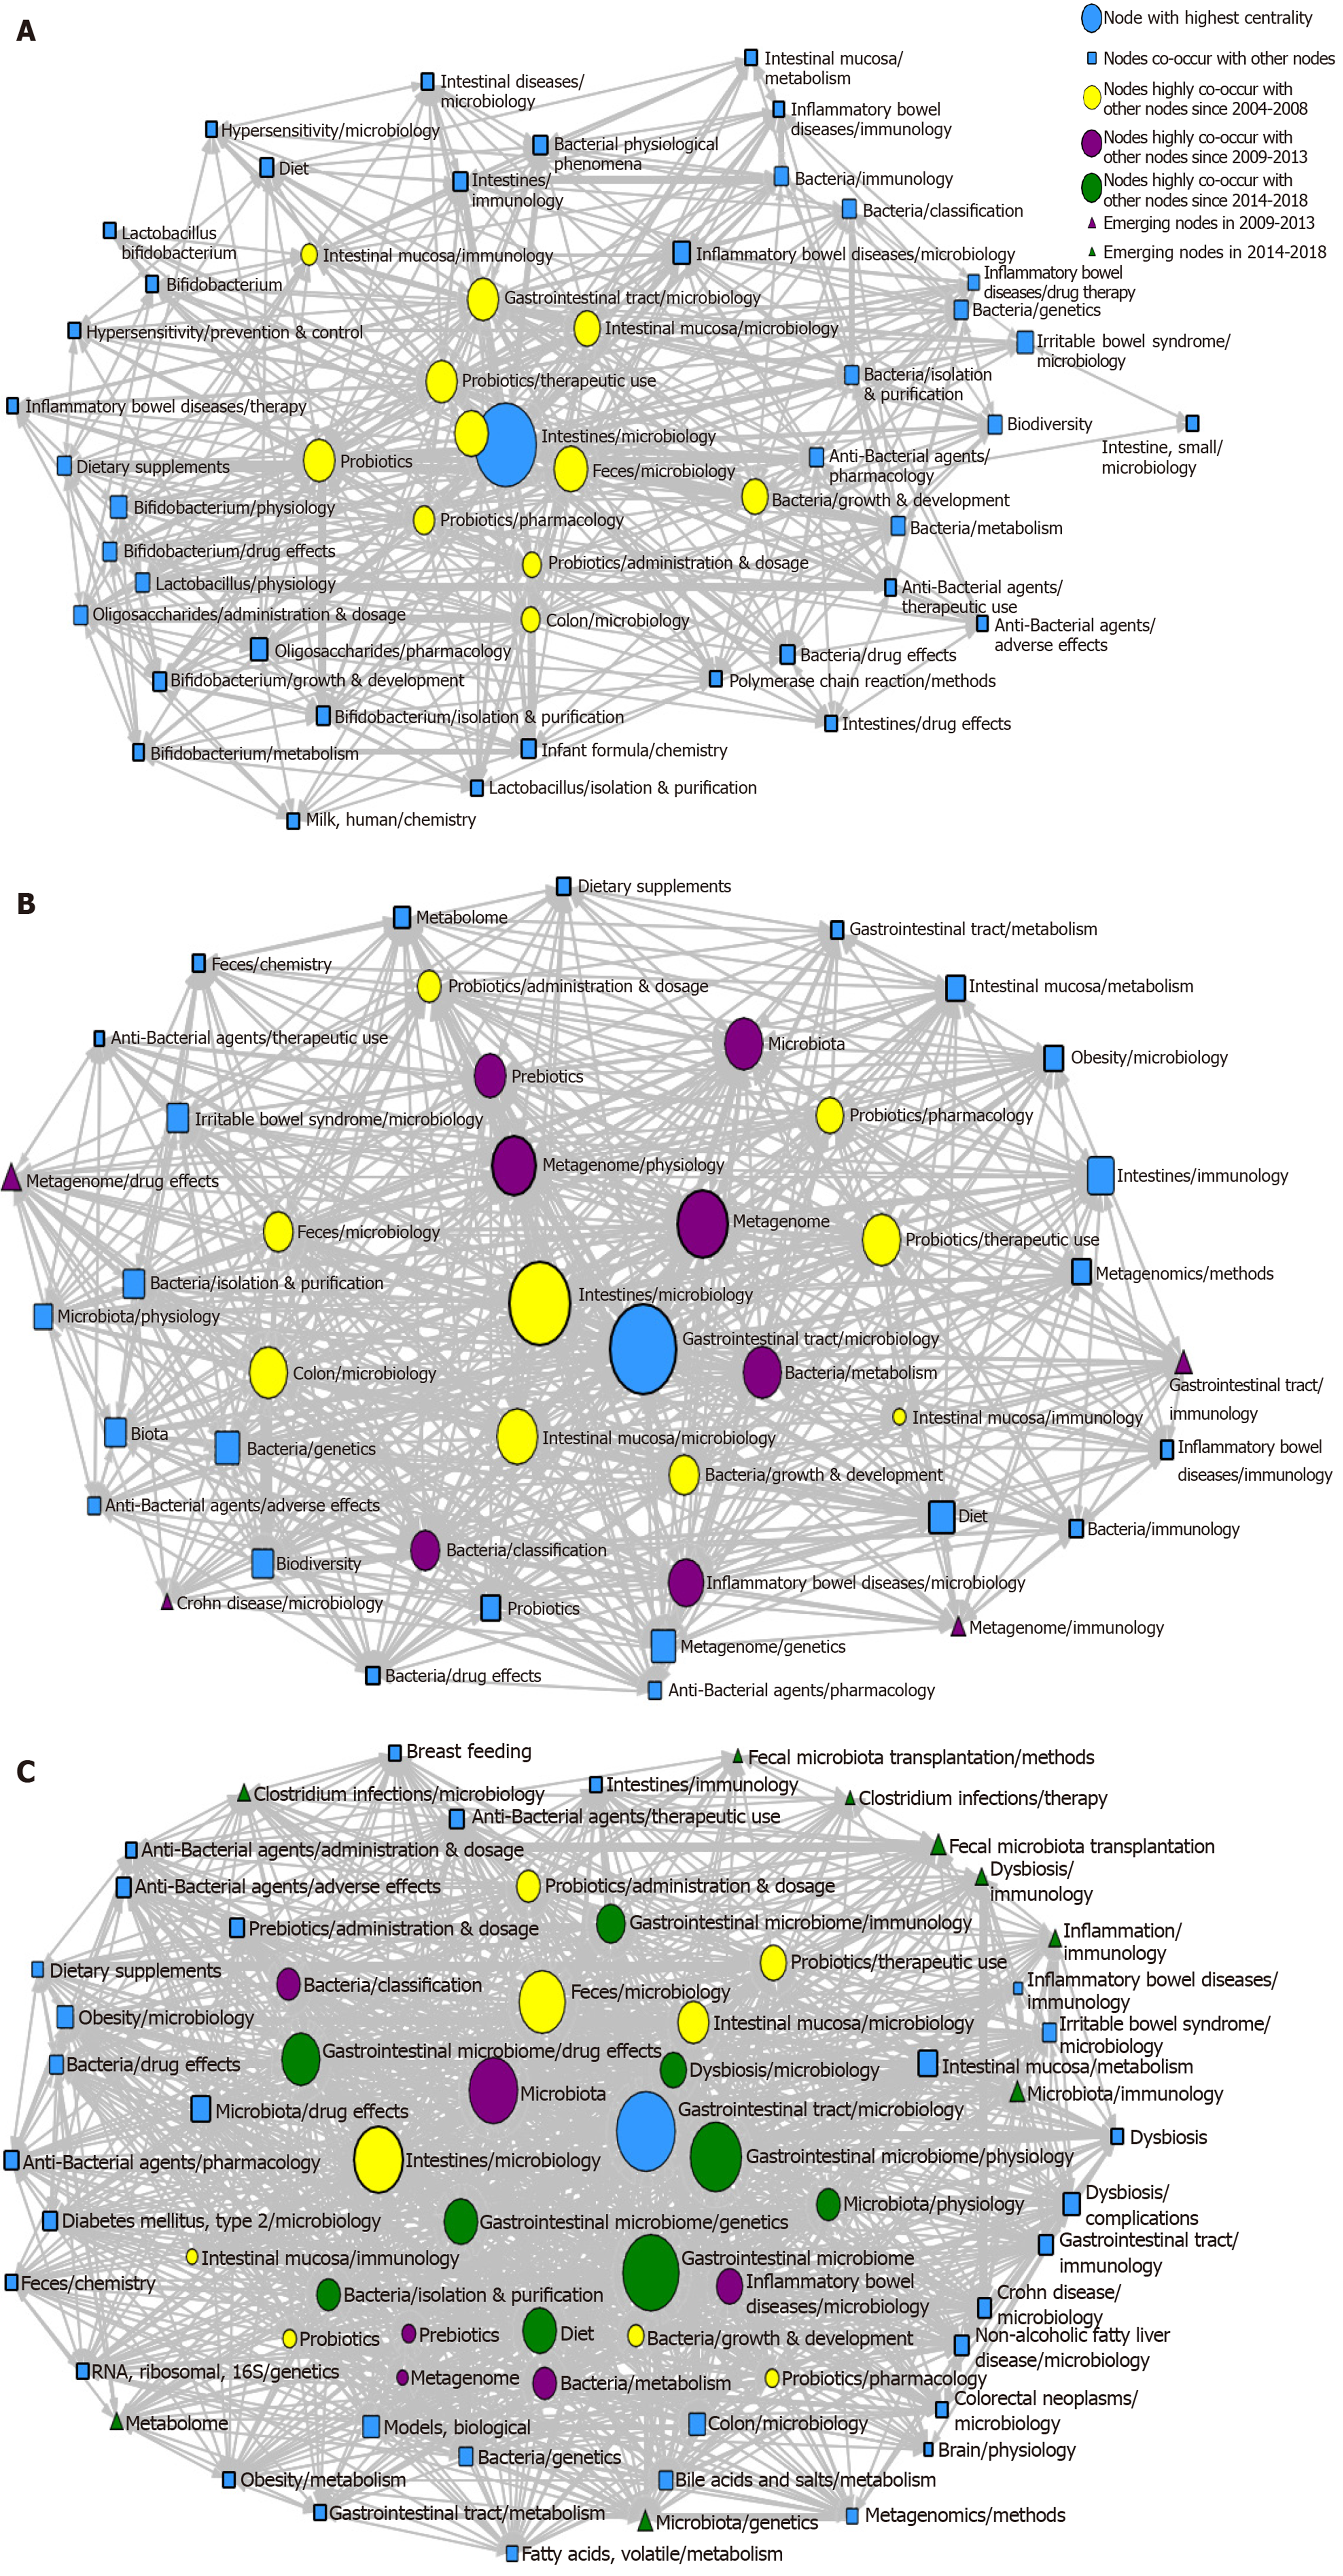
Figure 6 Social network analysis of major Medical Subject Heading terms/Medical Subject Heading subheadings for gut microbiota.
A: Social network analysis of 50 major Medical Subject Heading (MeSH) terms/MeSH subheadings from 2004 to 2008; B: Social network analysis of 44 major MeSH terms/MeSH subheadings from 2009 to 2013; C: Social network analysis of 66 major MeSH terms/MeSH subheadings from 2014 to 2018. (The betweeness, closeness, degree of major MeSH terms/MeSH subheadings for three periods can be found in Supplementary Tables 1, 2 and 4).
- Citation: Yue YY, Fan XY, Zhang Q, Lu YP, Wu S, Wang S, Yu M, Cui CW, Sun ZR. Bibliometric analysis of subject trends and knowledge structures of gut microbiota. World J Clin Cases 2020; 8(13): 2817-2832
- URL: https://www.wjgnet.com/2307-8960/full/v8/i13/2817.htm
- DOI: https://dx.doi.org/10.12998/wjcc.v8.i13.2817


