Copyright
©The Author(s) 2019.
World J Clin Cases. Apr 6, 2019; 7(7): 839-848
Published online Apr 6, 2019. doi: 10.12998/wjcc.v7.i7.839
Published online Apr 6, 2019. doi: 10.12998/wjcc.v7.i7.839
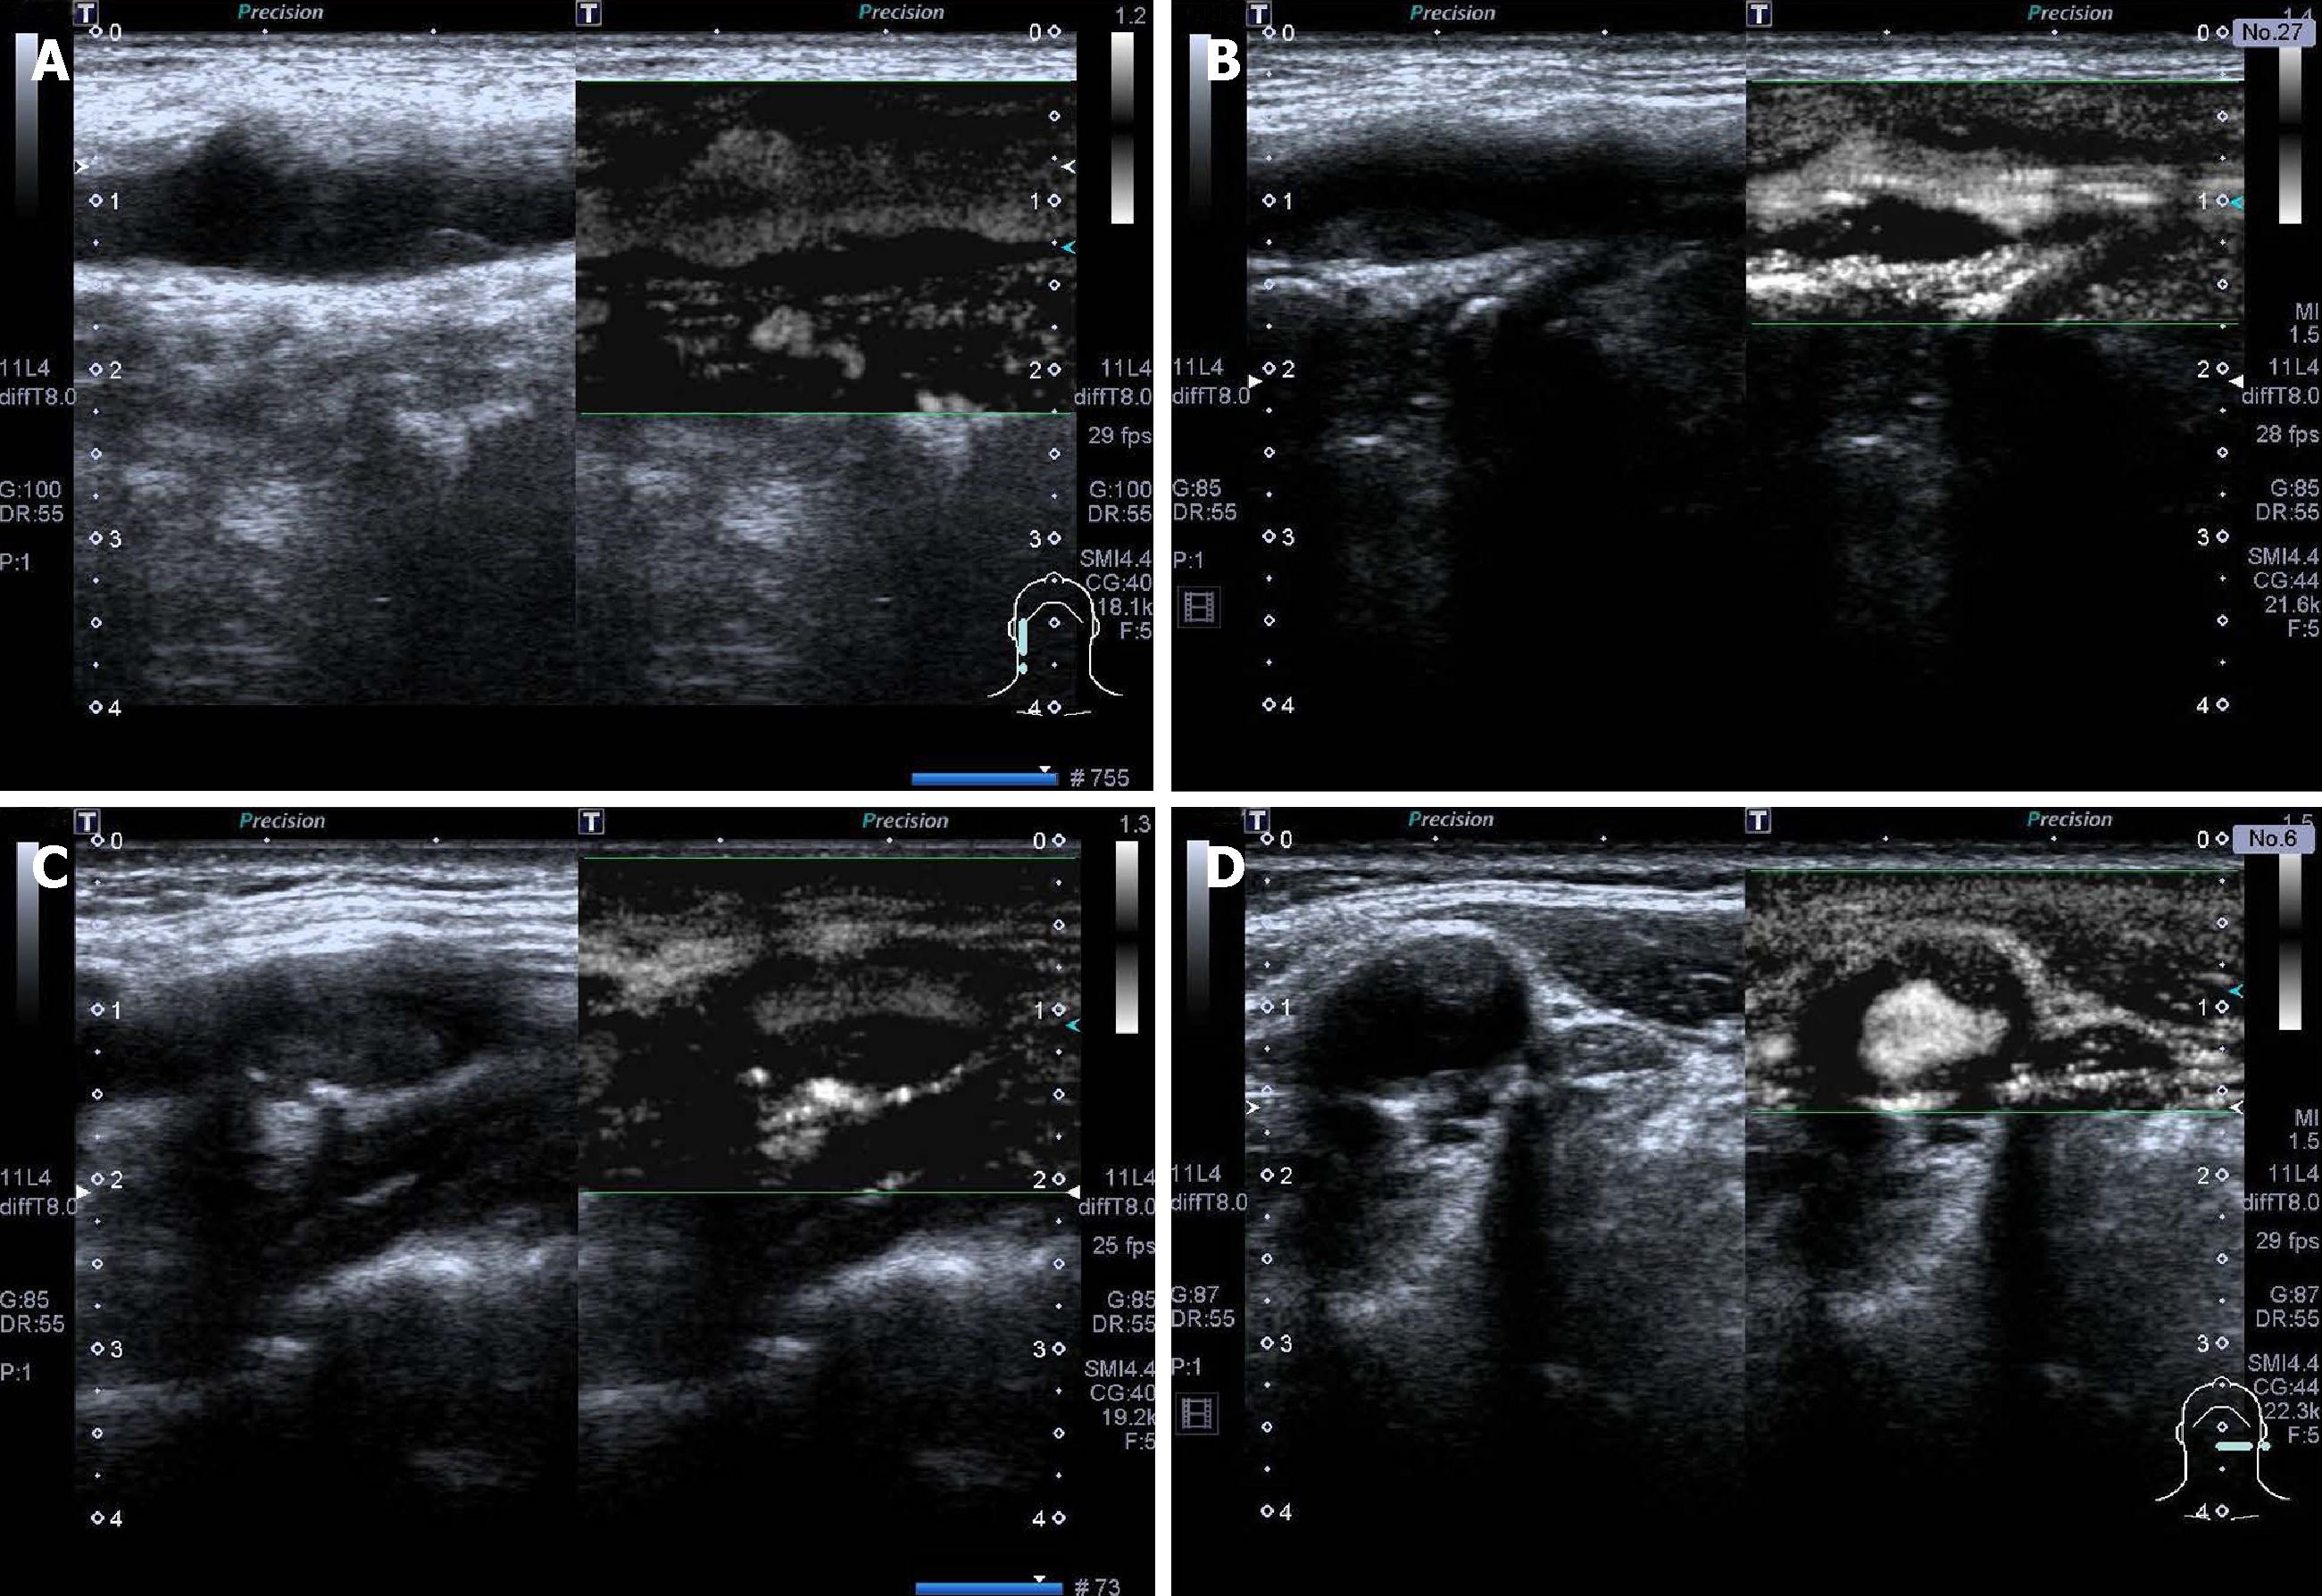
Figure 1 Superb micro-vascular imaging vascular grading in patients with carotid atherosclerosis.
A: Blood flow level 0 in plaque; B: Blood flow level I in plaque; C: Blood flow level II in plaque; D: Blood flow level III in plaque.
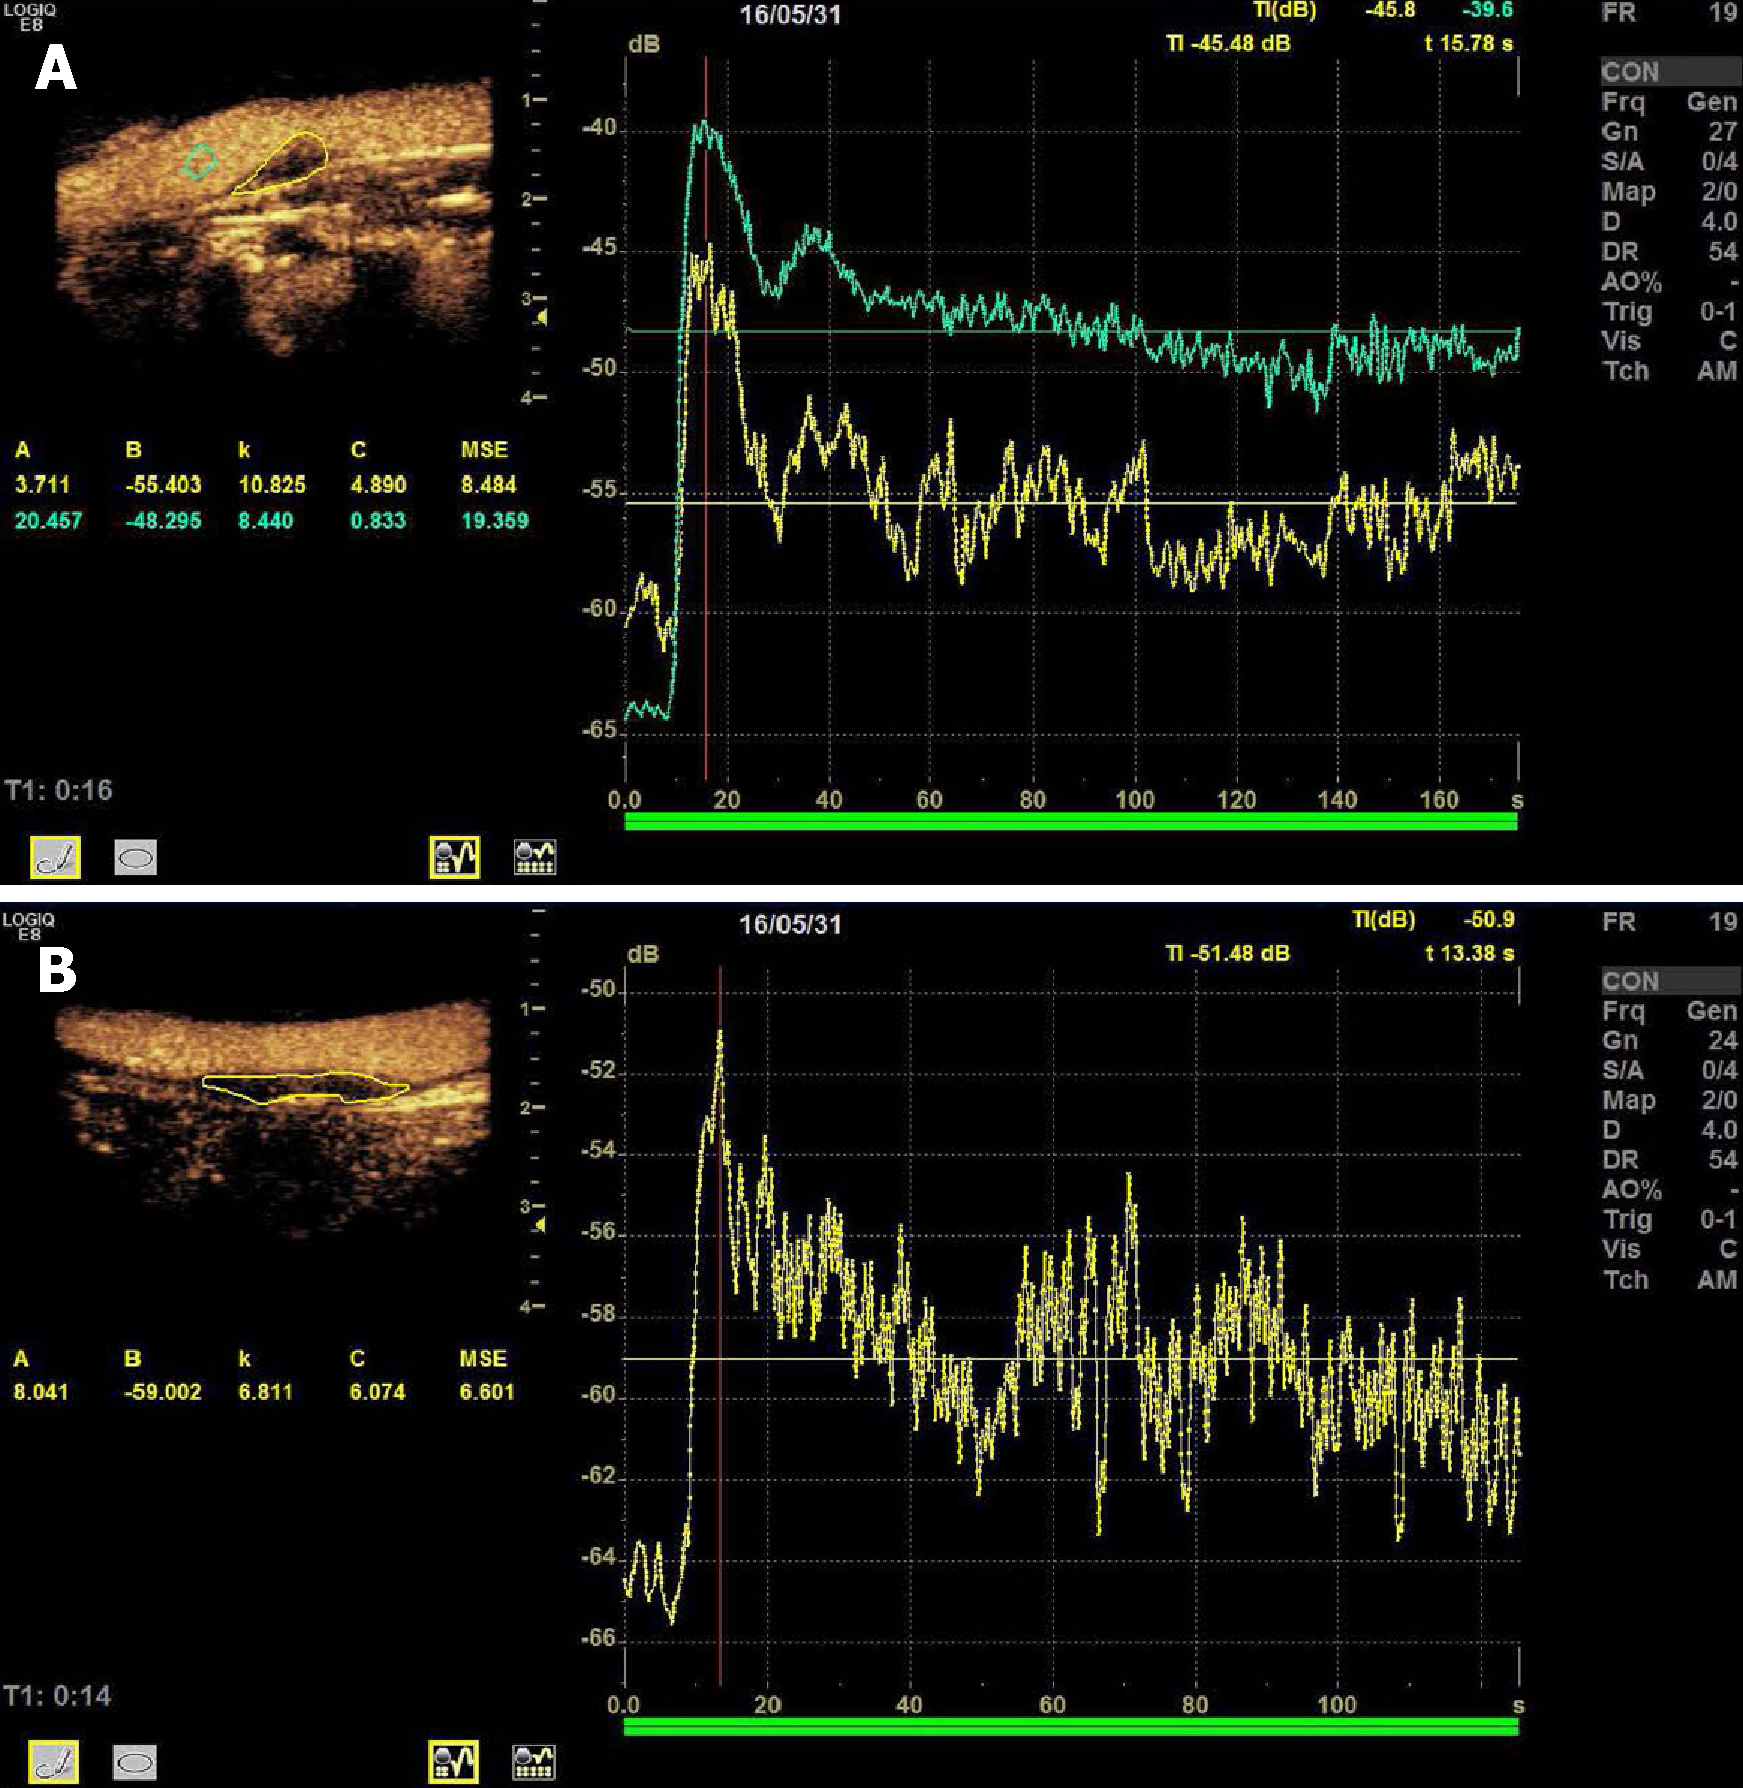
Figure 2 Carotid plaque Tic analyses.
A: Stroke patient, time-to-peak = 12.8 s, enhancement intensity = 9.6 db; B: Non-stroke patients, time-to-peak = 13.4 s, enhancement intensity = 8.1 db.
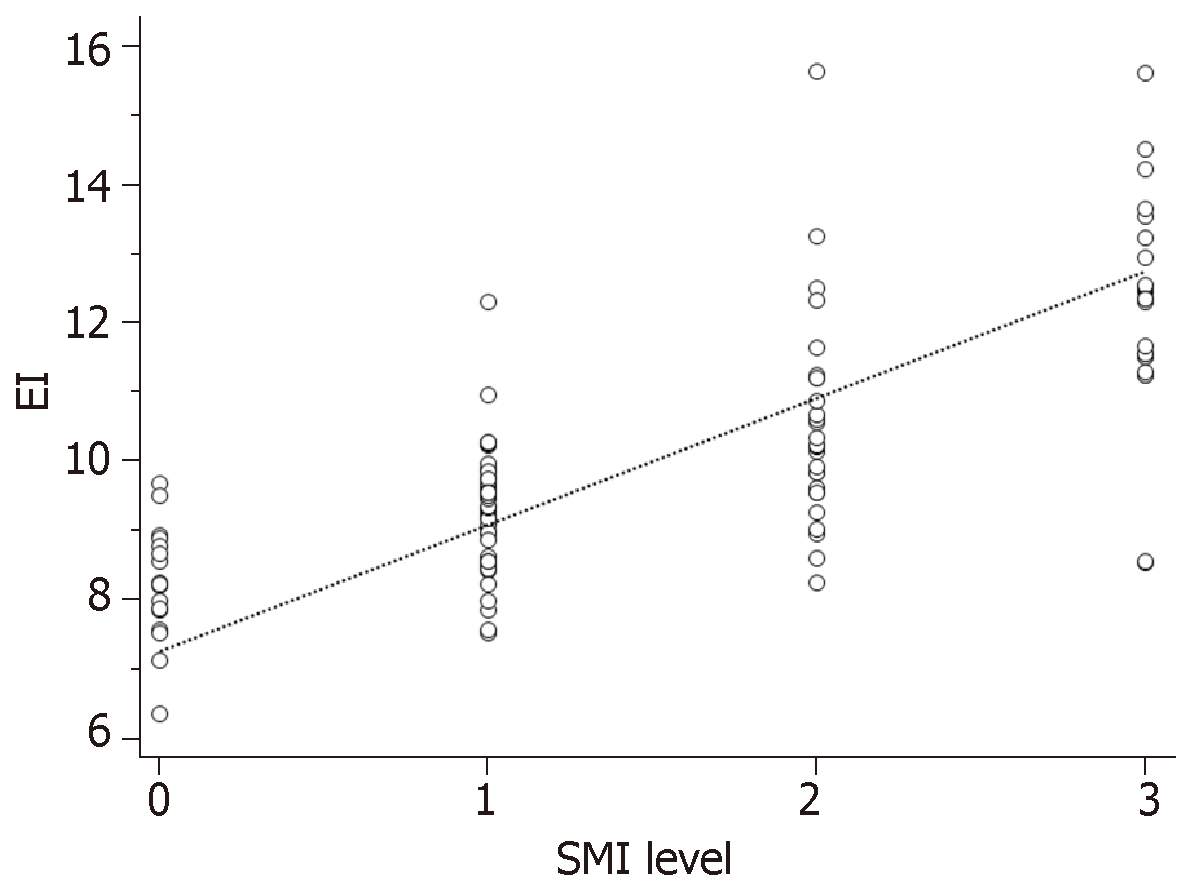
Figure 3 The correlation between superb micro-vascular imaging level and enhancement intensity.
SMI: Superb micro-vascular imaging; EI: Enhancement intensity.
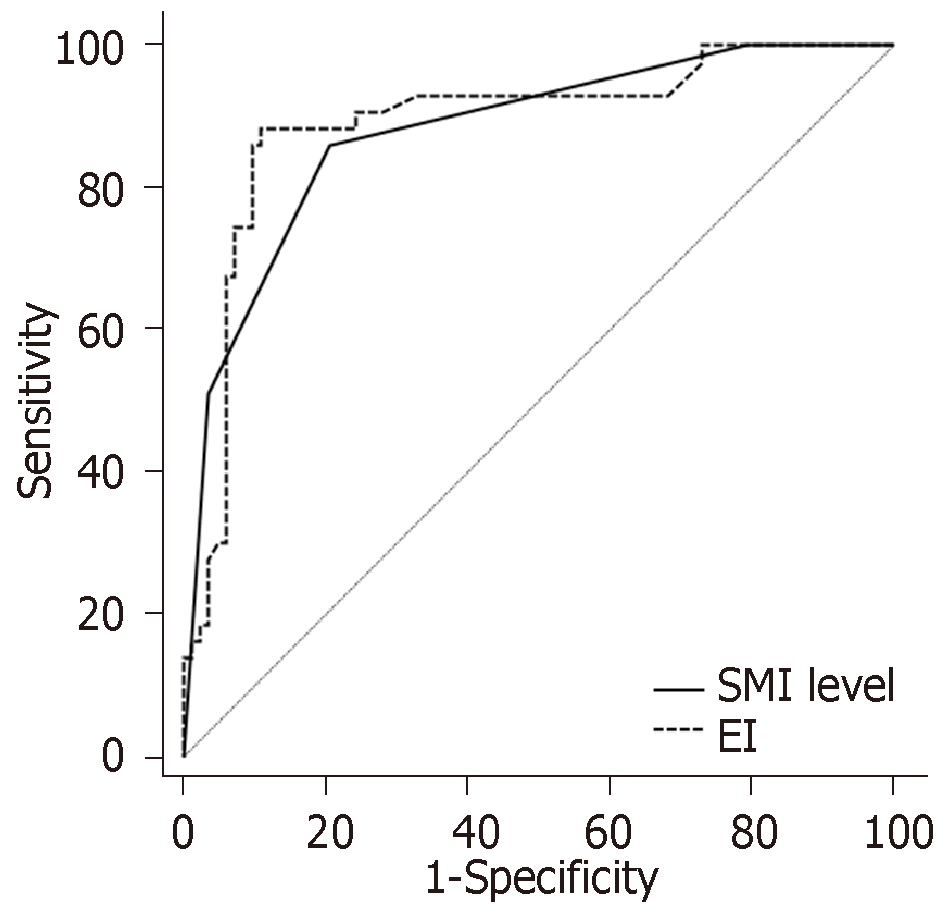
Figure 4 Receiver operating characteristic curve of ischemic stroke in patients with plaques predicted by superb micro-vascular imaging level and enhancement intensity.
SMI: Superb micro-vascular imaging; EI: Enhancement intensity.
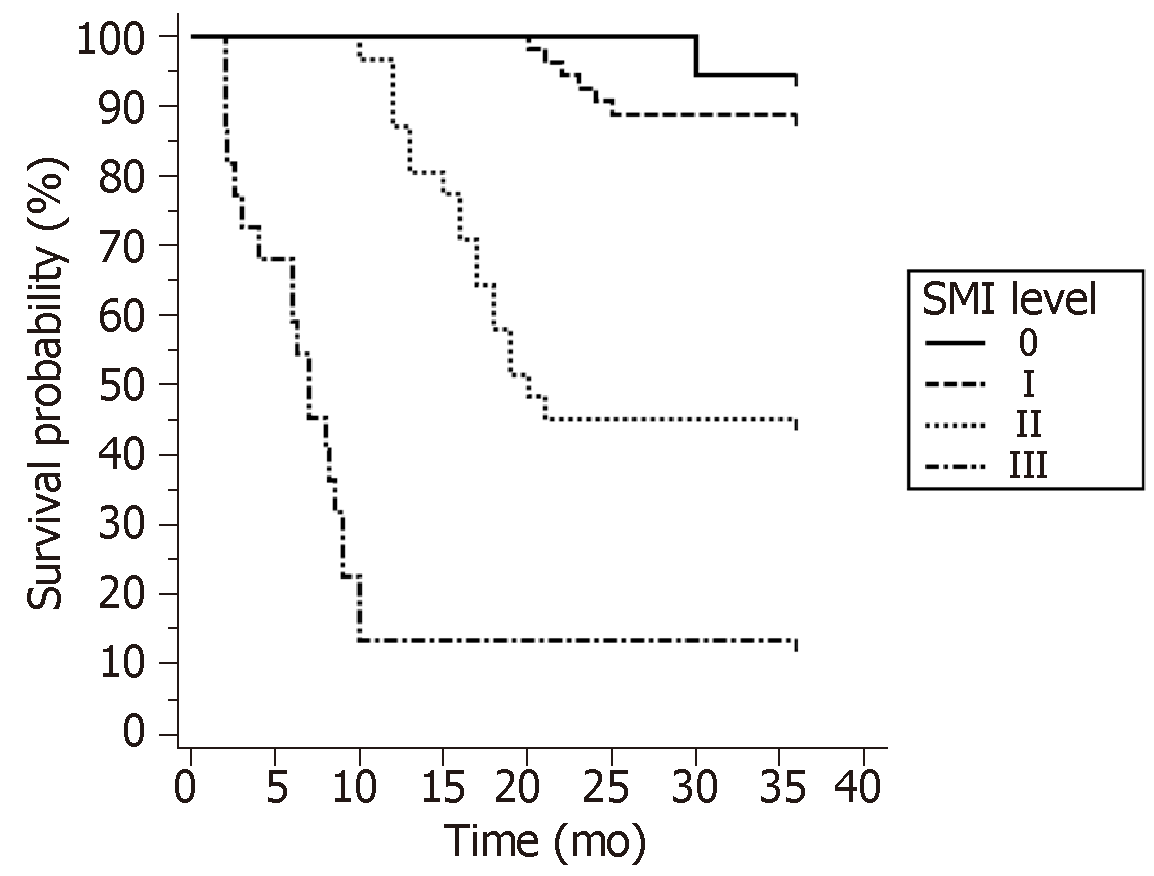
Figure 5 Survival curves of patients with ischemic stroke under different superb micro-vascular imaging levels.
SMI: Superb micro-vascular imaging.
- Citation: Yang DB, Zhou J, Feng L, Xu R, Wang YC. Value of superb micro-vascular imaging in predicting ischemic stroke in patients with carotid atherosclerotic plaques. World J Clin Cases 2019; 7(7): 839-848
- URL: https://www.wjgnet.com/2307-8960/full/v7/i7/839.htm
- DOI: https://dx.doi.org/10.12998/wjcc.v7.i7.839


