Copyright
©The Author(s) 2019.
World J Clin Cases. Feb 26, 2019; 7(4): 500-507
Published online Feb 26, 2019. doi: 10.12998/wjcc.v7.i4.500
Published online Feb 26, 2019. doi: 10.12998/wjcc.v7.i4.500
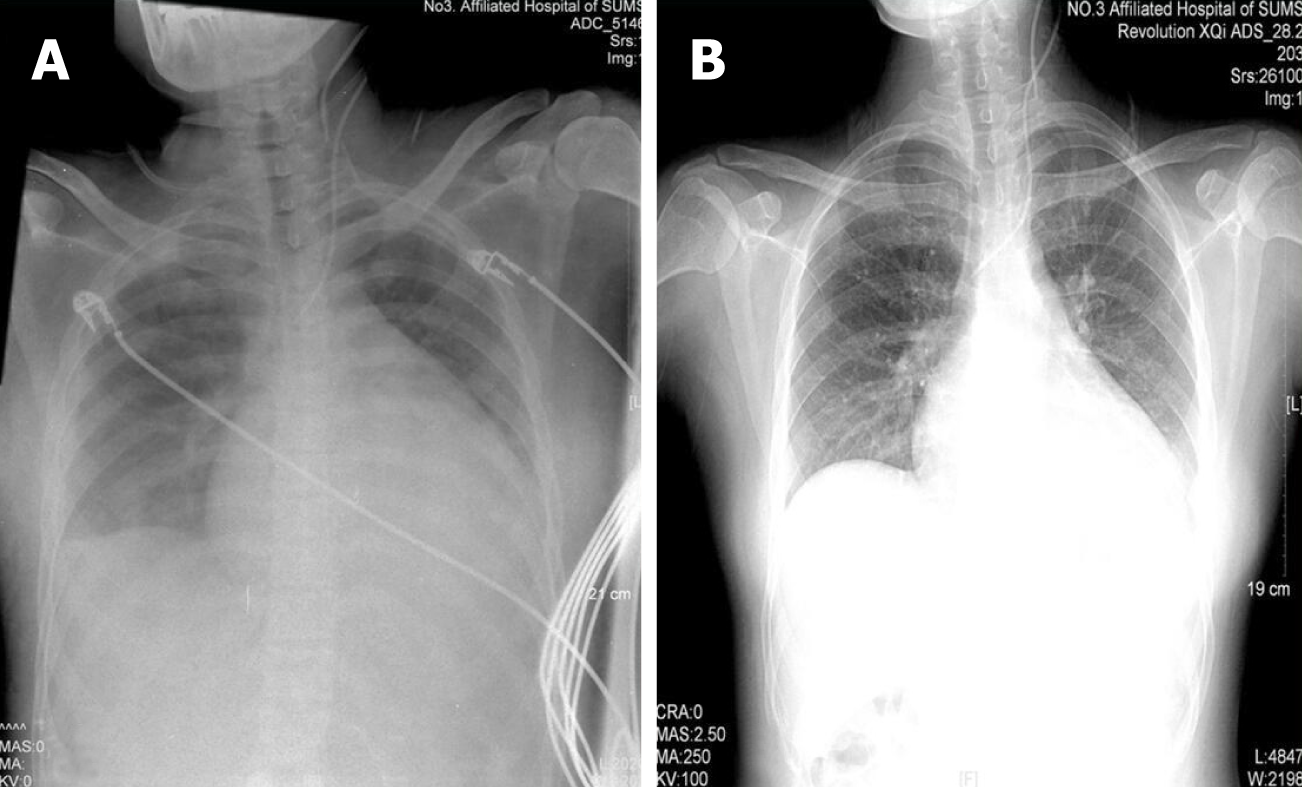
Figure 1 Chest X-ray.
Comparison between the chest X-ray films at admission (left panel) and after treatment (right panel). A: chest X-ray films at admission; B: Chest X-ray films after treatment.
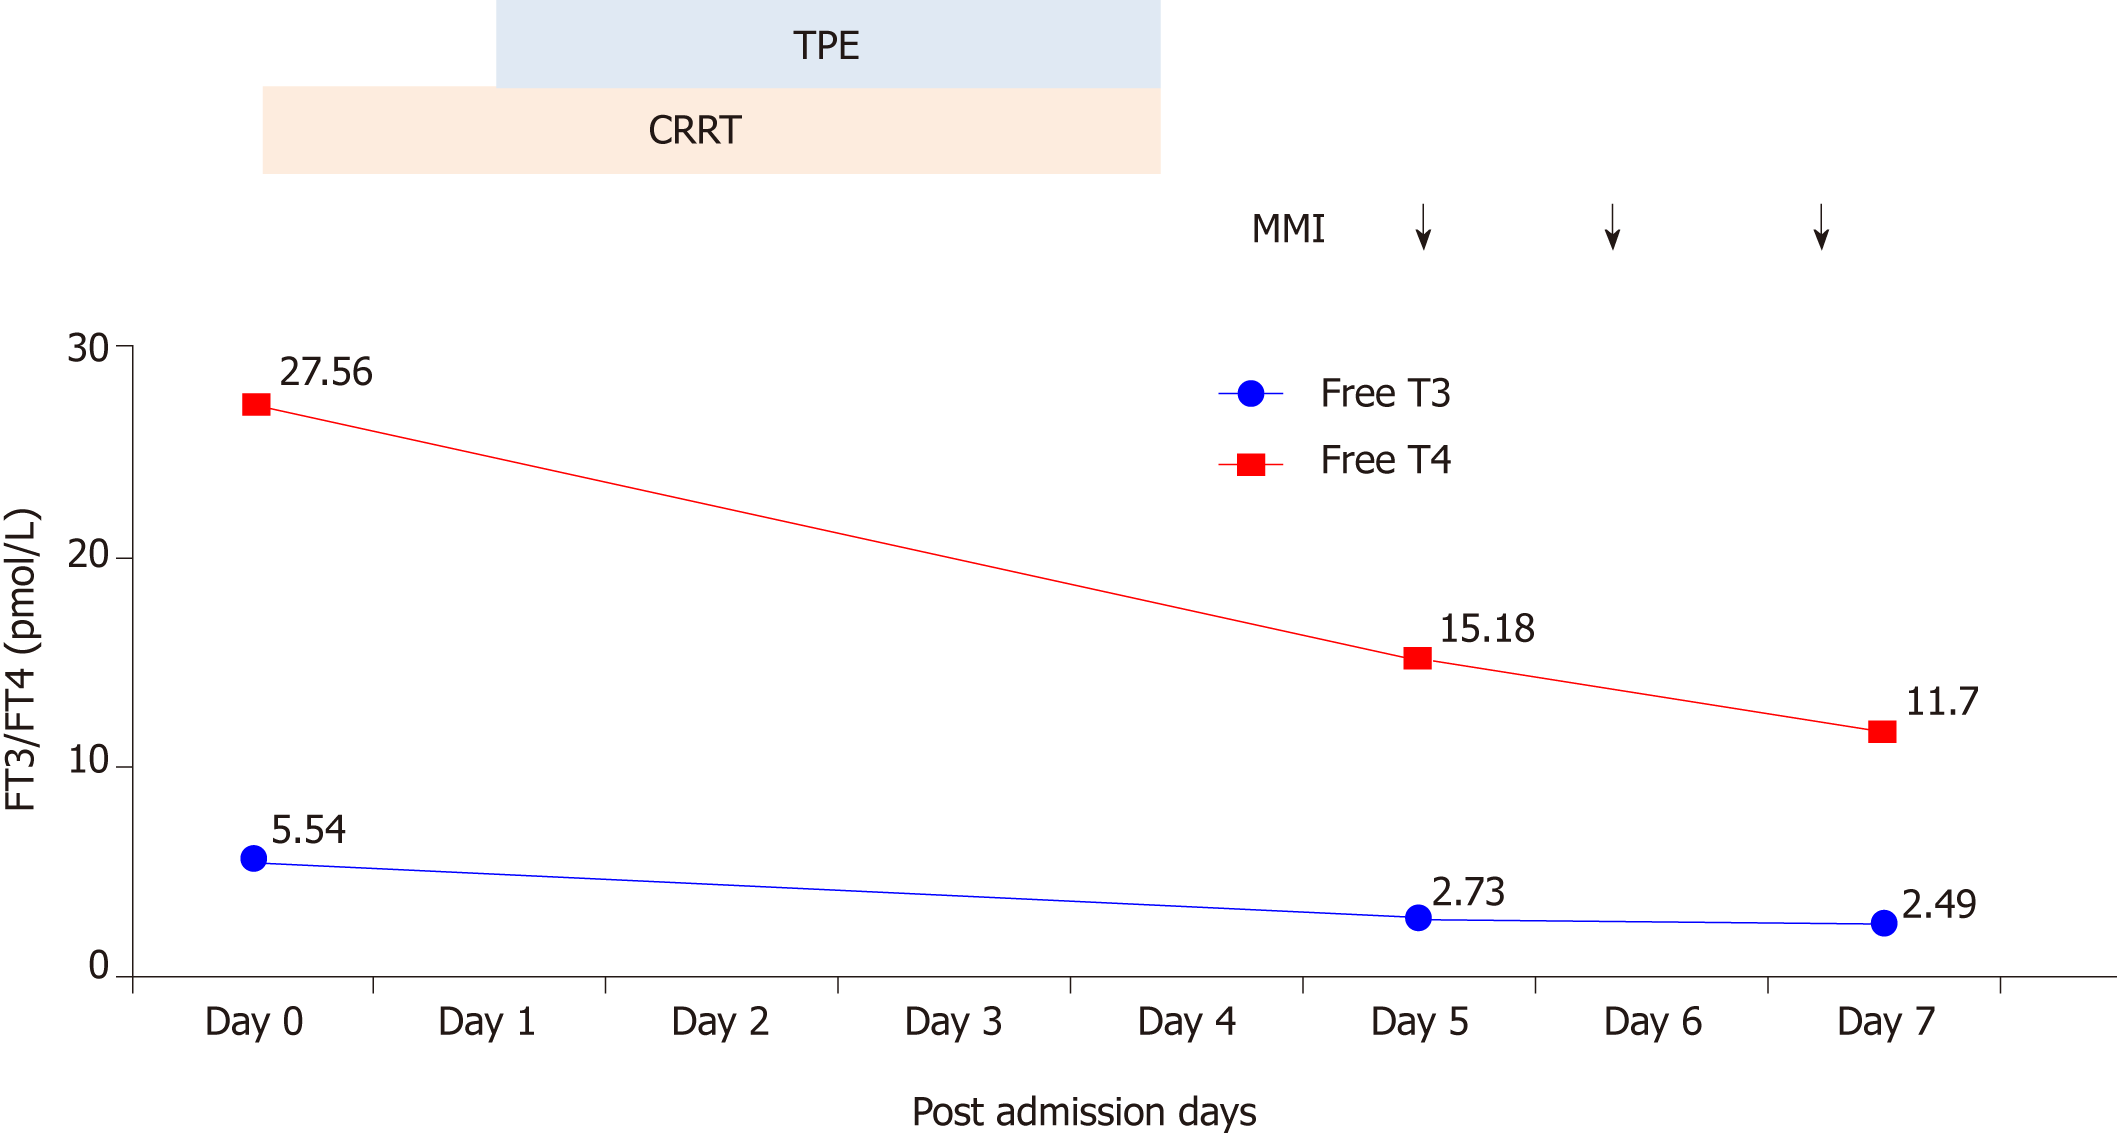
Figure 2 Changes in FT3 and FT4 during treatment.
The gray and orange shadows showed when TPE and CRRT were carried out. The arrows indicate when MMI was administered. TPE: Therapeutic plasma exchange; CRRT: Continuous renal replacement therapy; MMI: Methimazole; FT3: Free tri-iodothyronine; FT4: Free thyroxin.
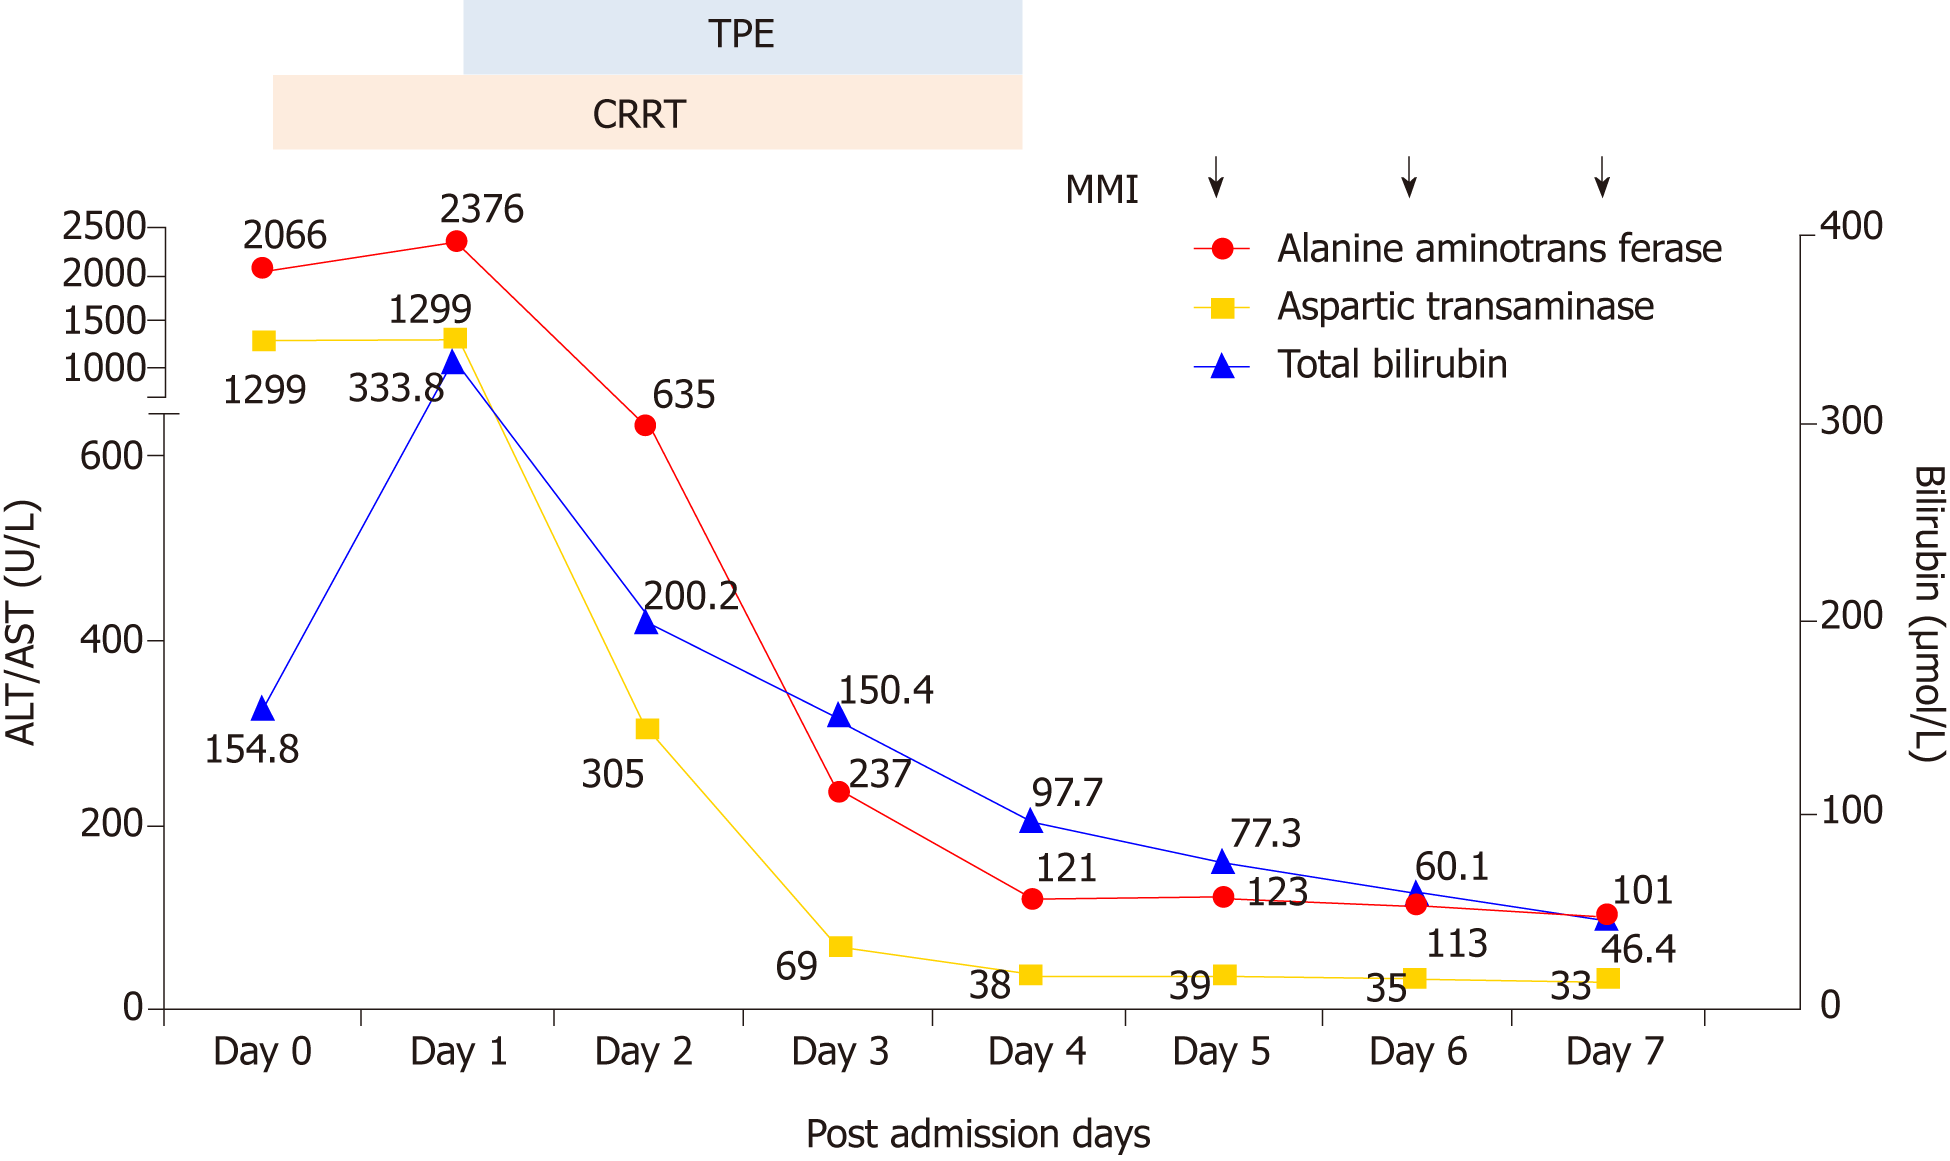
Figure 3 Changes in liver function during treatment.
The gray and orange shadows show when TPE and CRRT were carried out. The arrows indicate when MMI was administered. The levels of ALT, AST and TB declined progressively. TPE: Therapeutic plasma exchange; CRRT: Continuous renal replacement therapy; MMI: Methimazole; ALT: Alanine aminotransferase; AST: Aspartate aminotransferase; TB: Total bilirubin.
- Citation: Ba JH, Wu BQ, Wang YH, Shi YF. Therapeutic plasma exchange and continuous renal replacement therapy for severe hyperthyroidism and multi-organ failure: A case report. World J Clin Cases 2019; 7(4): 500-507
- URL: https://www.wjgnet.com/2307-8960/full/v7/i4/500.htm
- DOI: https://dx.doi.org/10.12998/wjcc.v7.i4.500


