Copyright
©The Author(s) 2019.
World J Clin Cases. Feb 6, 2019; 7(3): 320-334
Published online Feb 6, 2019. doi: 10.12998/wjcc.v7.i3.320
Published online Feb 6, 2019. doi: 10.12998/wjcc.v7.i3.320
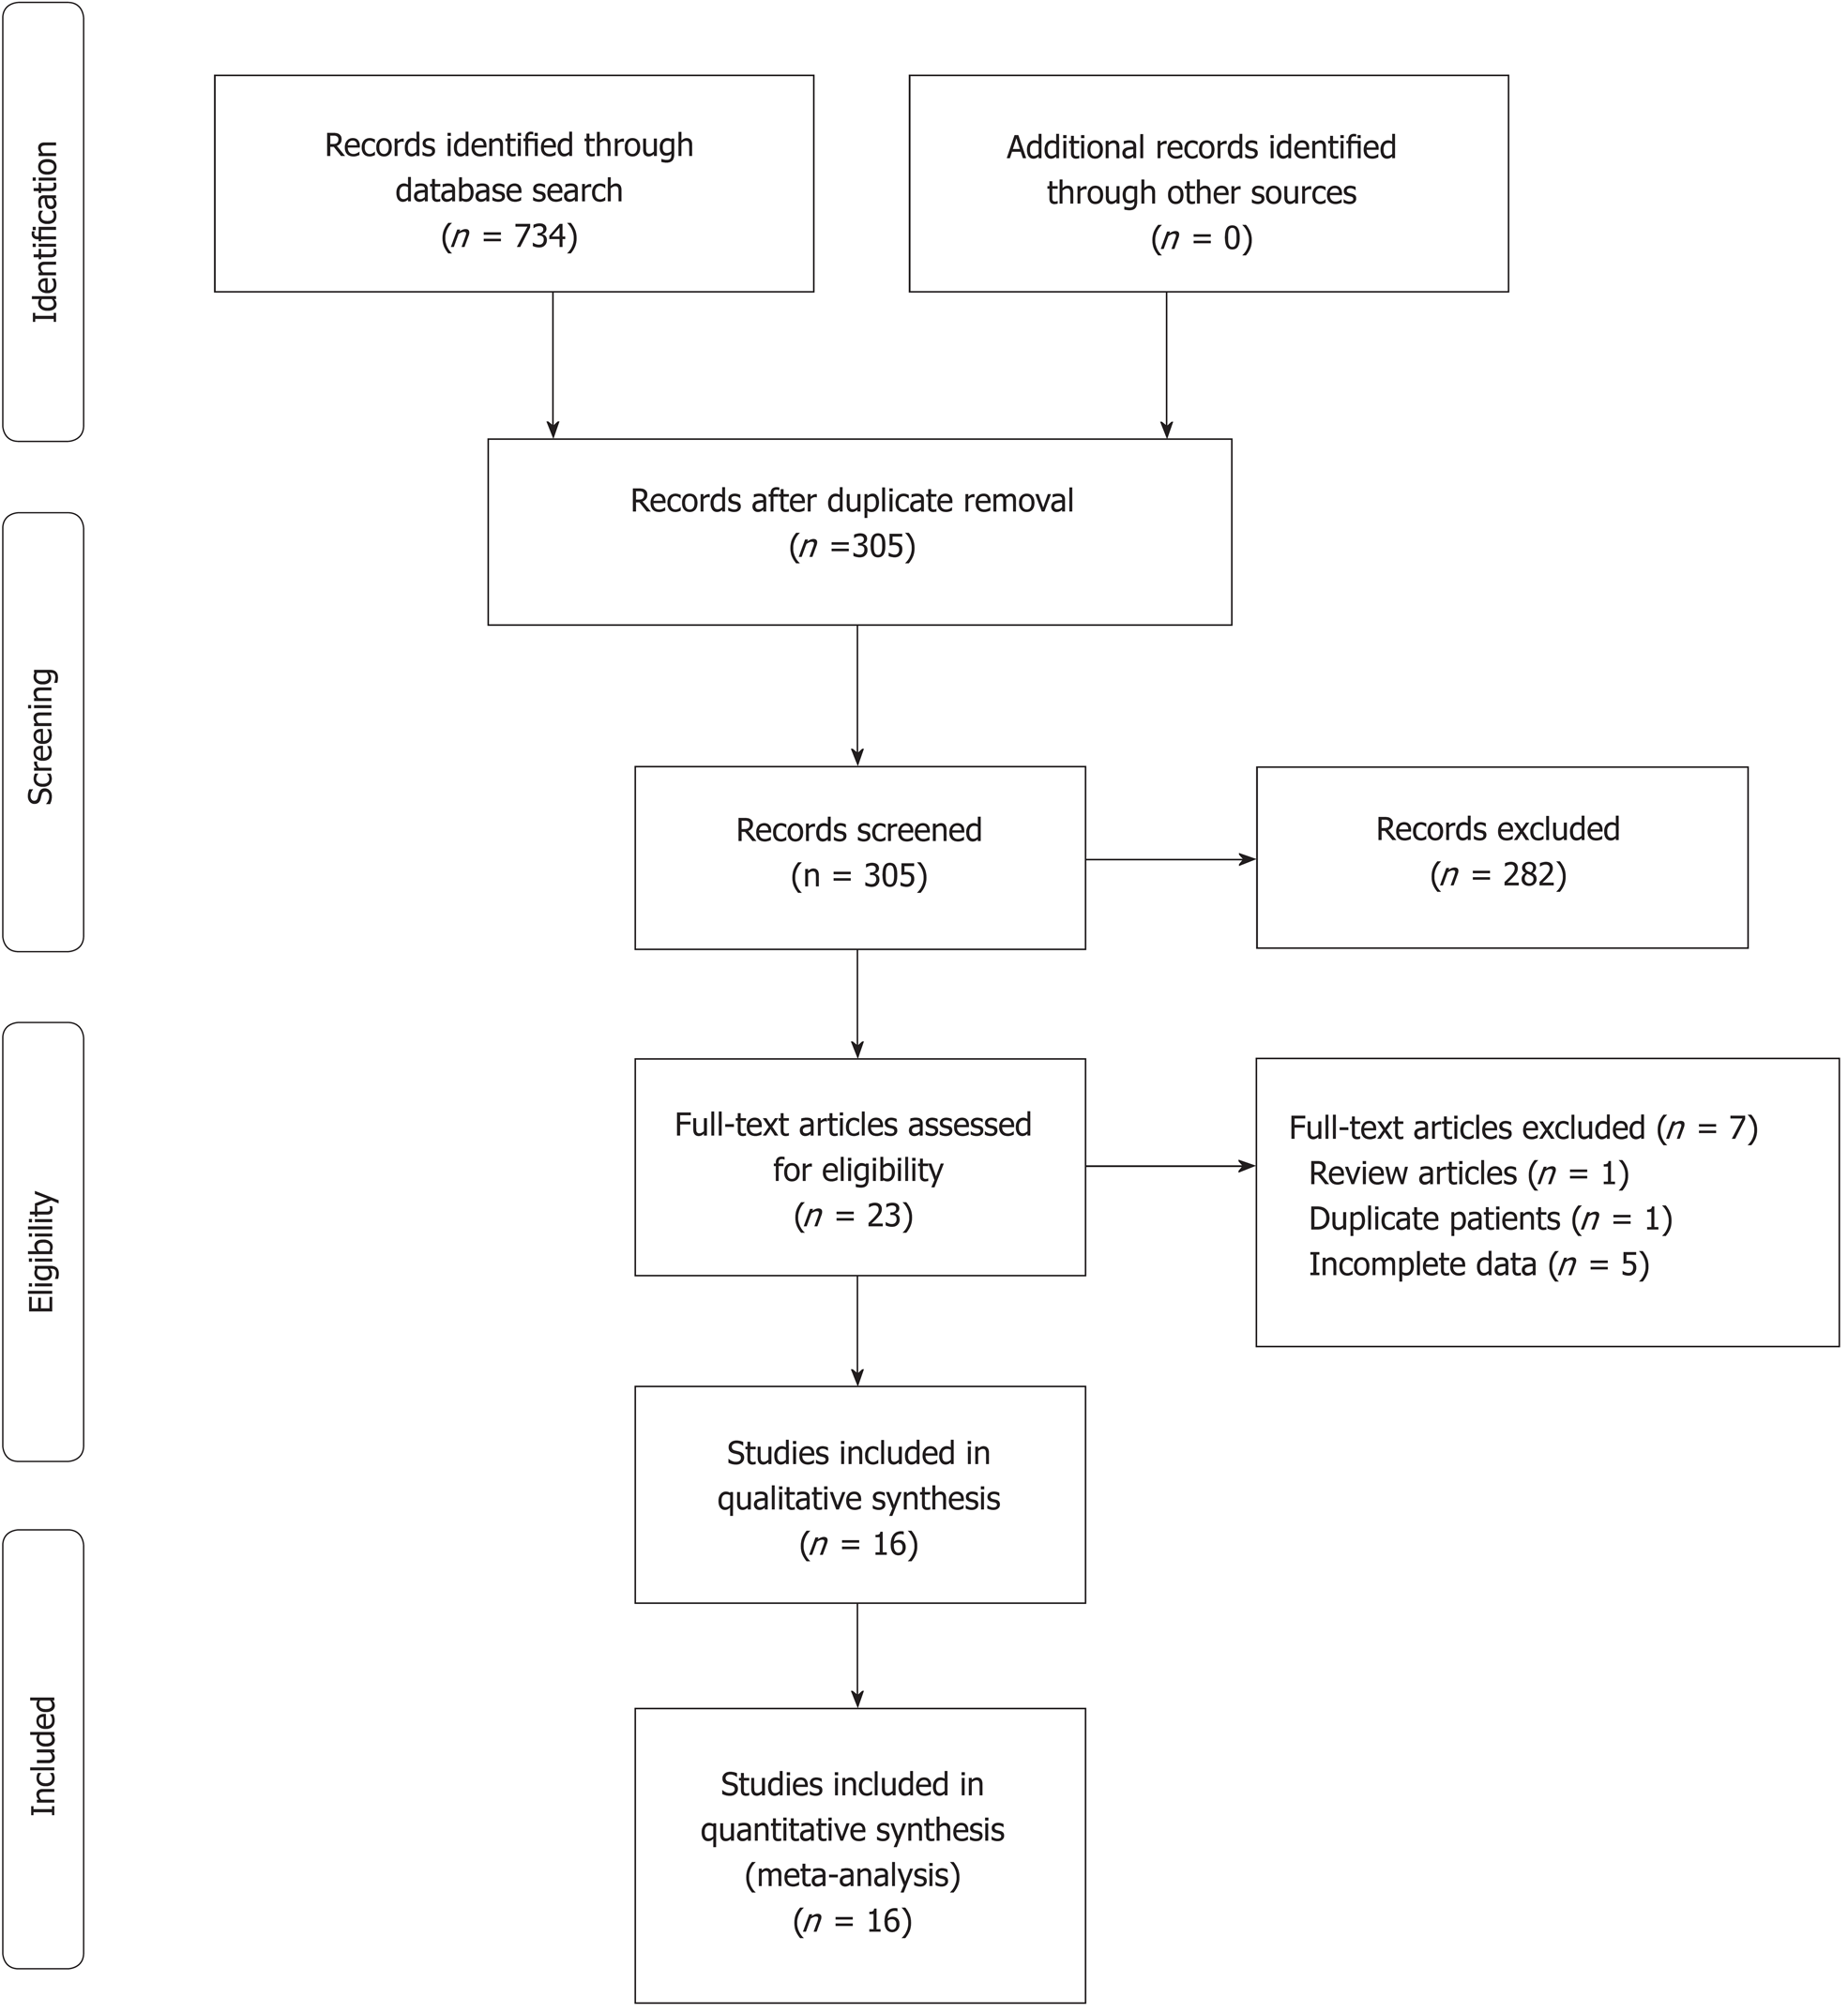
Figure 1 Flow diagram of study selection.
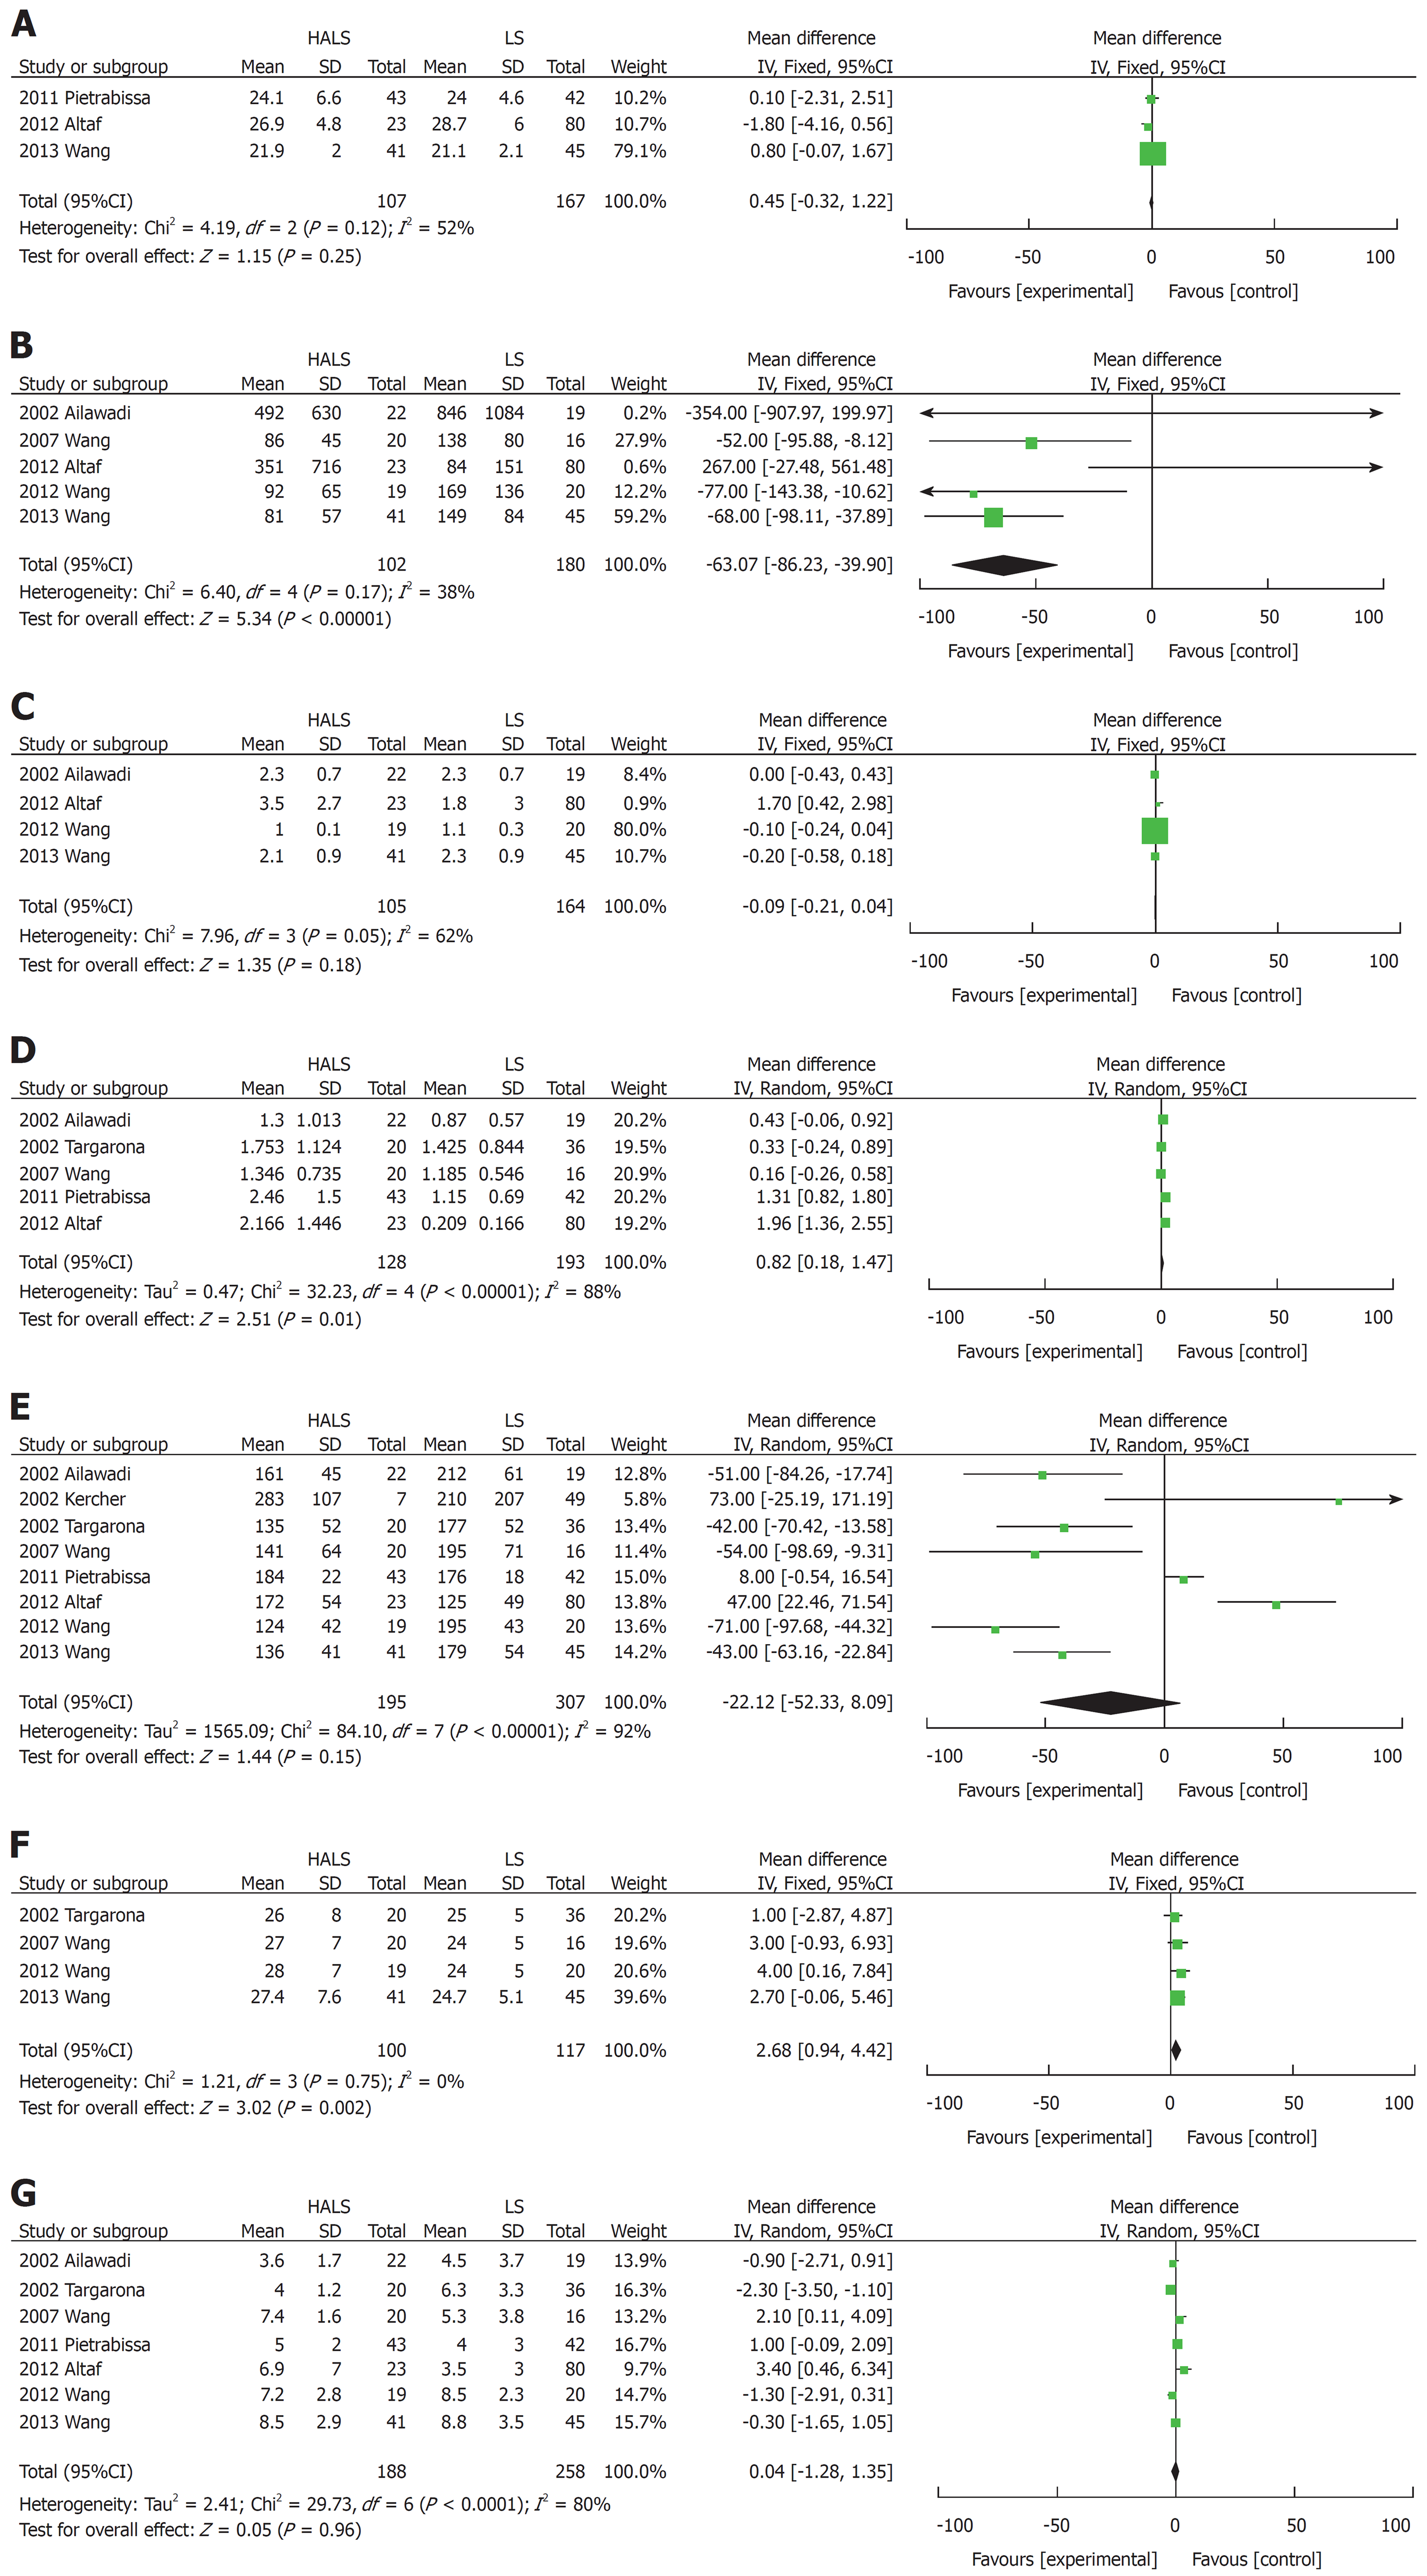
Figure 2 Forest plots of meta-analysis for pure splenectomy.
The BMI (A), blood loss volume (B), time to food intake (C), splenic weight (D), operative time (E), maximum diameter (F), and hospital stay length (G). HALS: Hand-assisted laparoscopic splenectomy; LS: Laparoscopic splenectomy.
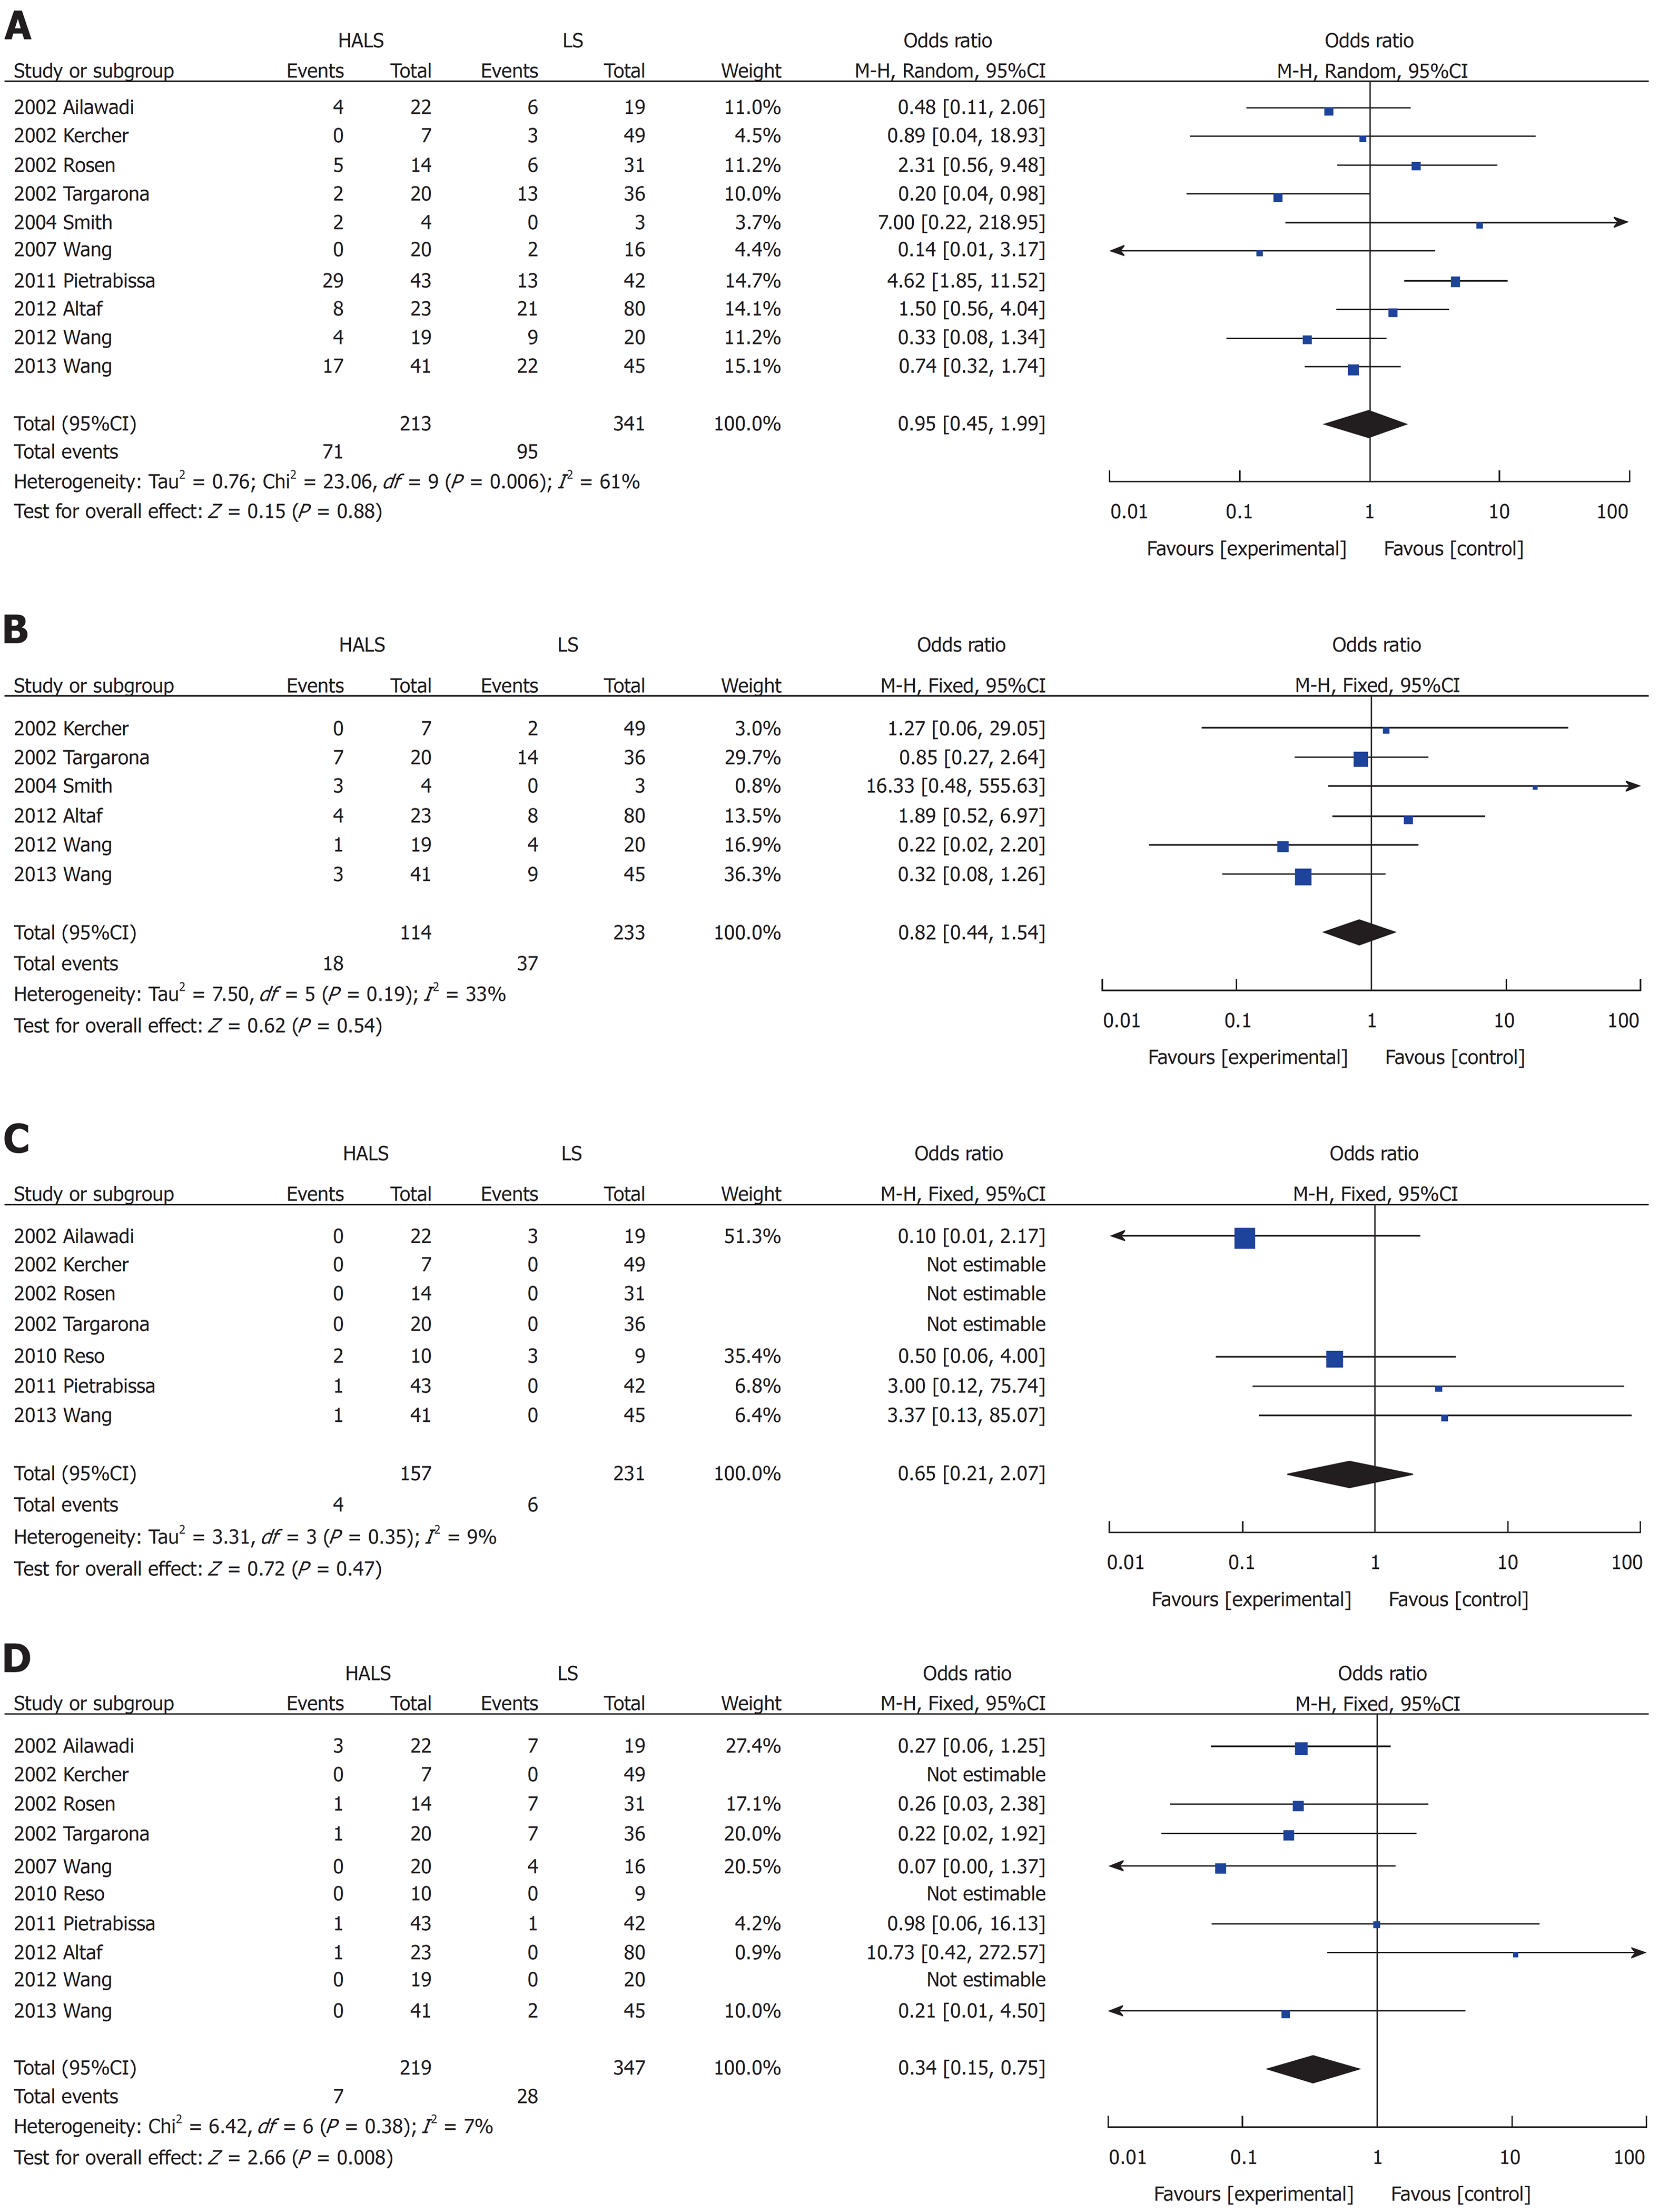
Figure 3 Forest plots of meta-analysis for pure splenectomy.
Complications (A), blood transfusion (B), mortality rate (C), and conversion rate (D). HALS: Hand-assisted laparoscopic splenectomy; LS: Laparoscopic splenectomy.
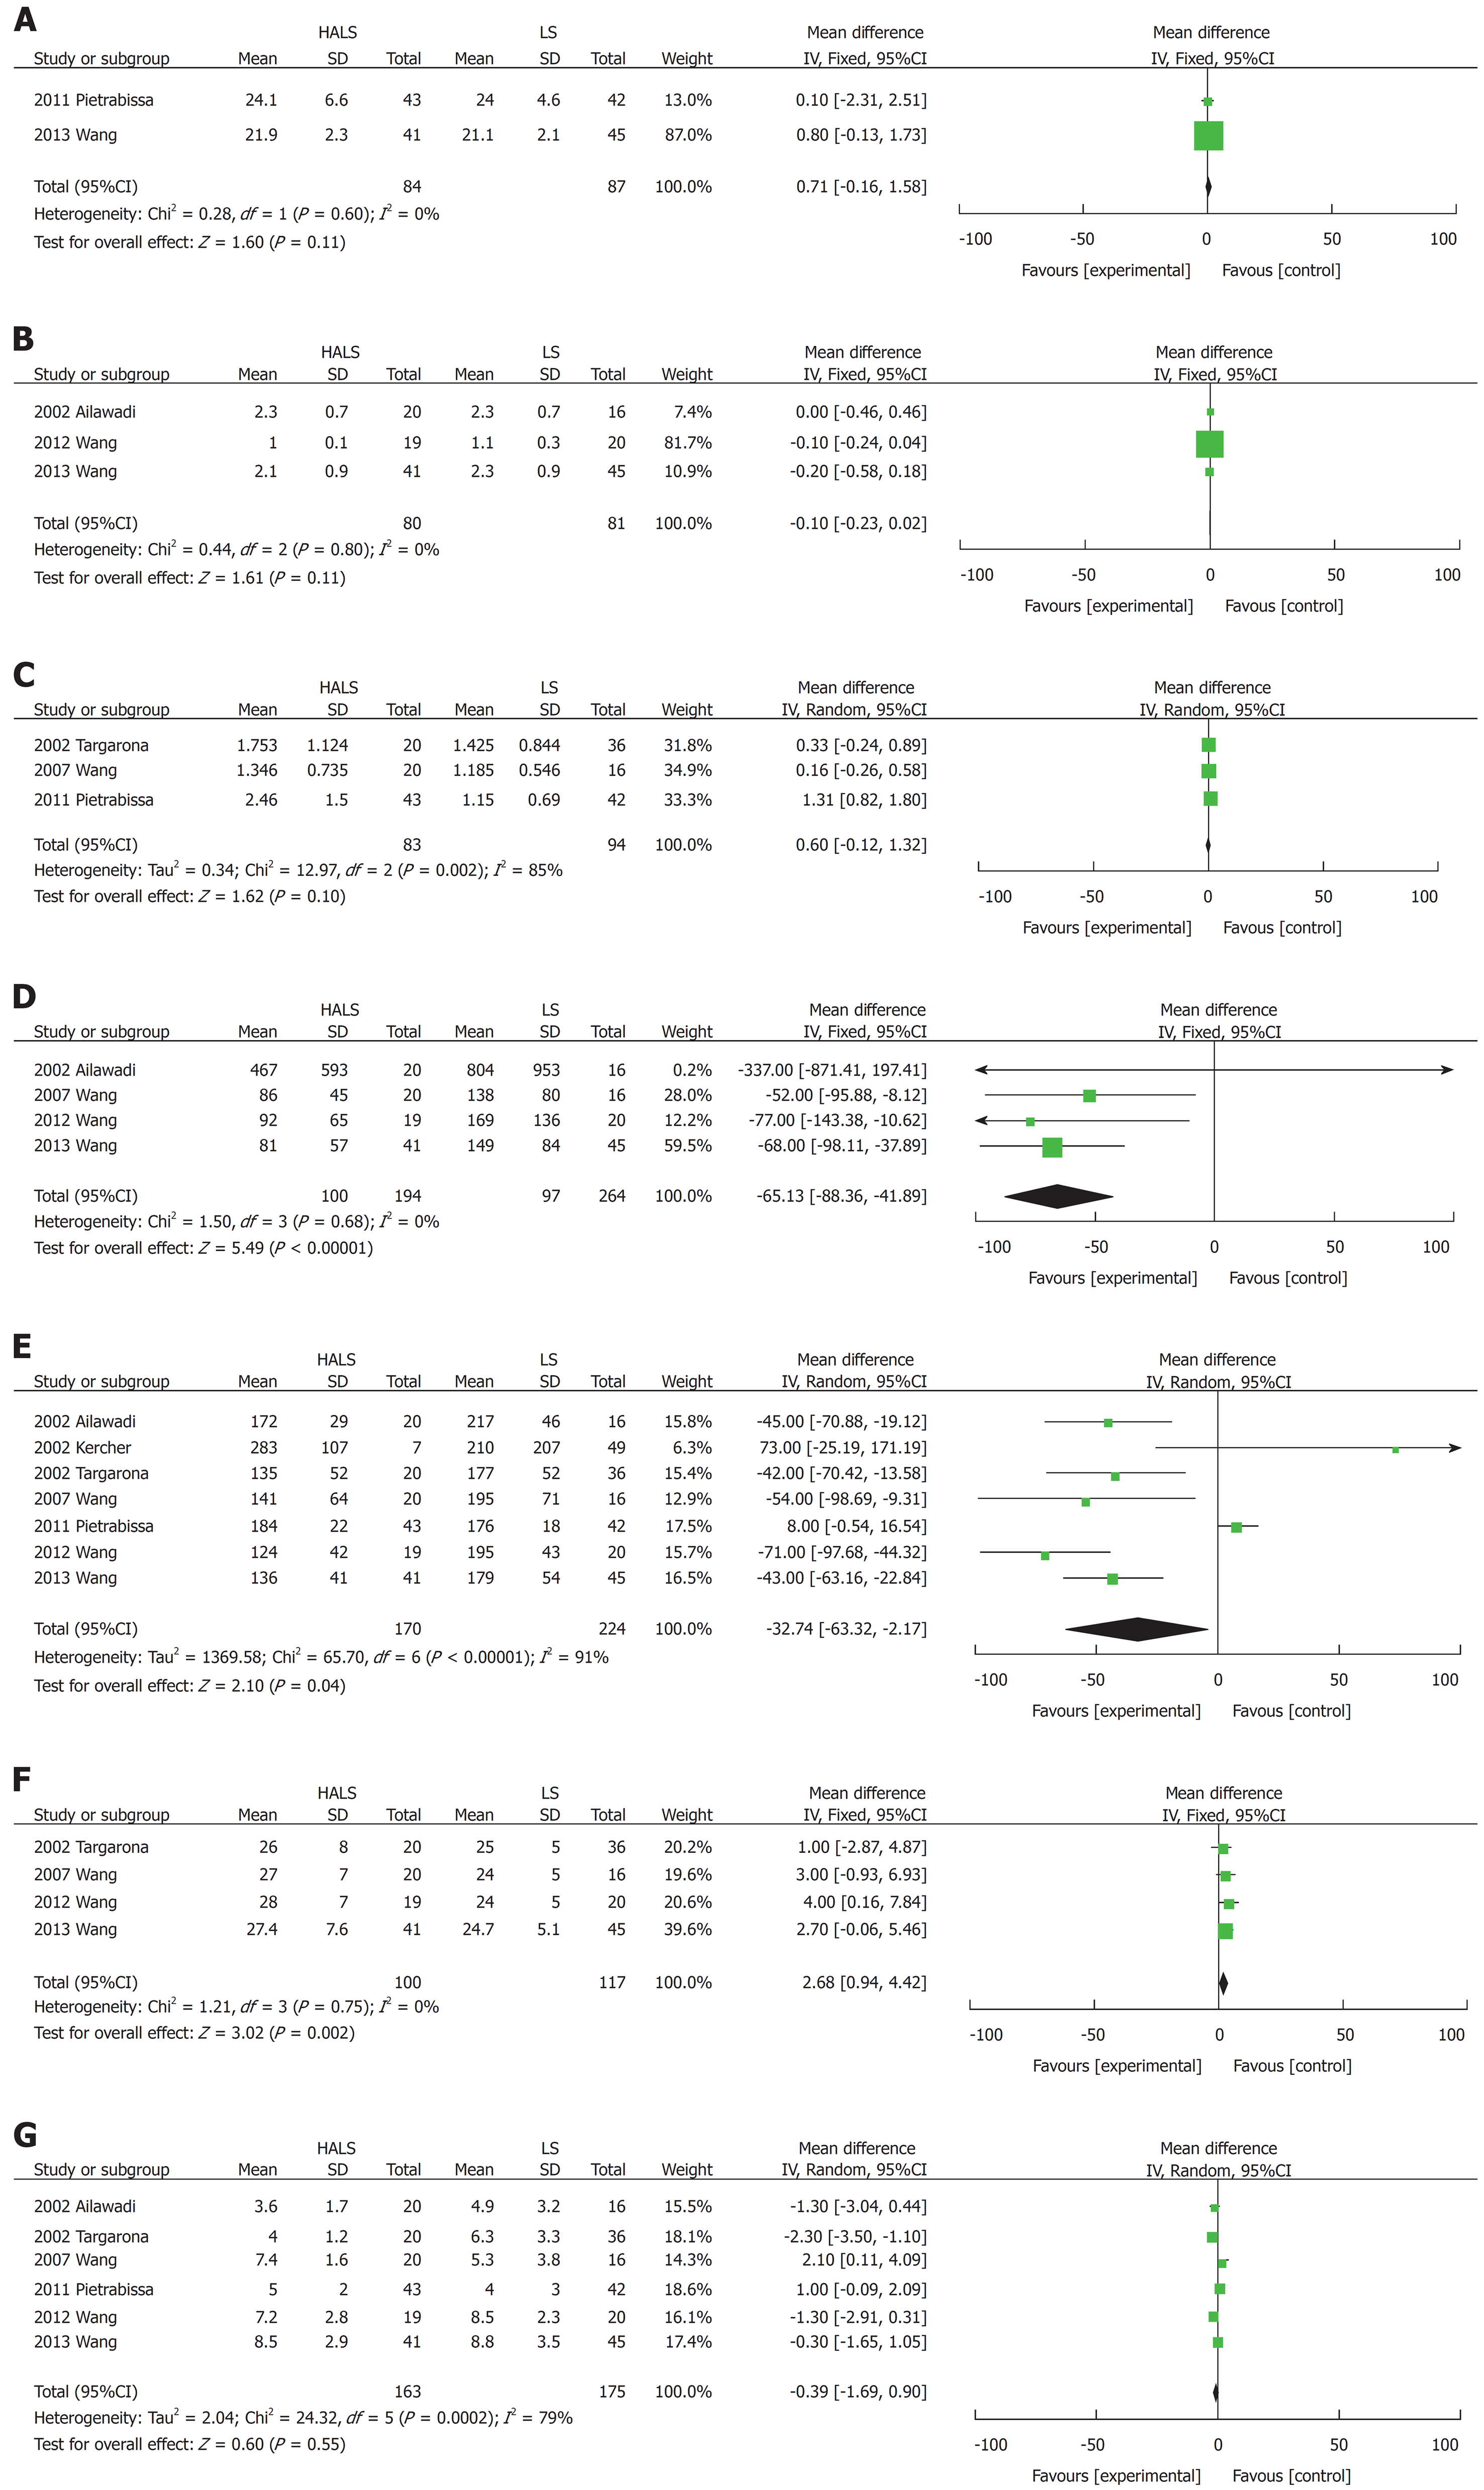
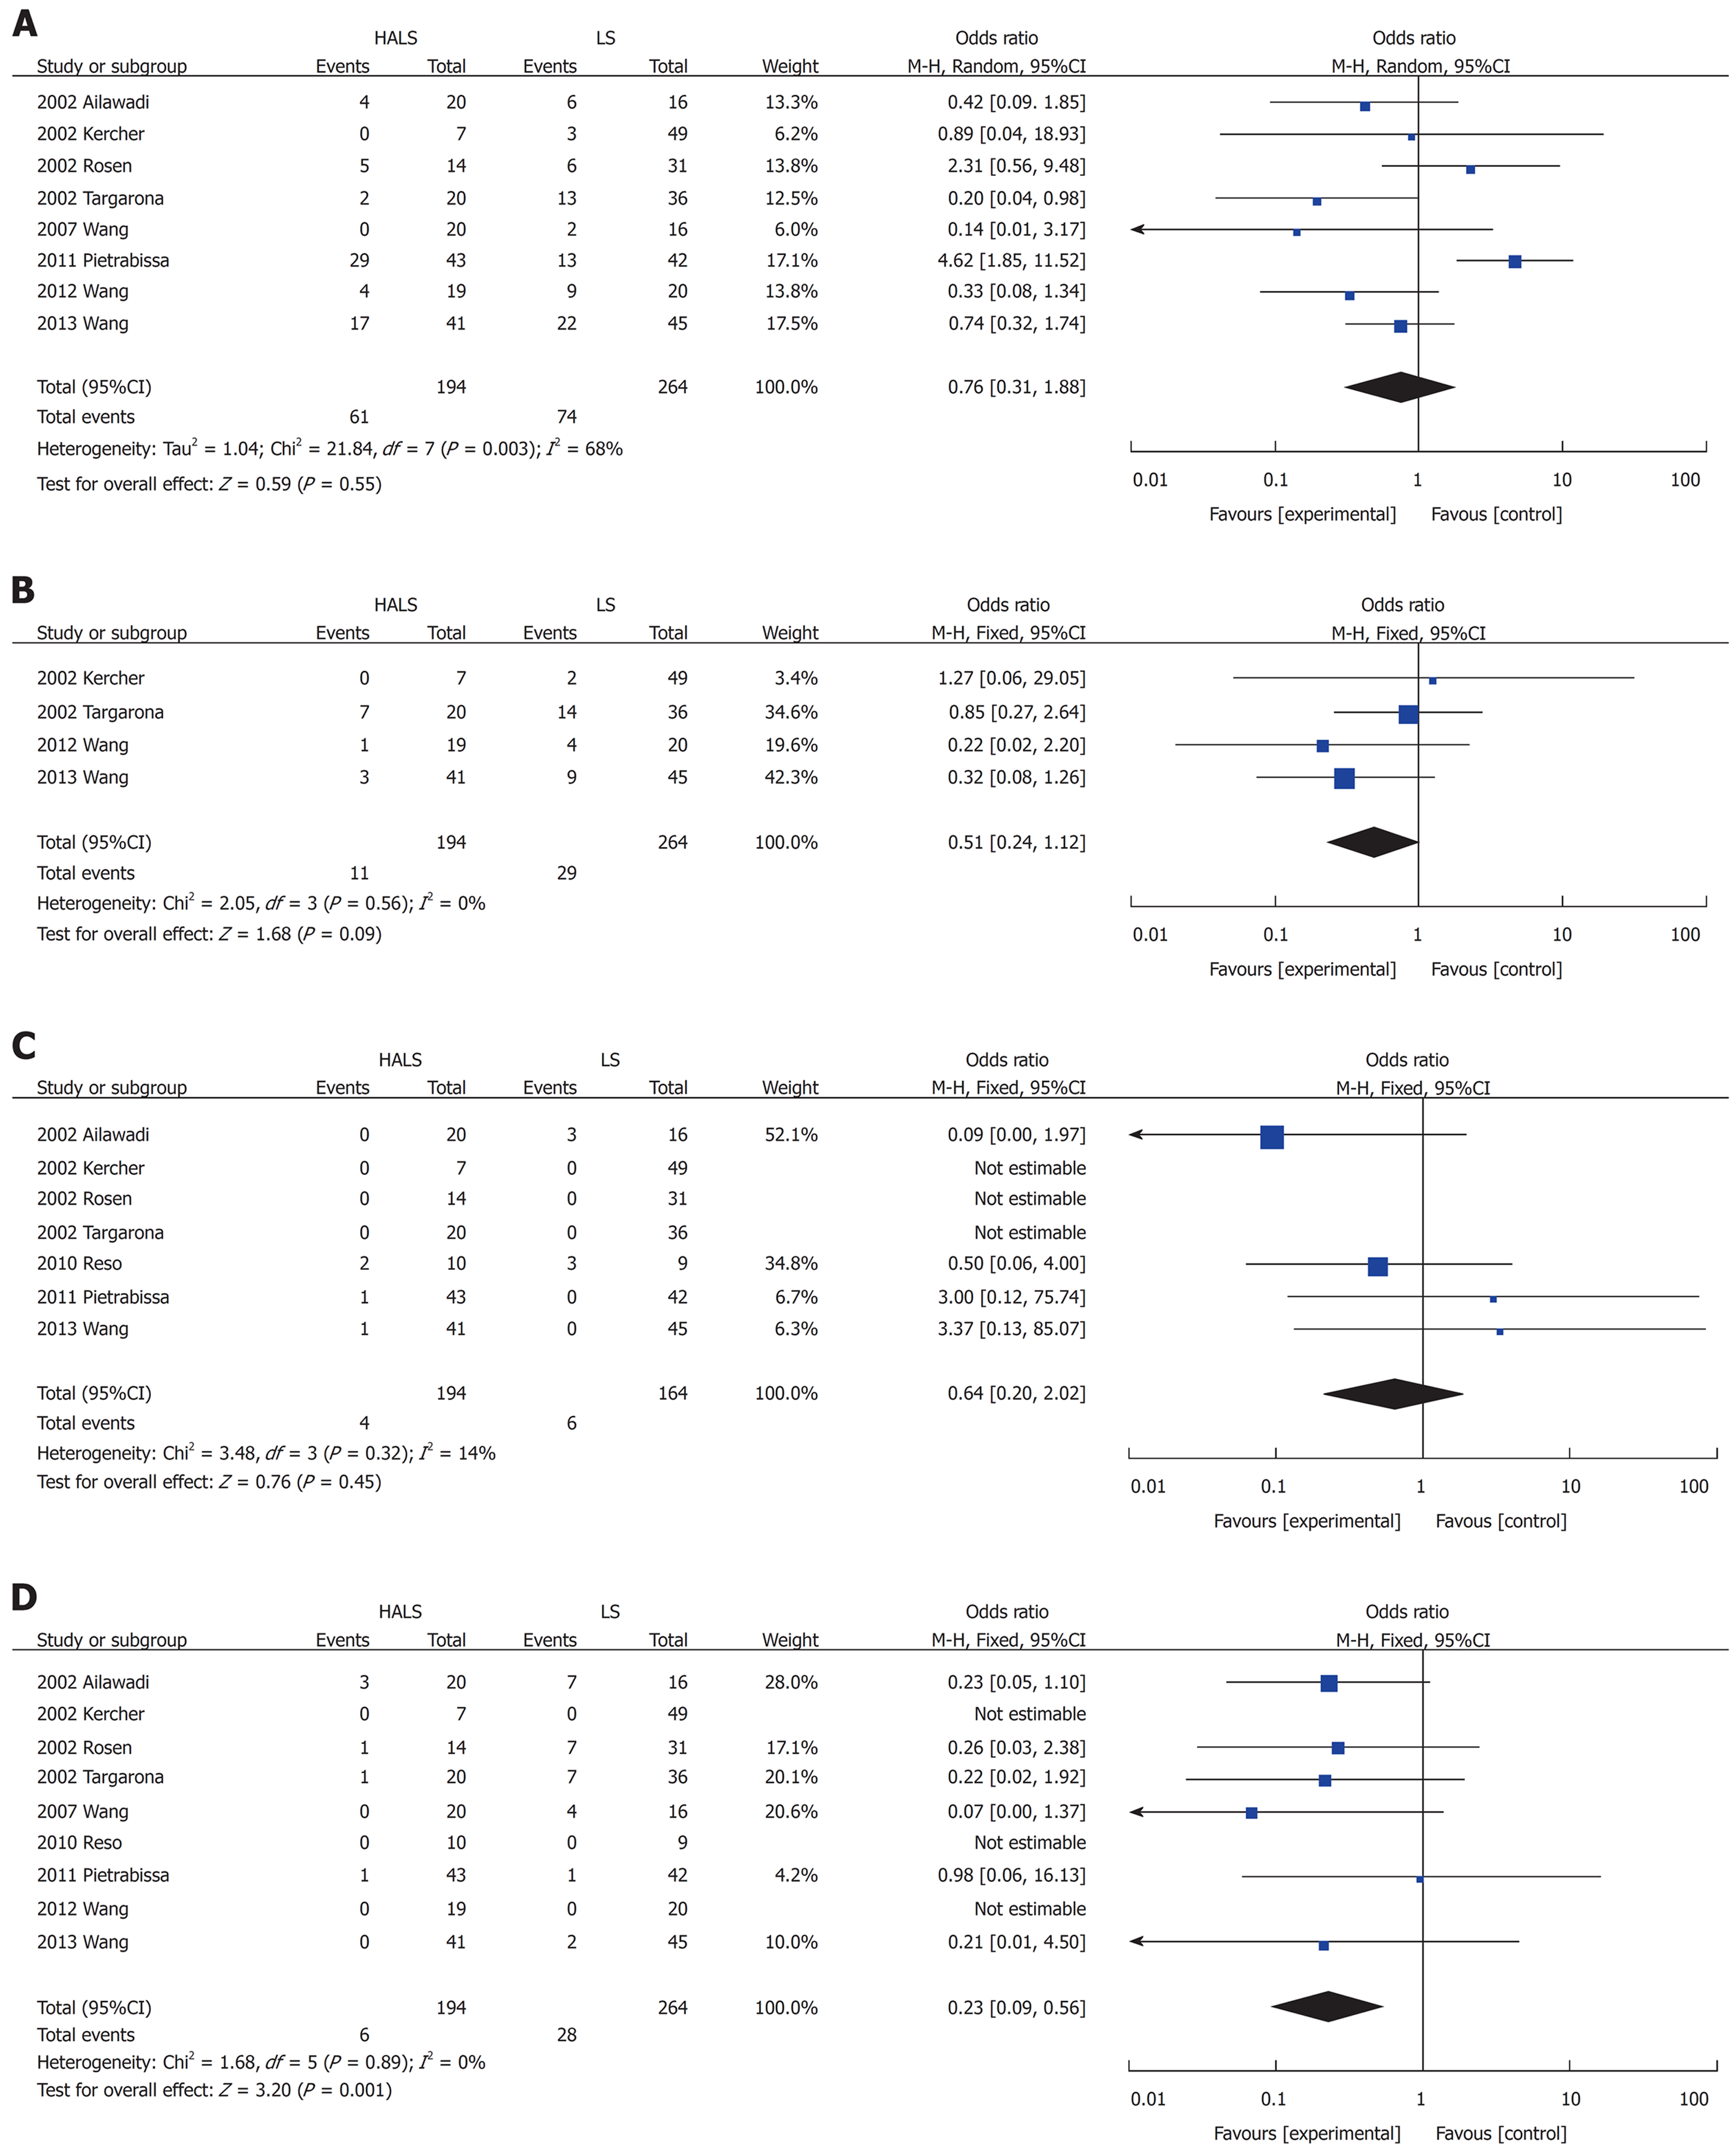
Figure 4 Forest plots of meta-analysis for splenomegaly.
The BMI (A), time to food intake (B), splenic weight (C), blood loss volume (D), operative time (E), maximum diameter (F), and hospital stay length (G). HALS: Hand-assisted laparoscopic splenectomy; LS: Laparoscopic splenectomy.
Figure 5 Forest plots of meta-analysis for splenomegaly.
Complications (A), blood transfusion (B), mortality (C), and conversion rate (D). HALS: Hand-assisted laparoscopic splenectomy; LS: Laparoscopic splenectomy.
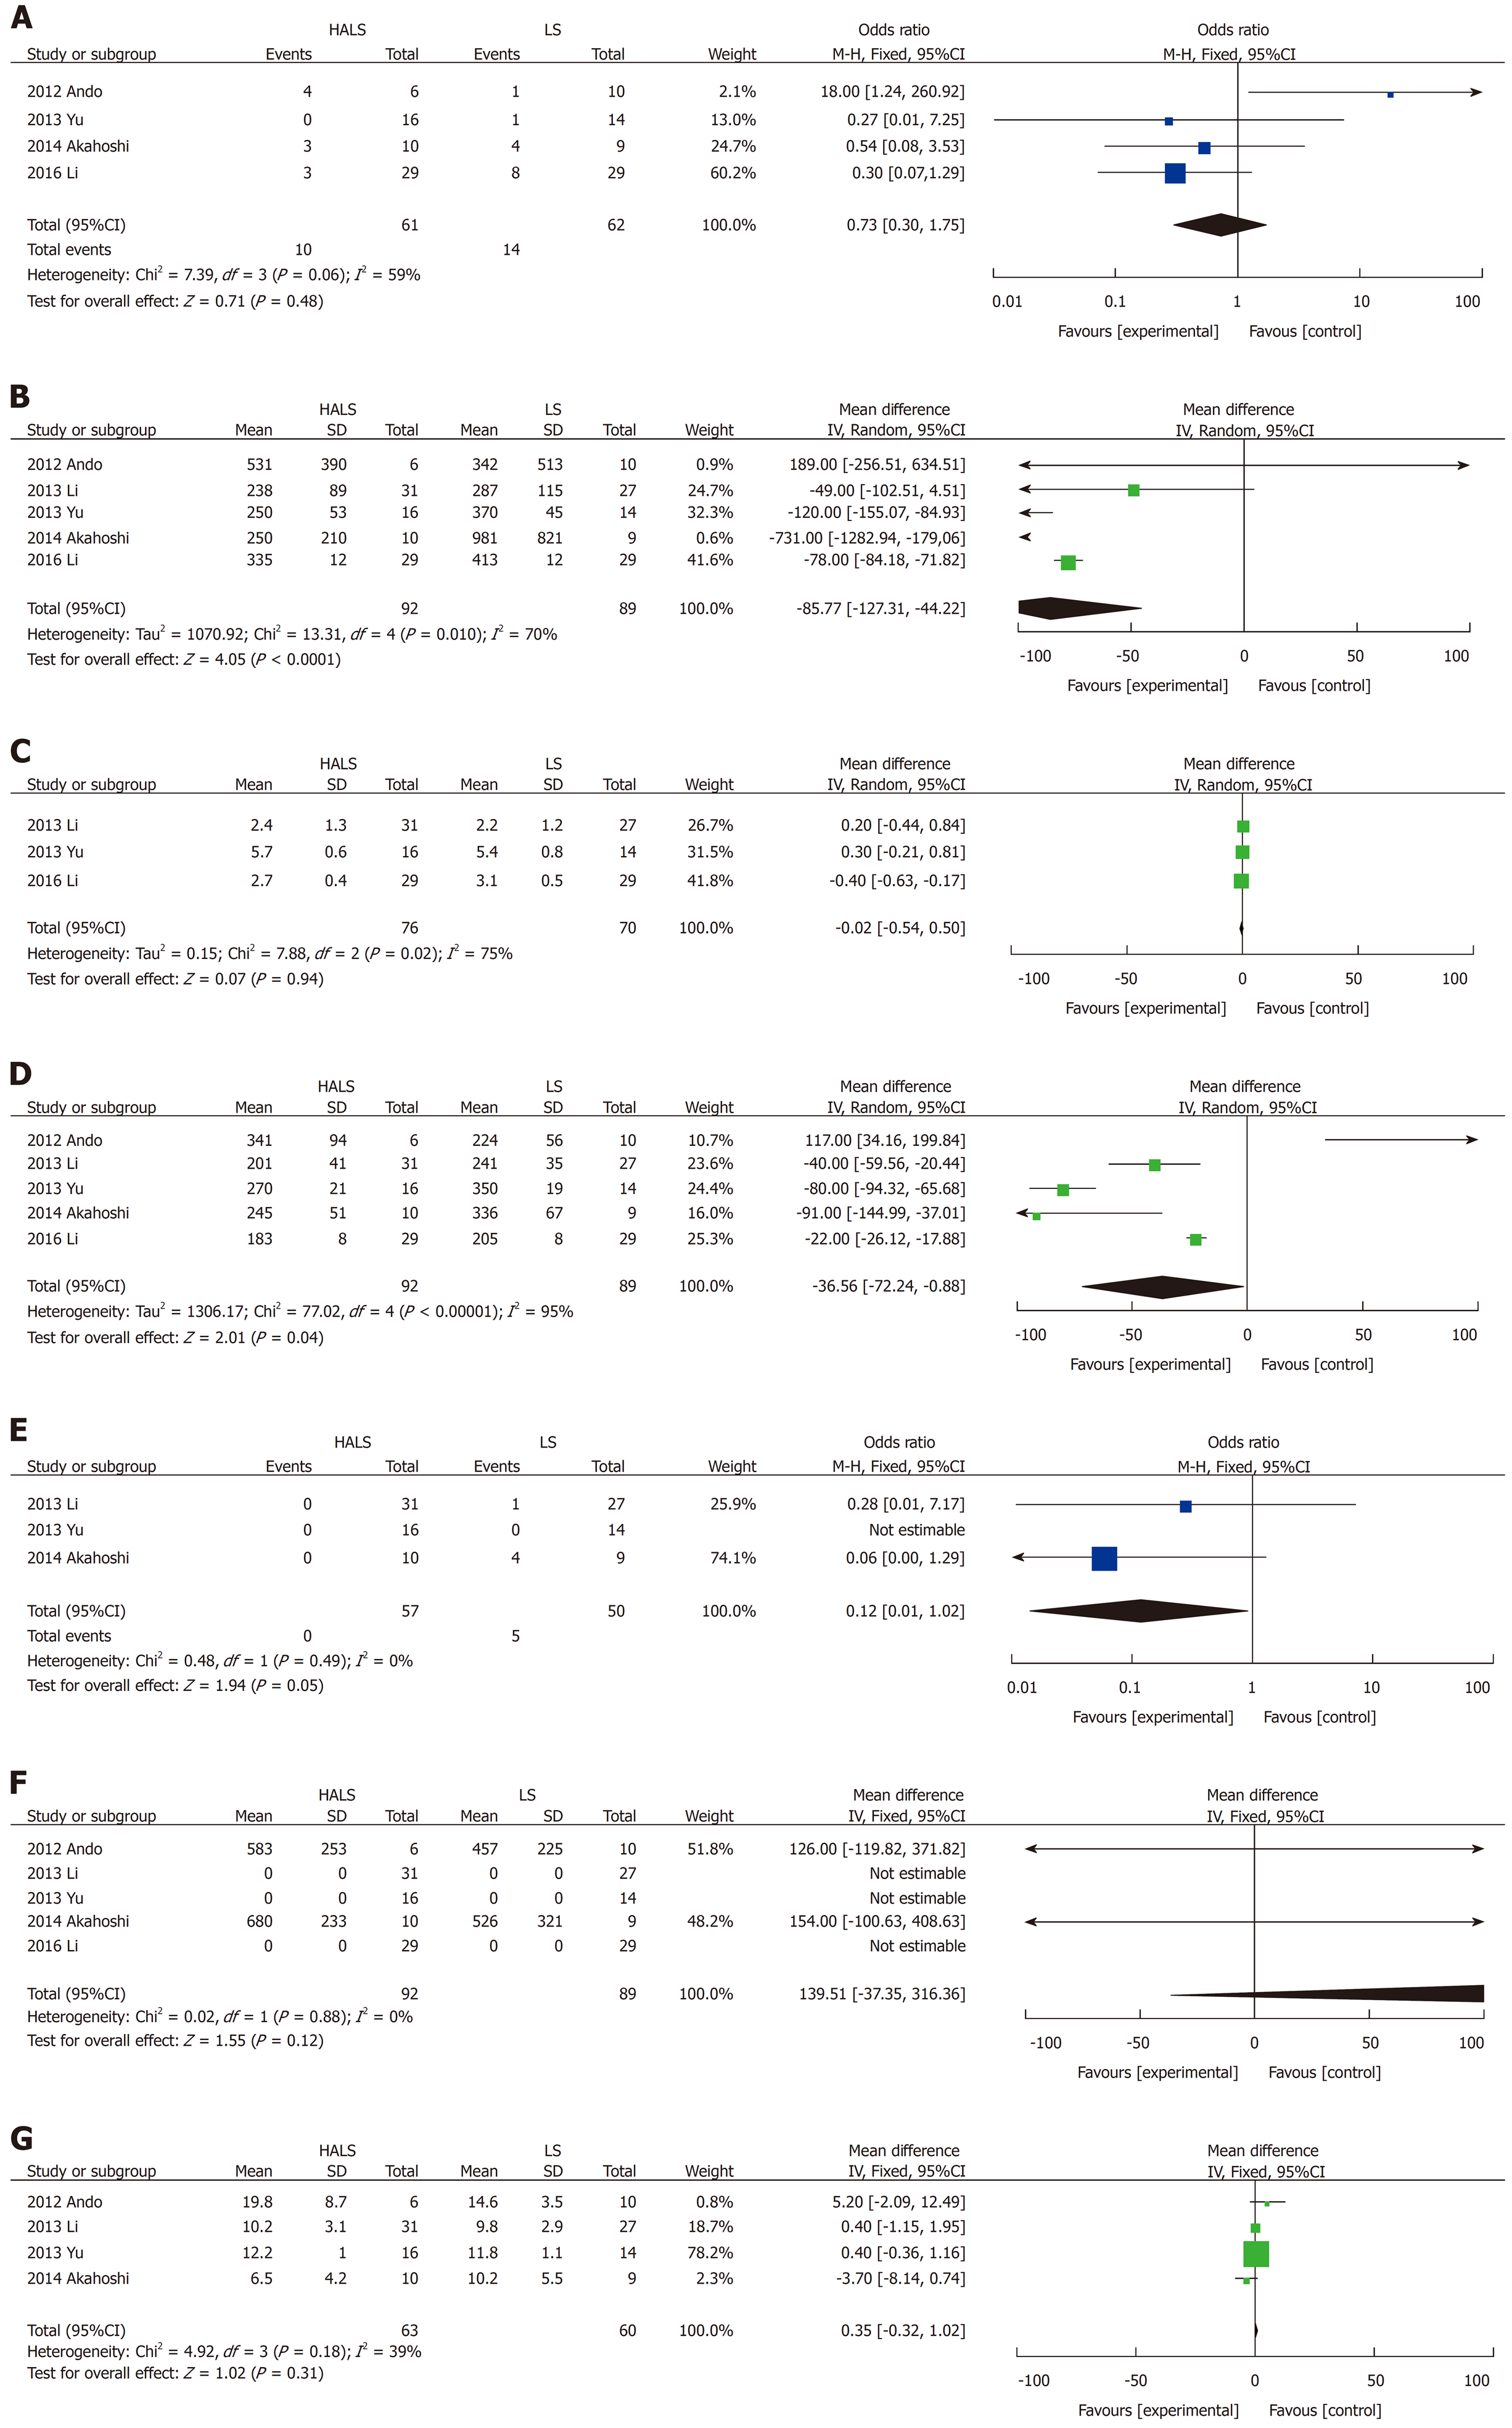
Figure 6 Forest plots of meta-analysis for splenectomy and devascularization of the upper stomach.
Complications (A), blood loss volume (B), time to food intake (C), operative time (D), conversion rate (E), splenic weight (F), and hospital stay length (G). HALS: Hand-assisted laparoscopic splenectomy; LS: Laparoscopic splenectomy.
- Citation: Huang Y, Wang XY, Wang K. Hand-assisted laparoscopic splenectomy is a useful surgical treatment method for patients with excessive splenomegaly: A meta-analysis. World J Clin Cases 2019; 7(3): 320-334
- URL: https://www.wjgnet.com/2307-8960/full/v7/i3/320.htm
- DOI: https://dx.doi.org/10.12998/wjcc.v7.i3.320


