Copyright
©The Author(s) 2019.
World J Clin Cases. Dec 6, 2019; 7(23): 4098-4105
Published online Dec 6, 2019. doi: 10.12998/wjcc.v7.i23.4098
Published online Dec 6, 2019. doi: 10.12998/wjcc.v7.i23.4098
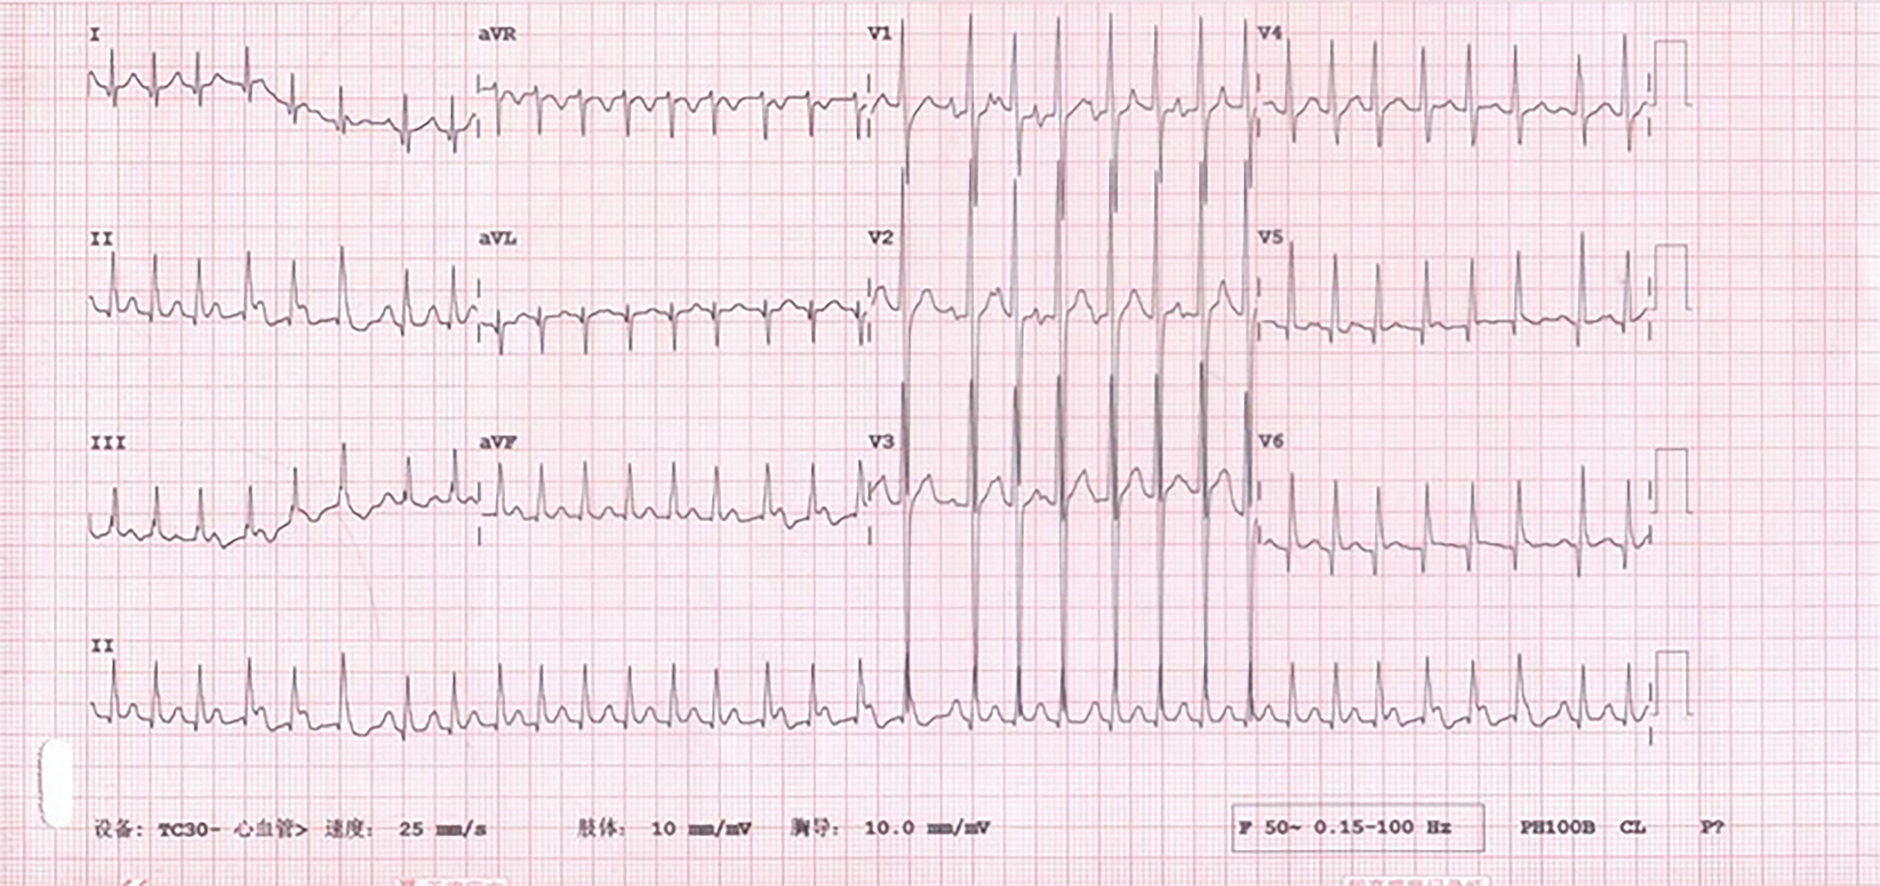
Figure 1 Electrocardiogram recorded at the Emergency Department.
The electrocardiogram shows atrial tachycardia with Wenckebach block, Q waves in leads I, V5 and V6, and large R waves in leads V1 and V2.
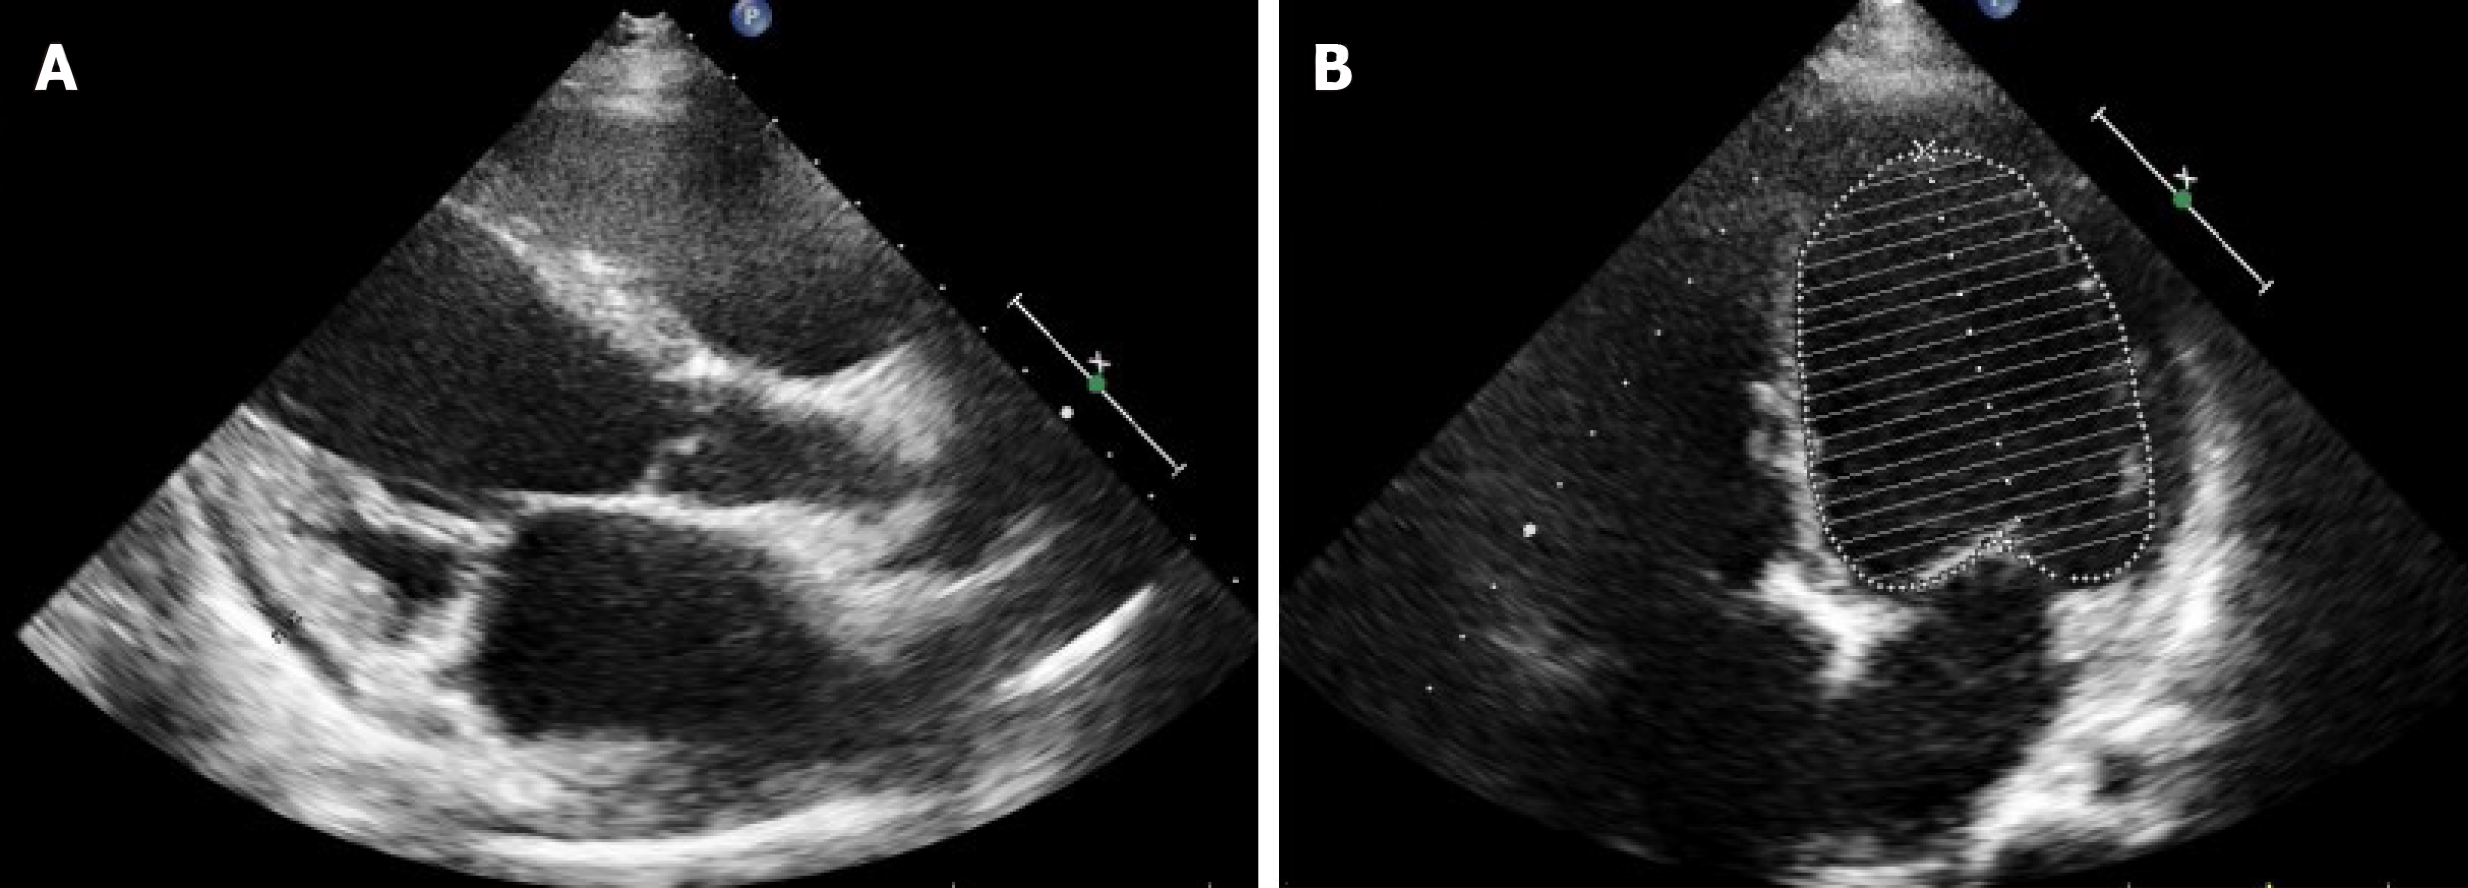
Figure 2 Echocardiogram of the patient.
A: Parasternal long axis view; B: Apical four-chamber view. Whole heart enlargement with cardiac dysfunction was found with mild mitral regurgitation, mild to moderate tricuspid regurgitation and moderate pulmonary hypertension (PASP = 51 mmHg). The left ventricular ejection fraction was 23% as calculated using Simpson’s Formula.
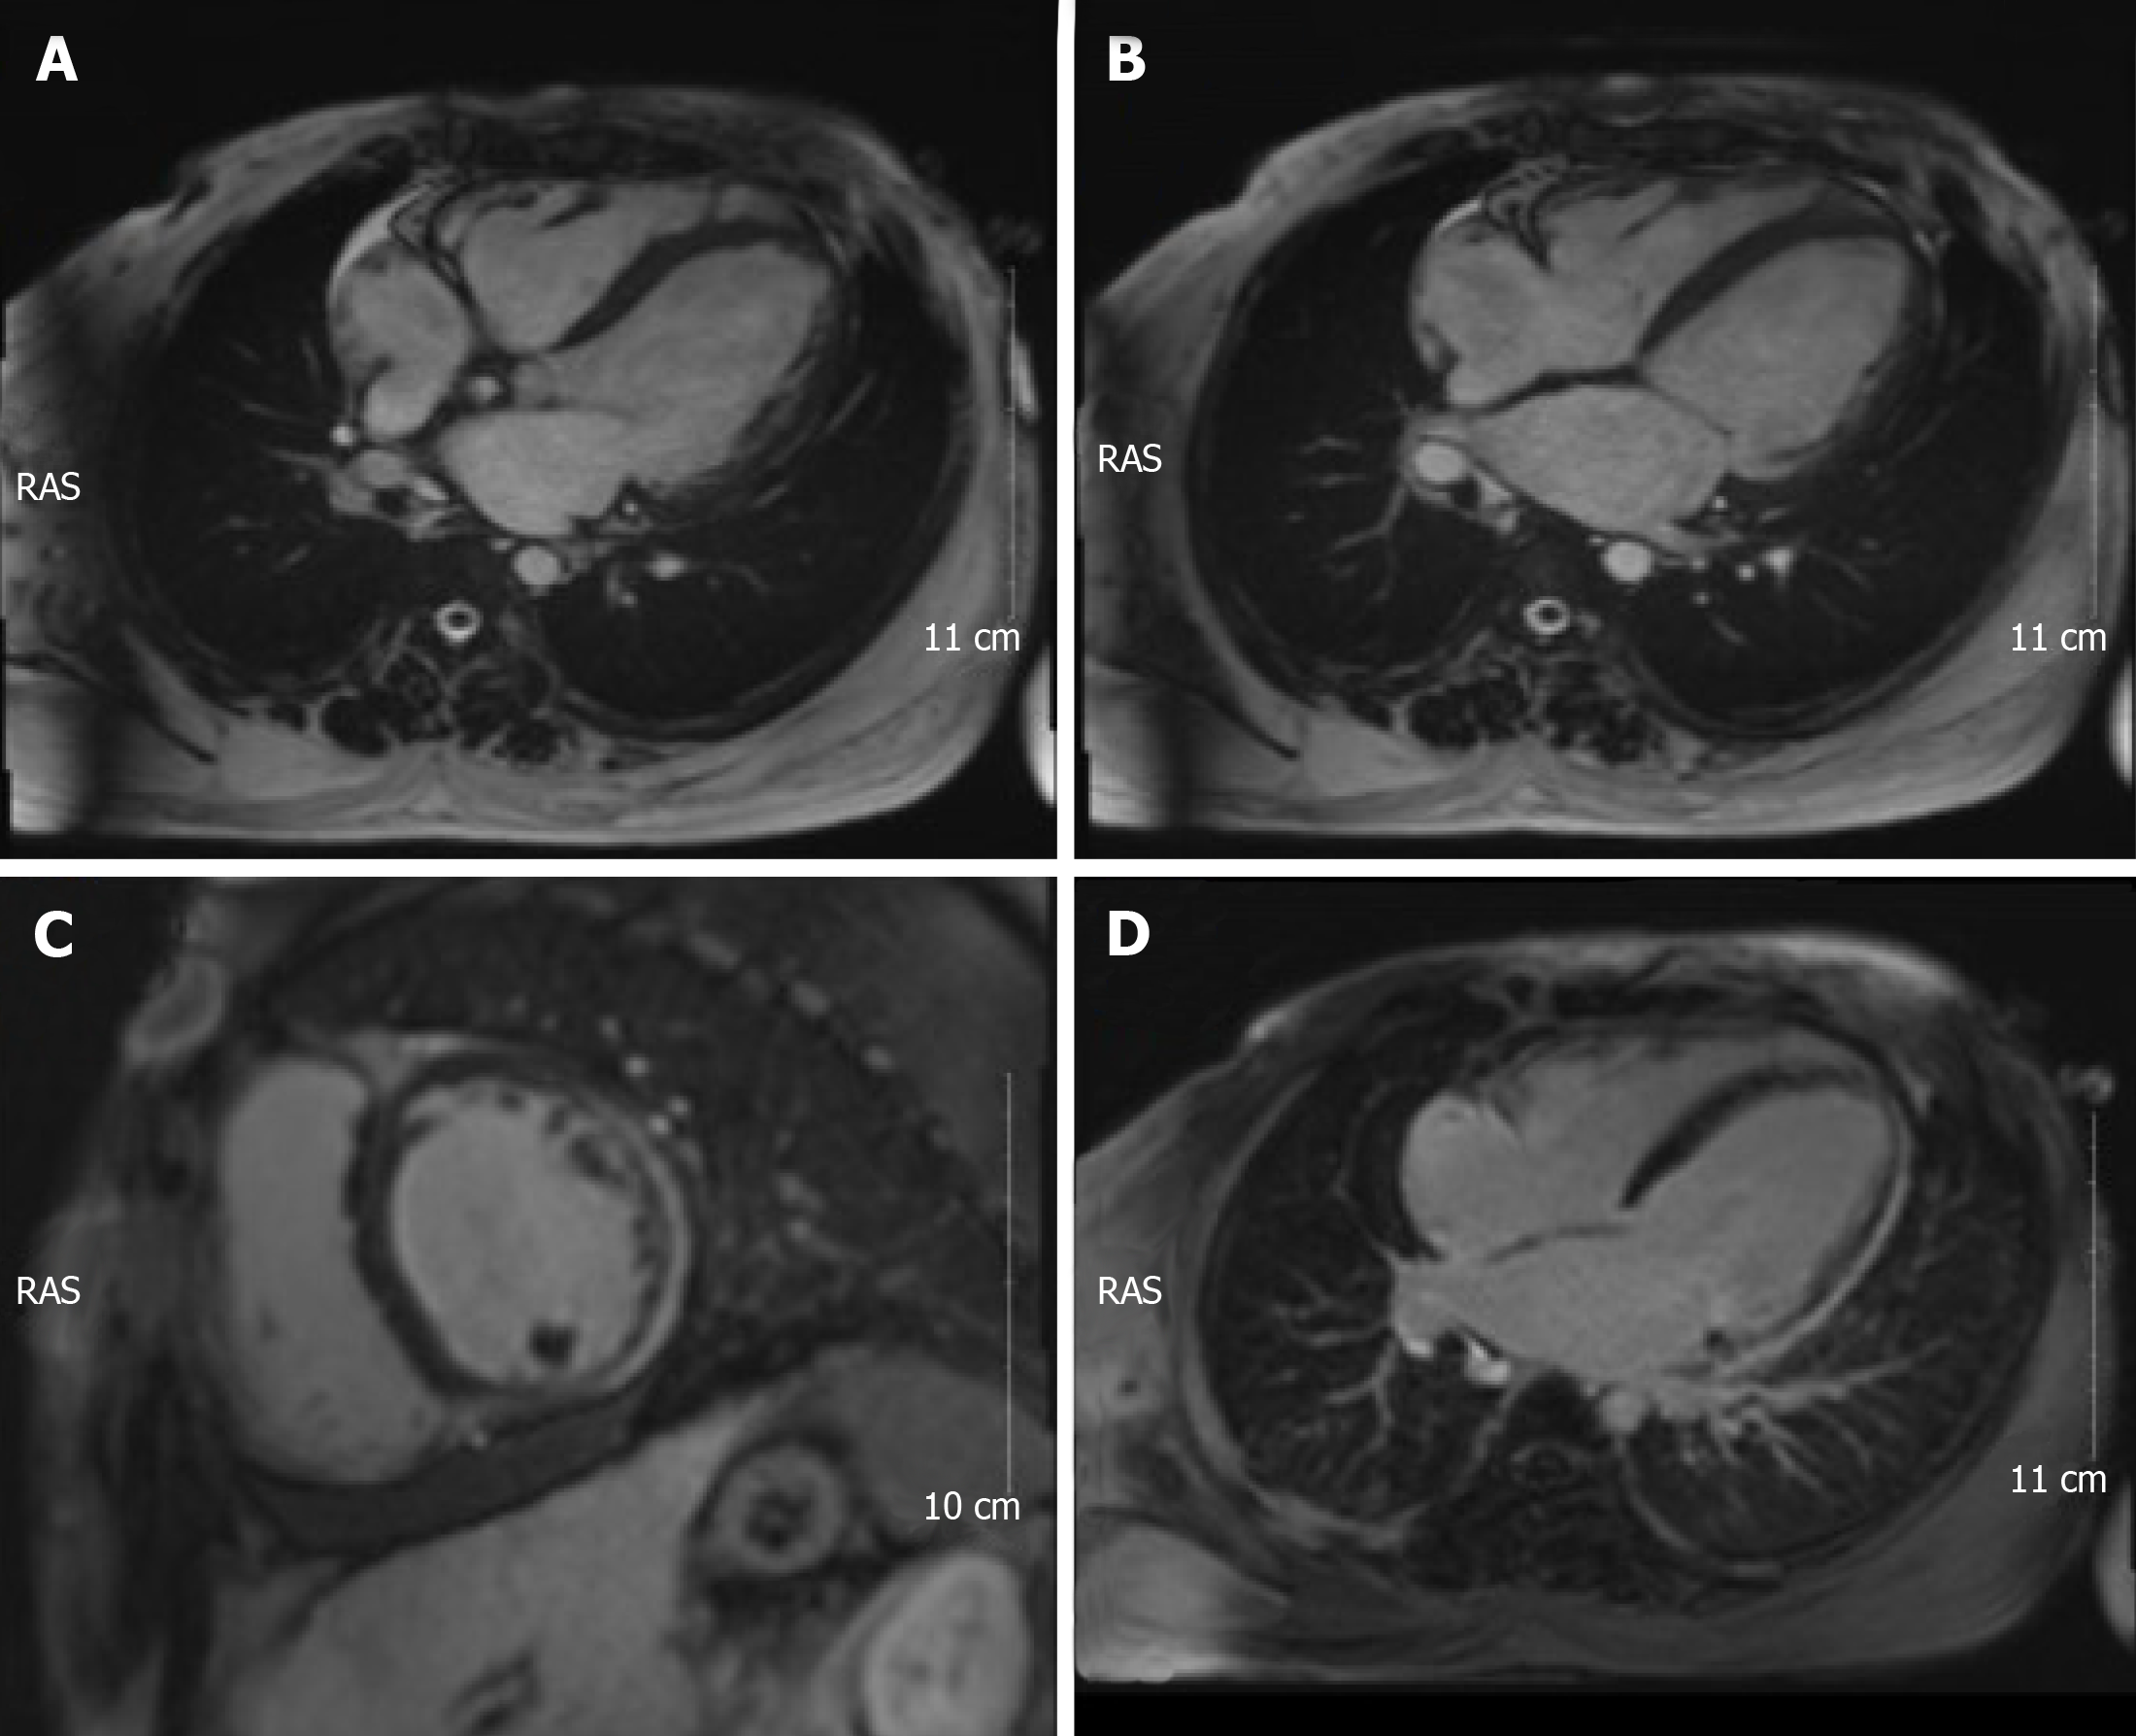
Figure 3 Cardiac magnetic resonance imaging of the patient.
A, B: Long-axis view of the heart, in diastole (A) and systole (B); C, D: With late gadolinium enhancement imaging, the short-axis view (C) and long-axis view (D) demonstrated multi-segmental abnormal enhancement at lateral, anterolateral and part of the inferior wall of the left ventricle.
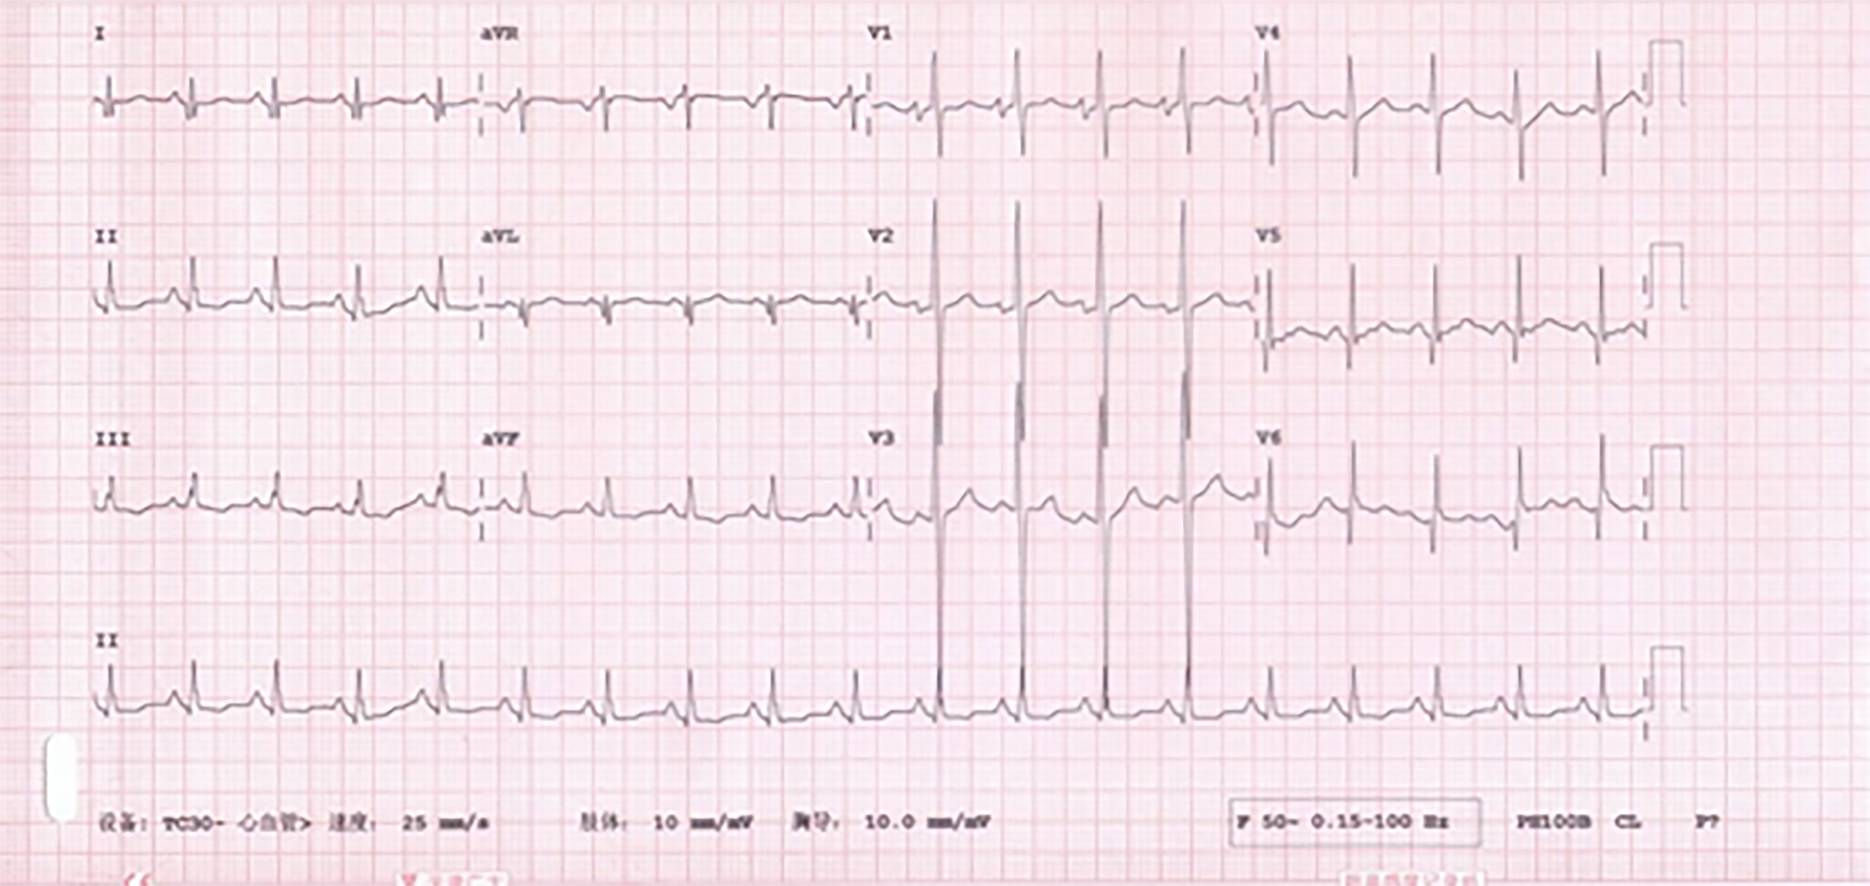
Figure 4 Electrocardiogram at the time of symptom relief.
Electrocardiogram shows sinus rhythm, right heart hypertrophy, Q waves in leads I, V5 and V6, and large R waves in leads V1 and V2.
- Citation: Li JM, Chen H. Recurrent hypotension induced by sacubitril/valsartan in cardiomyopathy secondary to Duchenne muscular dystrophy: A case report. World J Clin Cases 2019; 7(23): 4098-4105
- URL: https://www.wjgnet.com/2307-8960/full/v7/i23/4098.htm
- DOI: https://dx.doi.org/10.12998/wjcc.v7.i23.4098


