Copyright
©The Author(s) 2019.
World J Clin Cases. Dec 6, 2019; 7(23): 3945-3956
Published online Dec 6, 2019. doi: 10.12998/wjcc.v7.i23.3945
Published online Dec 6, 2019. doi: 10.12998/wjcc.v7.i23.3945
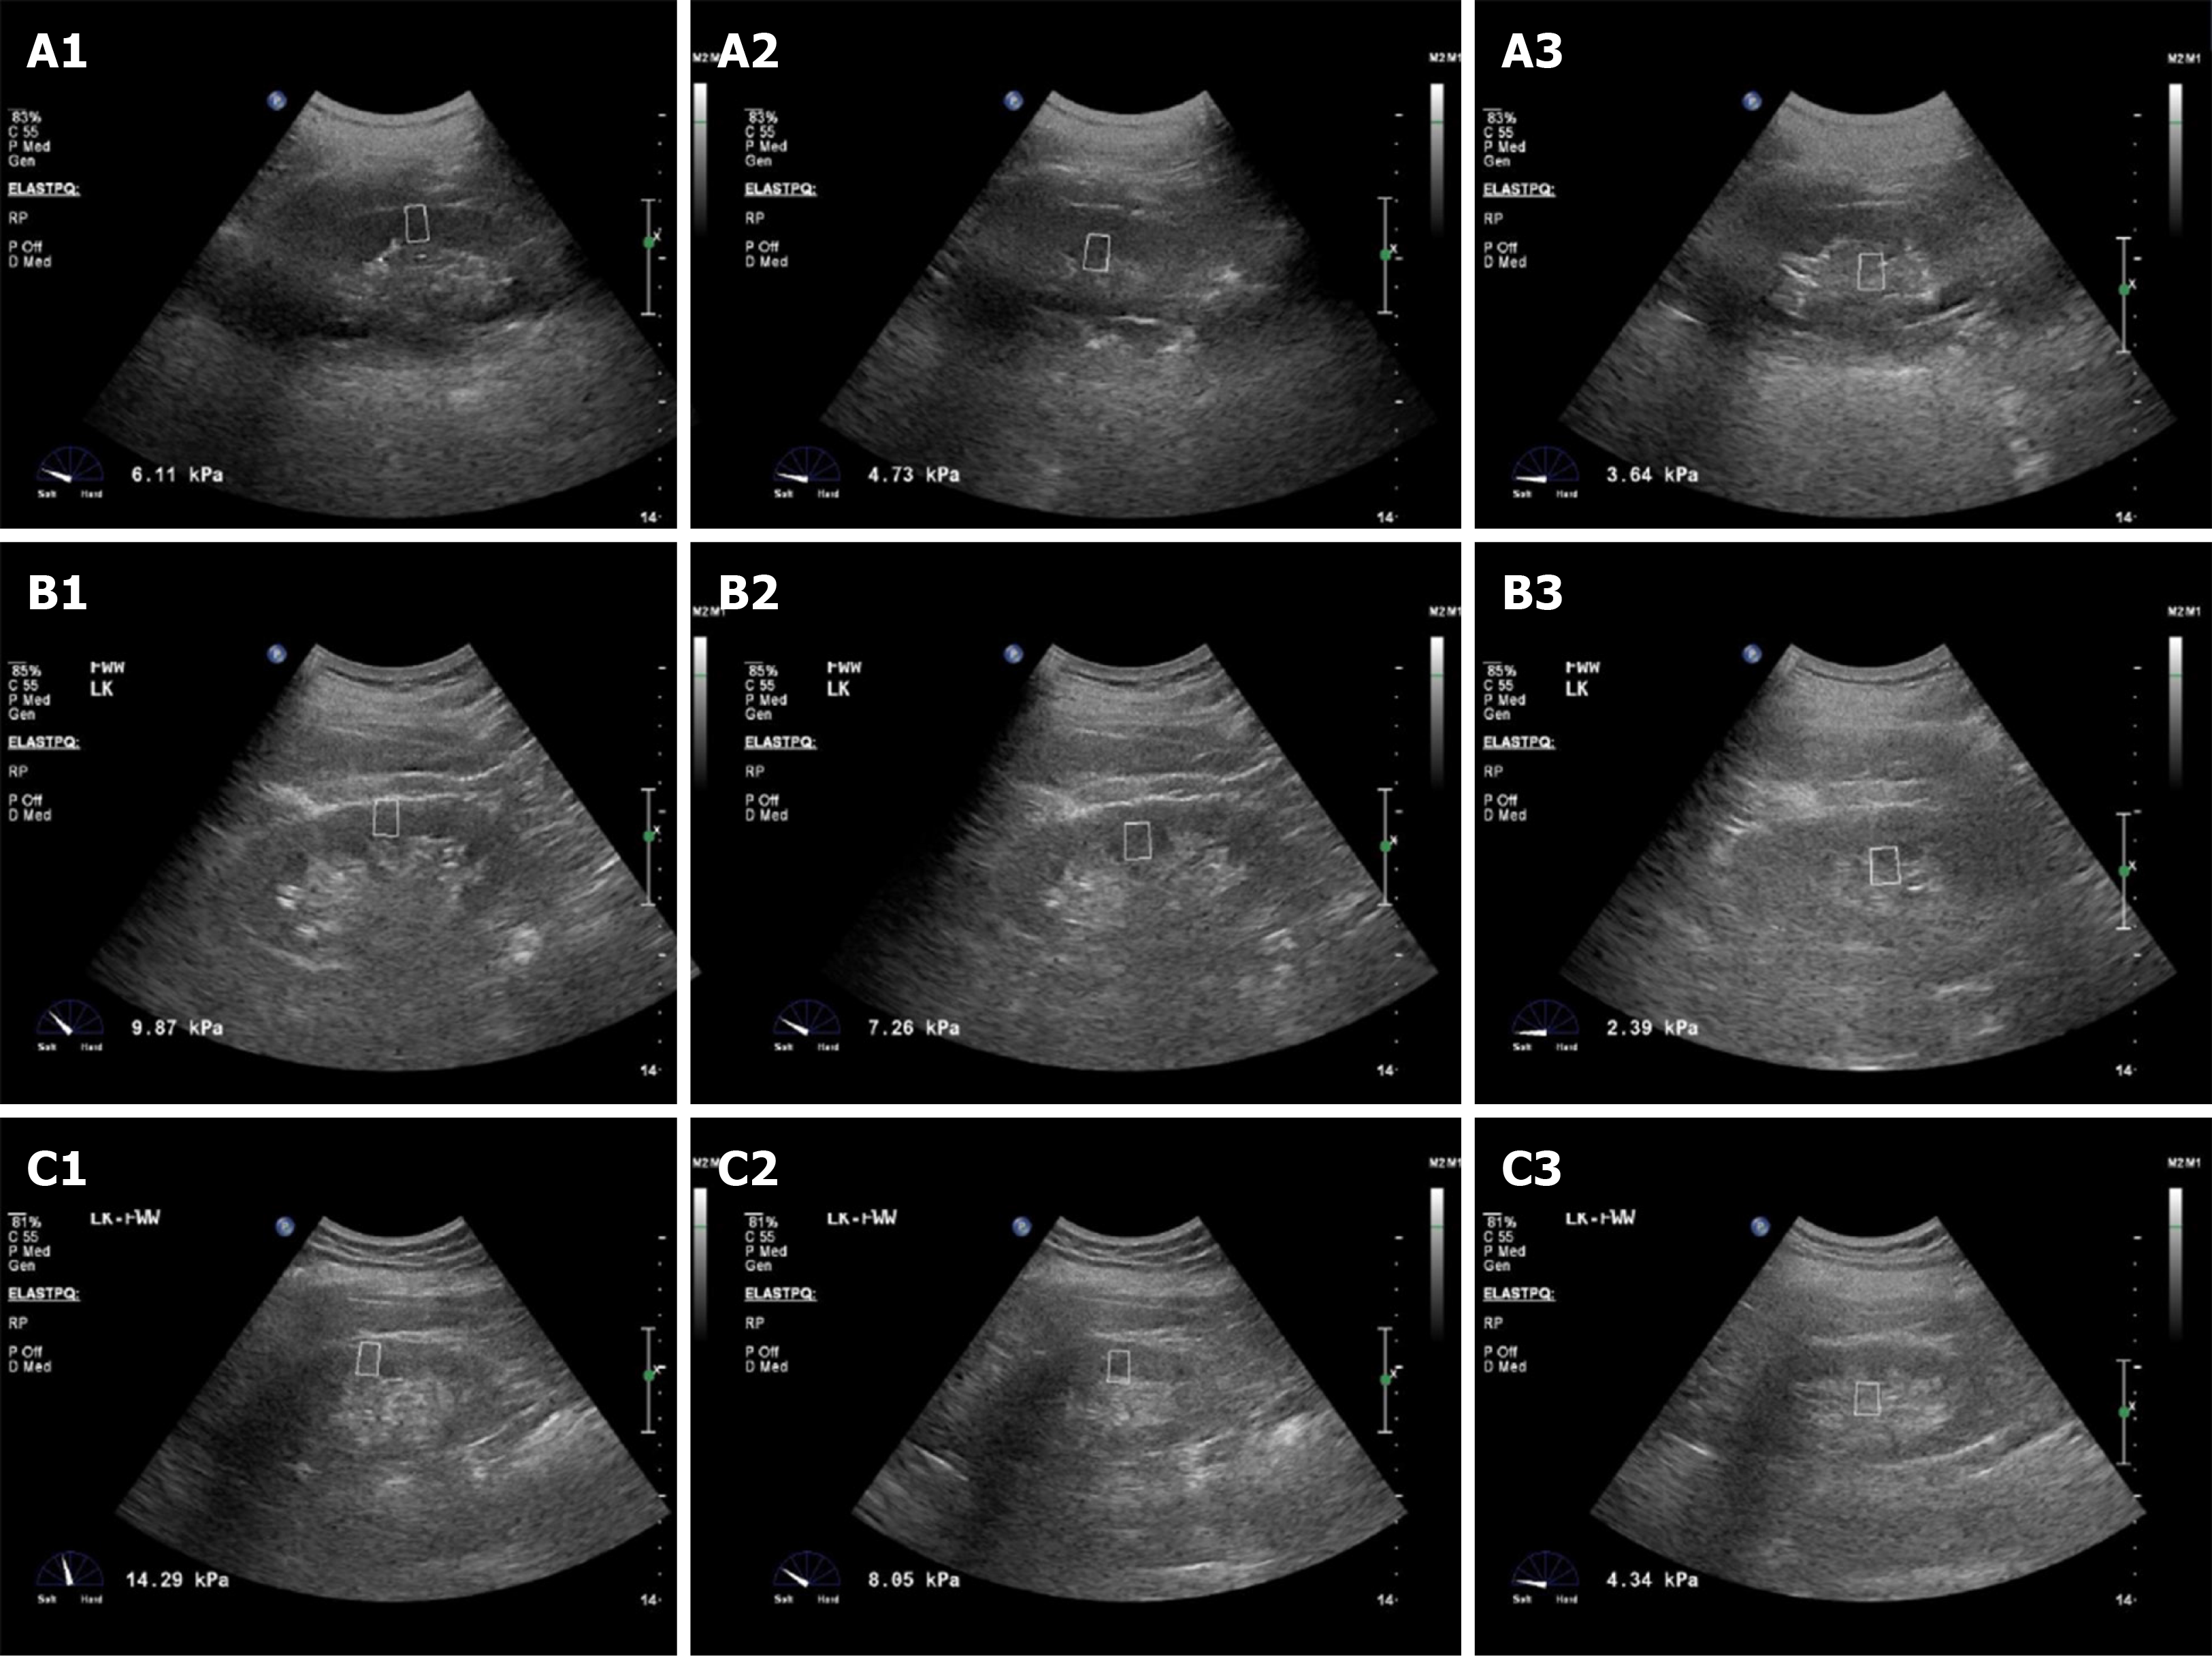
Figure 1 Renal hardness differences of elastography point quantification in different patients.
A1: The renocortical Young's Modulus (YM) of a simple diabetic patient was 6.11 kPa; A2: The YM of the renal medulla in a simple diabetic patient was 4.73 kPa; A3: The YM of the renal sinus in a simple diabetic patient was 3.64 kPa; B1: The renocortical YM of an early diabetic kidney disease (DKD) patient was 9.87 kPa; B2: The YM of the renal medulla in an early DKD patient was 7.26 kPa; B3: The YM of the renal sinus in an early DKD patient was 2.39 kPa; C1: The renocortical YM of a medium DKD patient was 14.29 kPa; C2: The YM of the renal medulla in a medium DKD patient was 8.05 kPa; C3: The YM of the renal sinus in a medium DKD patient was 4.34 kPa.
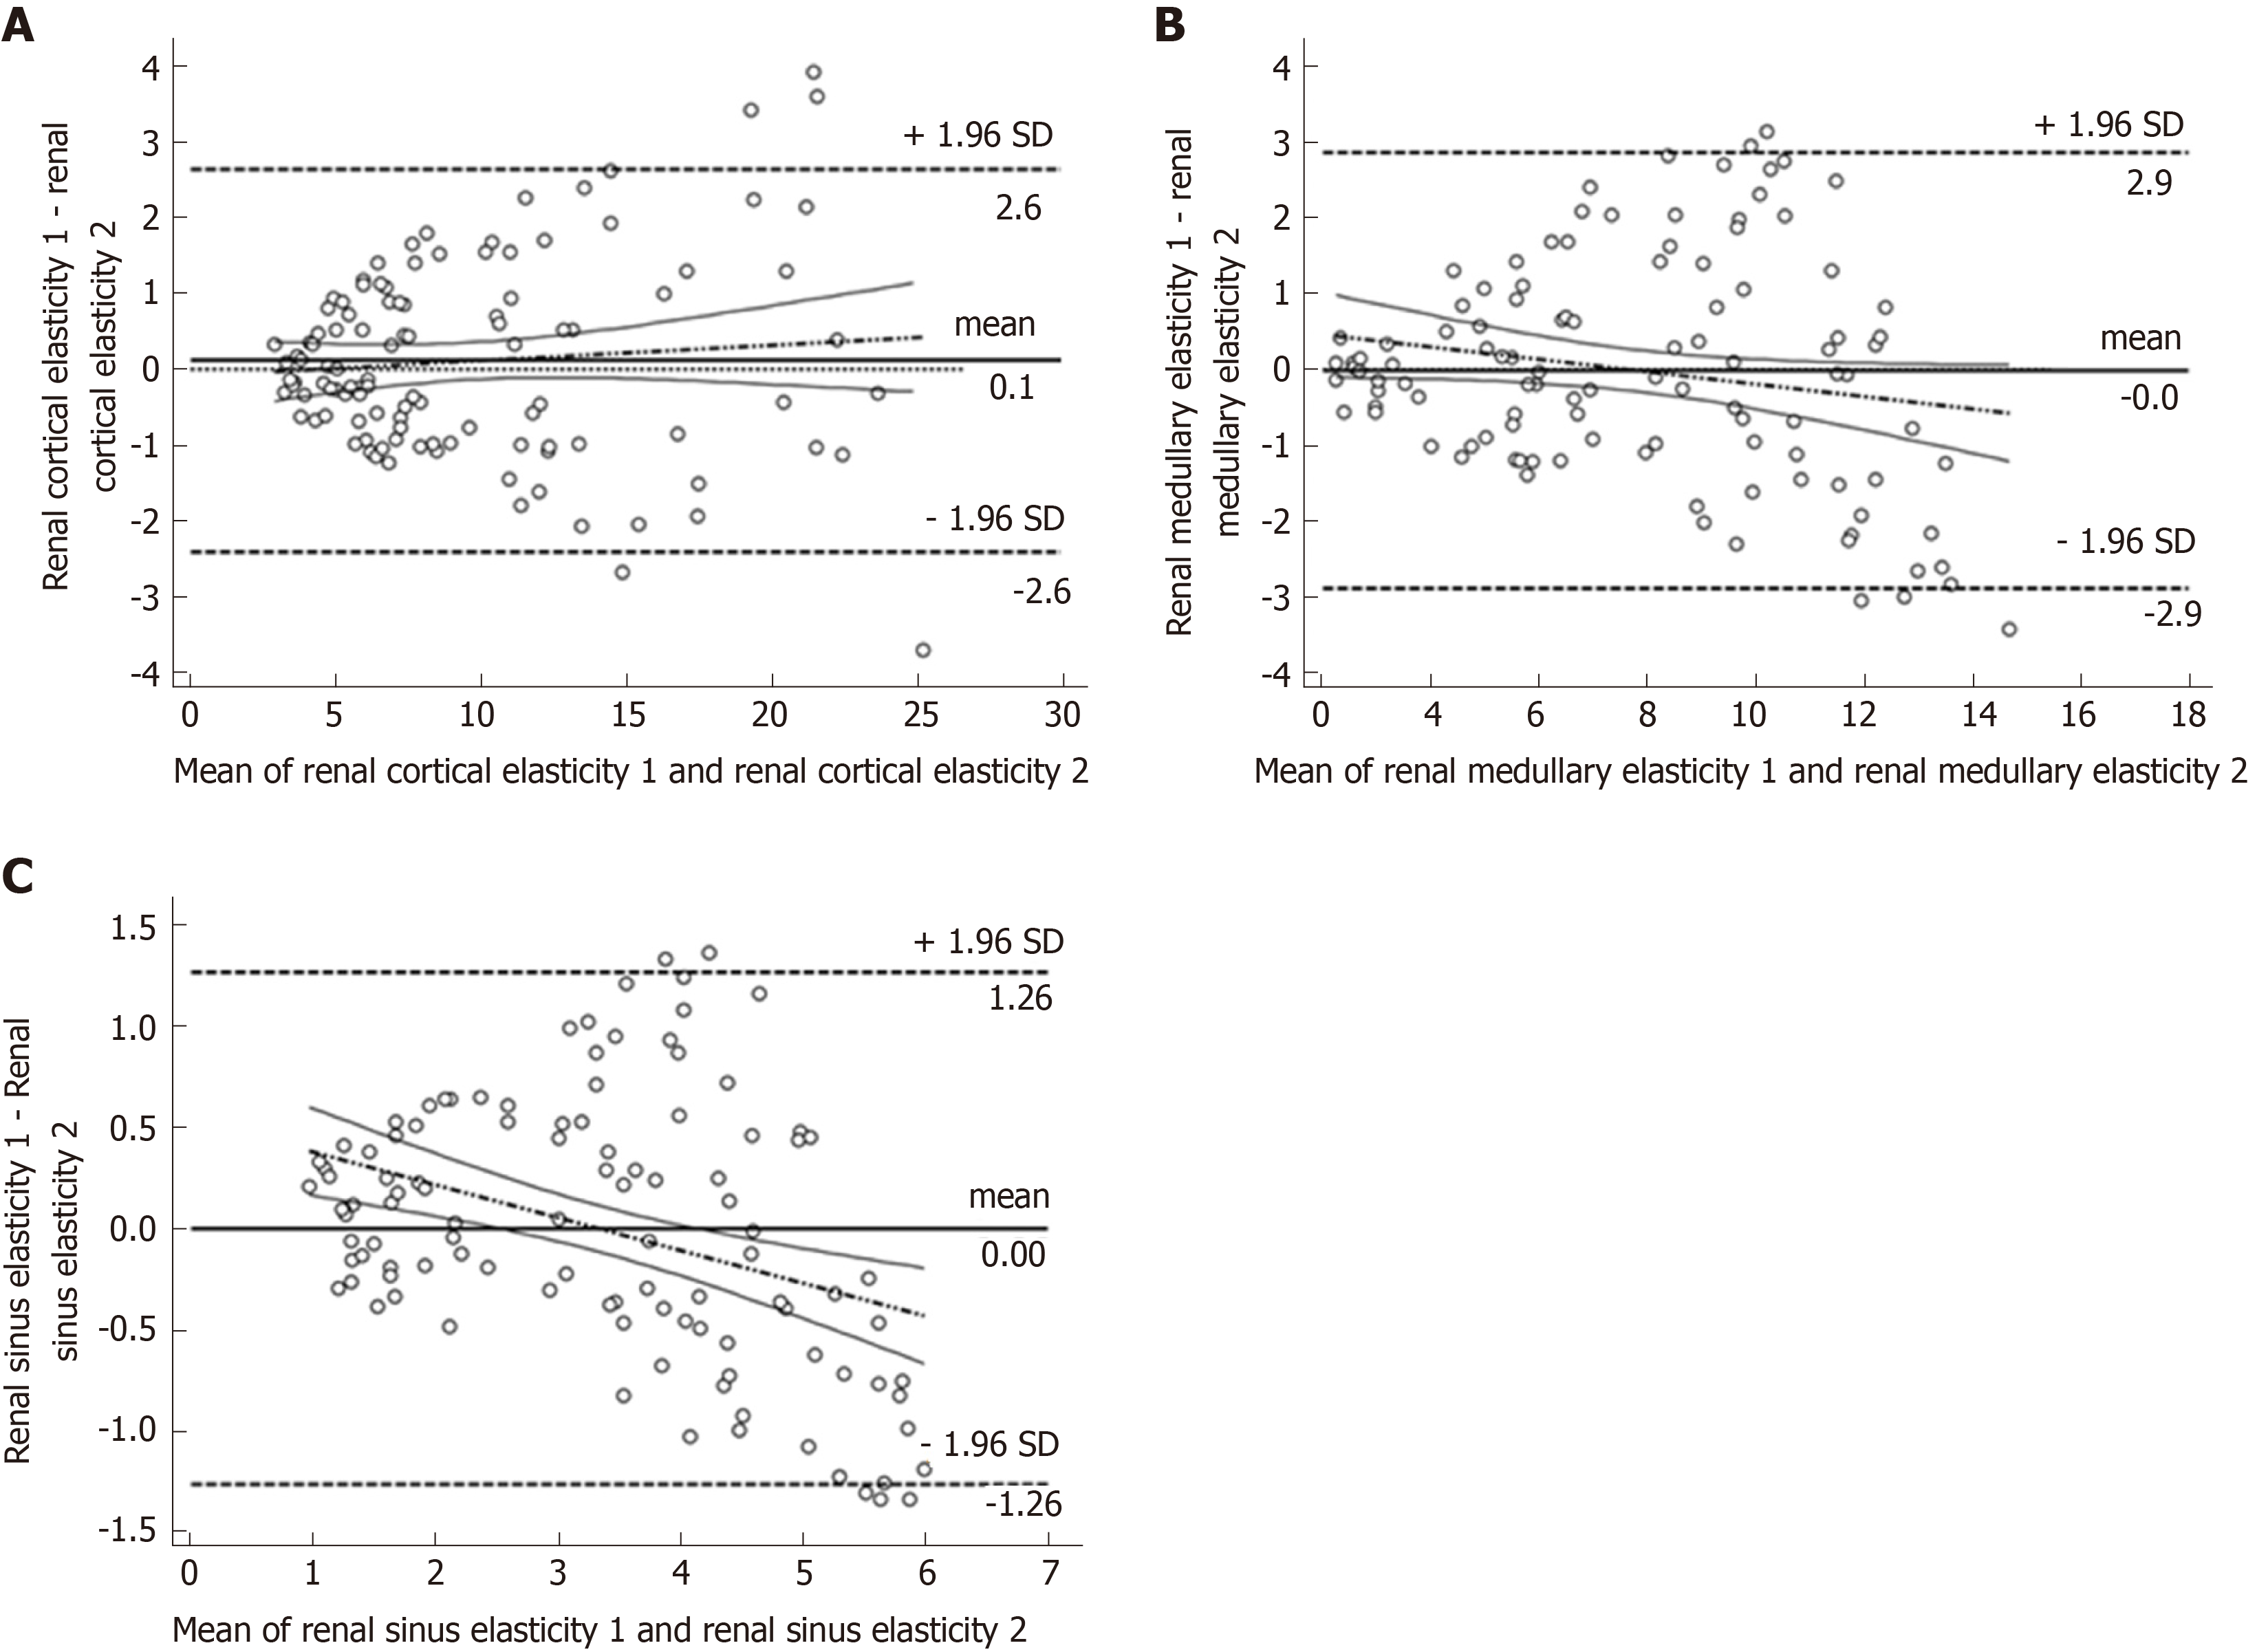
Figure 2 Bland-Altman analysis of the Young's Modulus in renal cortex, medulla, and renal sinus by two sonographers.
A: Consistency analysis of renocortical Young's Modulus (YM); B: Consistency analysis of renal medullary YM; C: Consistency analysis of renal sinus YM.
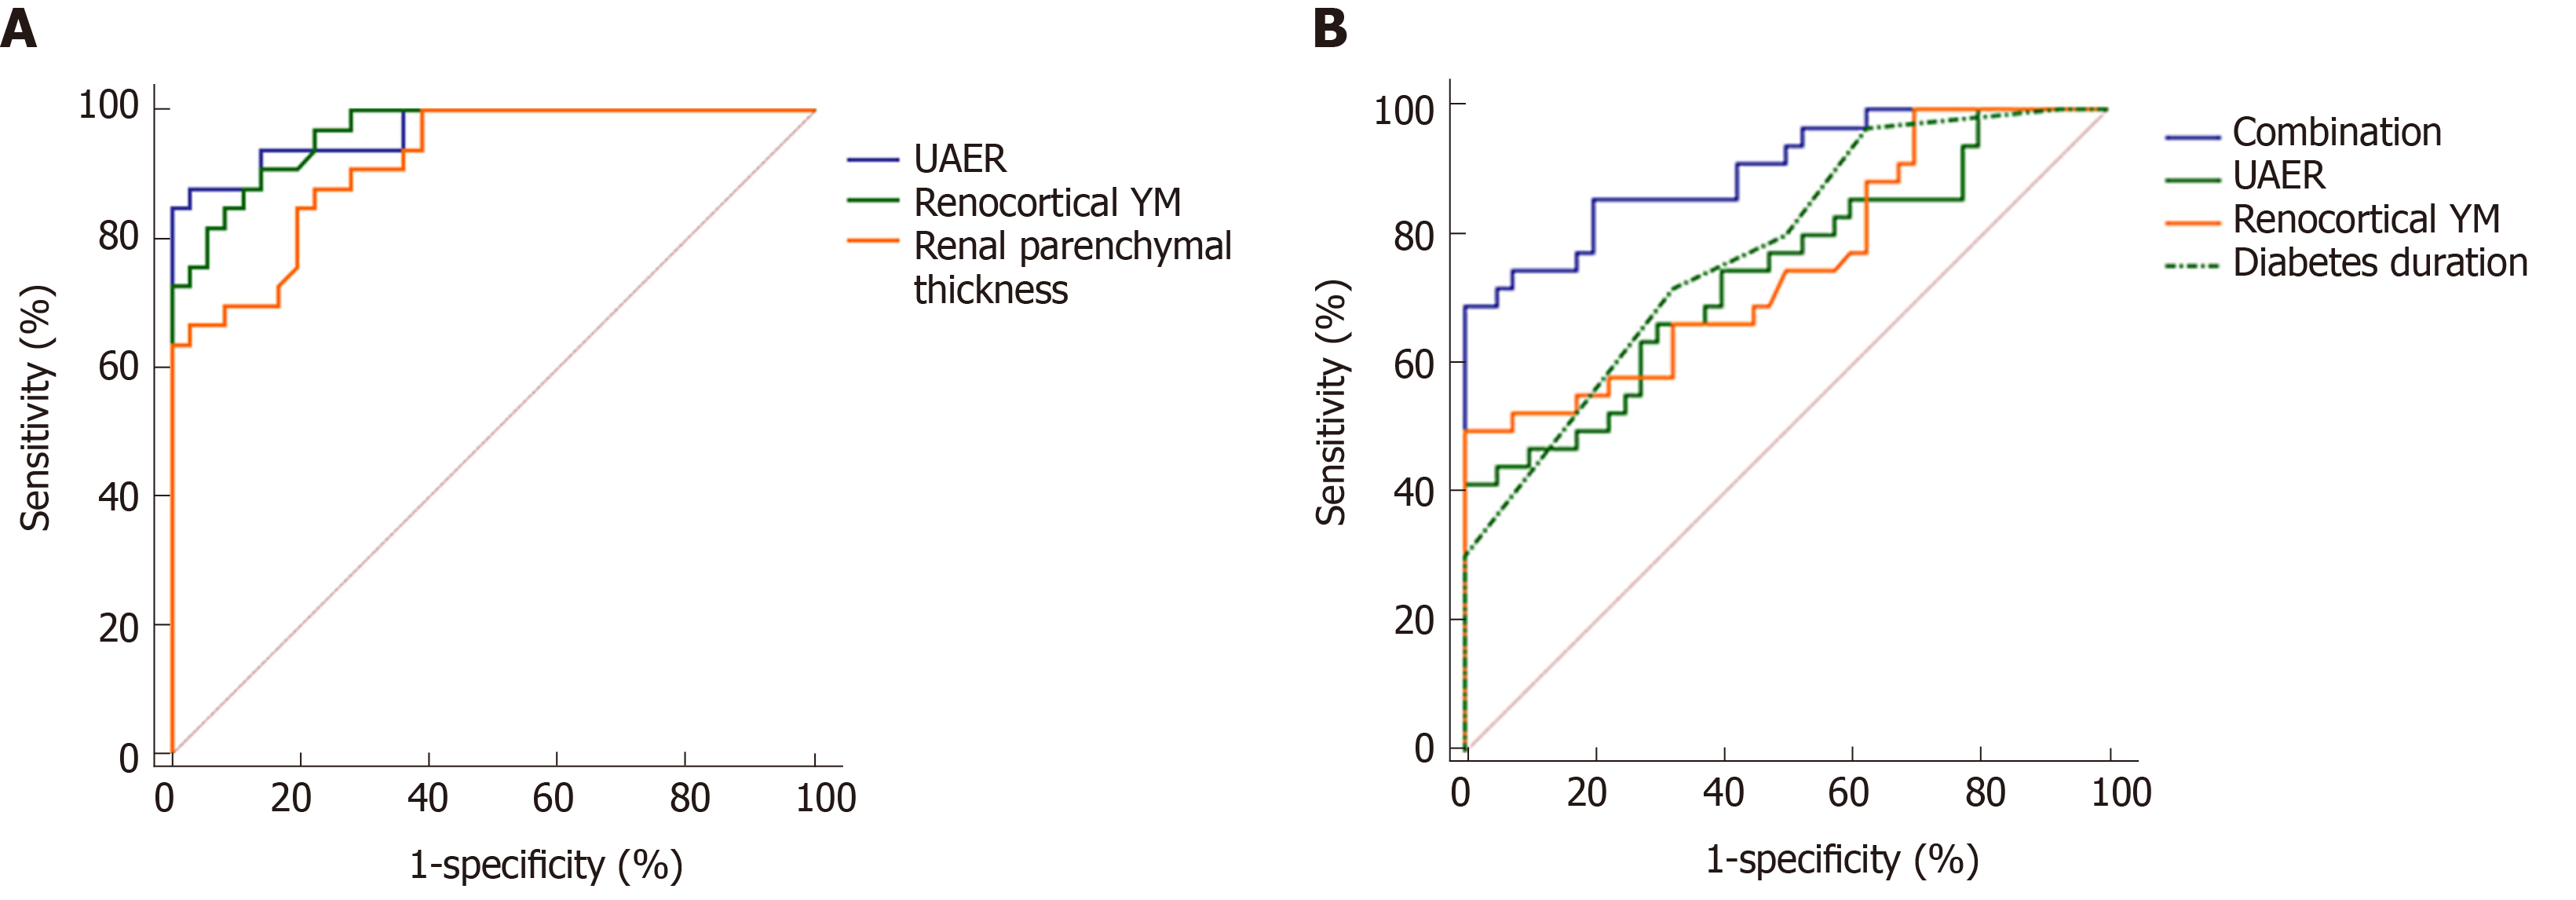
Figure 3 Receiver operating characteristic analyses.
A: Receiver operating characteristic (ROC) analyses of urinary albumin excretion rate (UAER), renocortical Young's Modulus (YM), and renal parenchymal thickness in identifying early and medium diabetic kidney disease (DKD); B: ROC analyses of UAER, diabetes duration, renocortical YM, and their combination in identifying early DKD and simple diabetes. UAER: Urinary albumin excretion rate; YM: Young's Modulus.
- Citation: Liu QY, Duan Q, Fu XH, Fu LQ, Xia HW, Wan YL. Value of elastography point quantification in improving the diagnostic accuracy of early diabetic kidney disease. World J Clin Cases 2019; 7(23): 3945-3956
- URL: https://www.wjgnet.com/2307-8960/full/v7/i23/3945.htm
- DOI: https://dx.doi.org/10.12998/wjcc.v7.i23.3945


