Copyright
©The Author(s) 2019.
World J Clin Cases. Sep 26, 2019; 7(18): 2722-2733
Published online Sep 26, 2019. doi: 10.12998/wjcc.v7.i18.2722
Published online Sep 26, 2019. doi: 10.12998/wjcc.v7.i18.2722
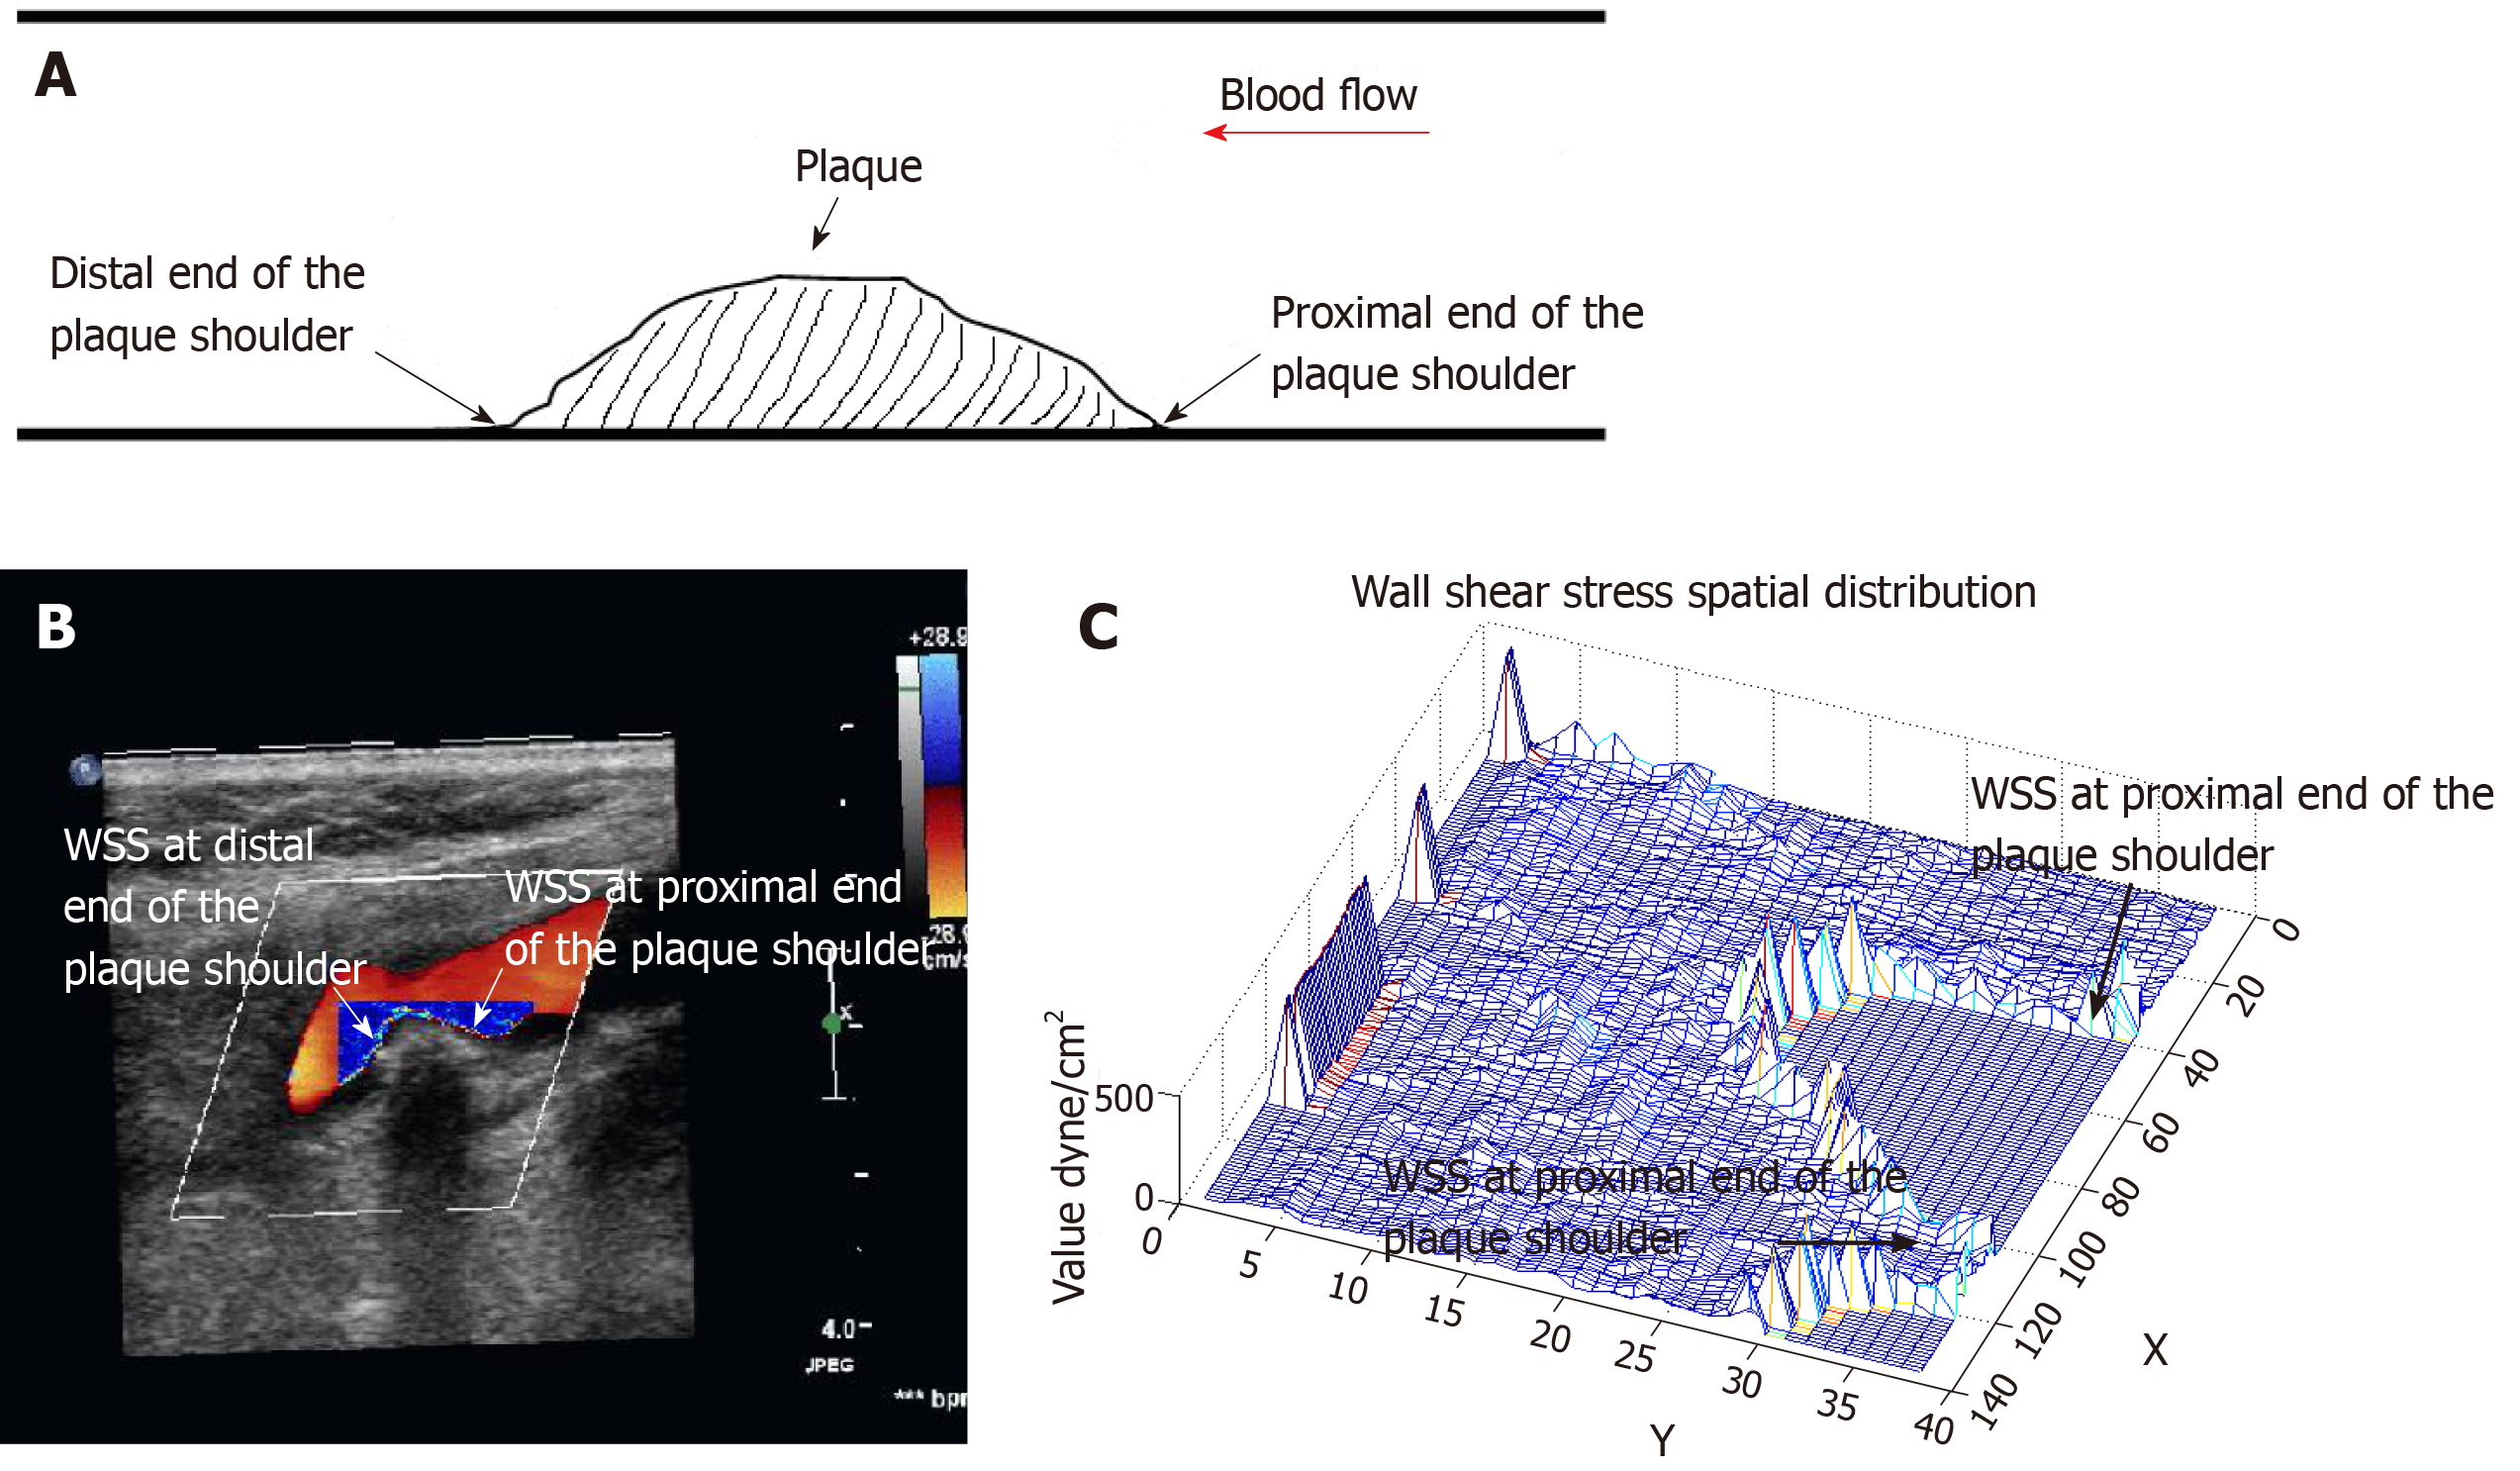
Figure 1 Wall shear stress at the carotid plaque plotted with the shear stress quantitative analysis software.
A: Schematic representation of the proximal and distal end of the carotid plaque; B: Wall shear stress (WSS) spatial distribution map at the carotid plaque shoulder plotted with the shear stress quantitative analysis software; C: WSS three-dimensional spatial distribution at the carotid plaque shoulder plotted with the shear stress quantitative analysis software.
Figure 2 Wall shear stress distribution at the plaque generated with the shear stress quantitative analysis software.
The patient in the figure was a 52-year-old woman. Ultrasound examination showed mixed plaque in the internal carotid artery. The stenosis degree in the internal carotid artery was 35%. A: Color Doppler blood flow pattern at the internal carotid artery plaque; B: Two-dimensional wall shear stress (WSS) spatial distribution at the internal carotid artery plaque; C: Three-dimensional WSS spatial distribution at the internal carotid artery plaque.
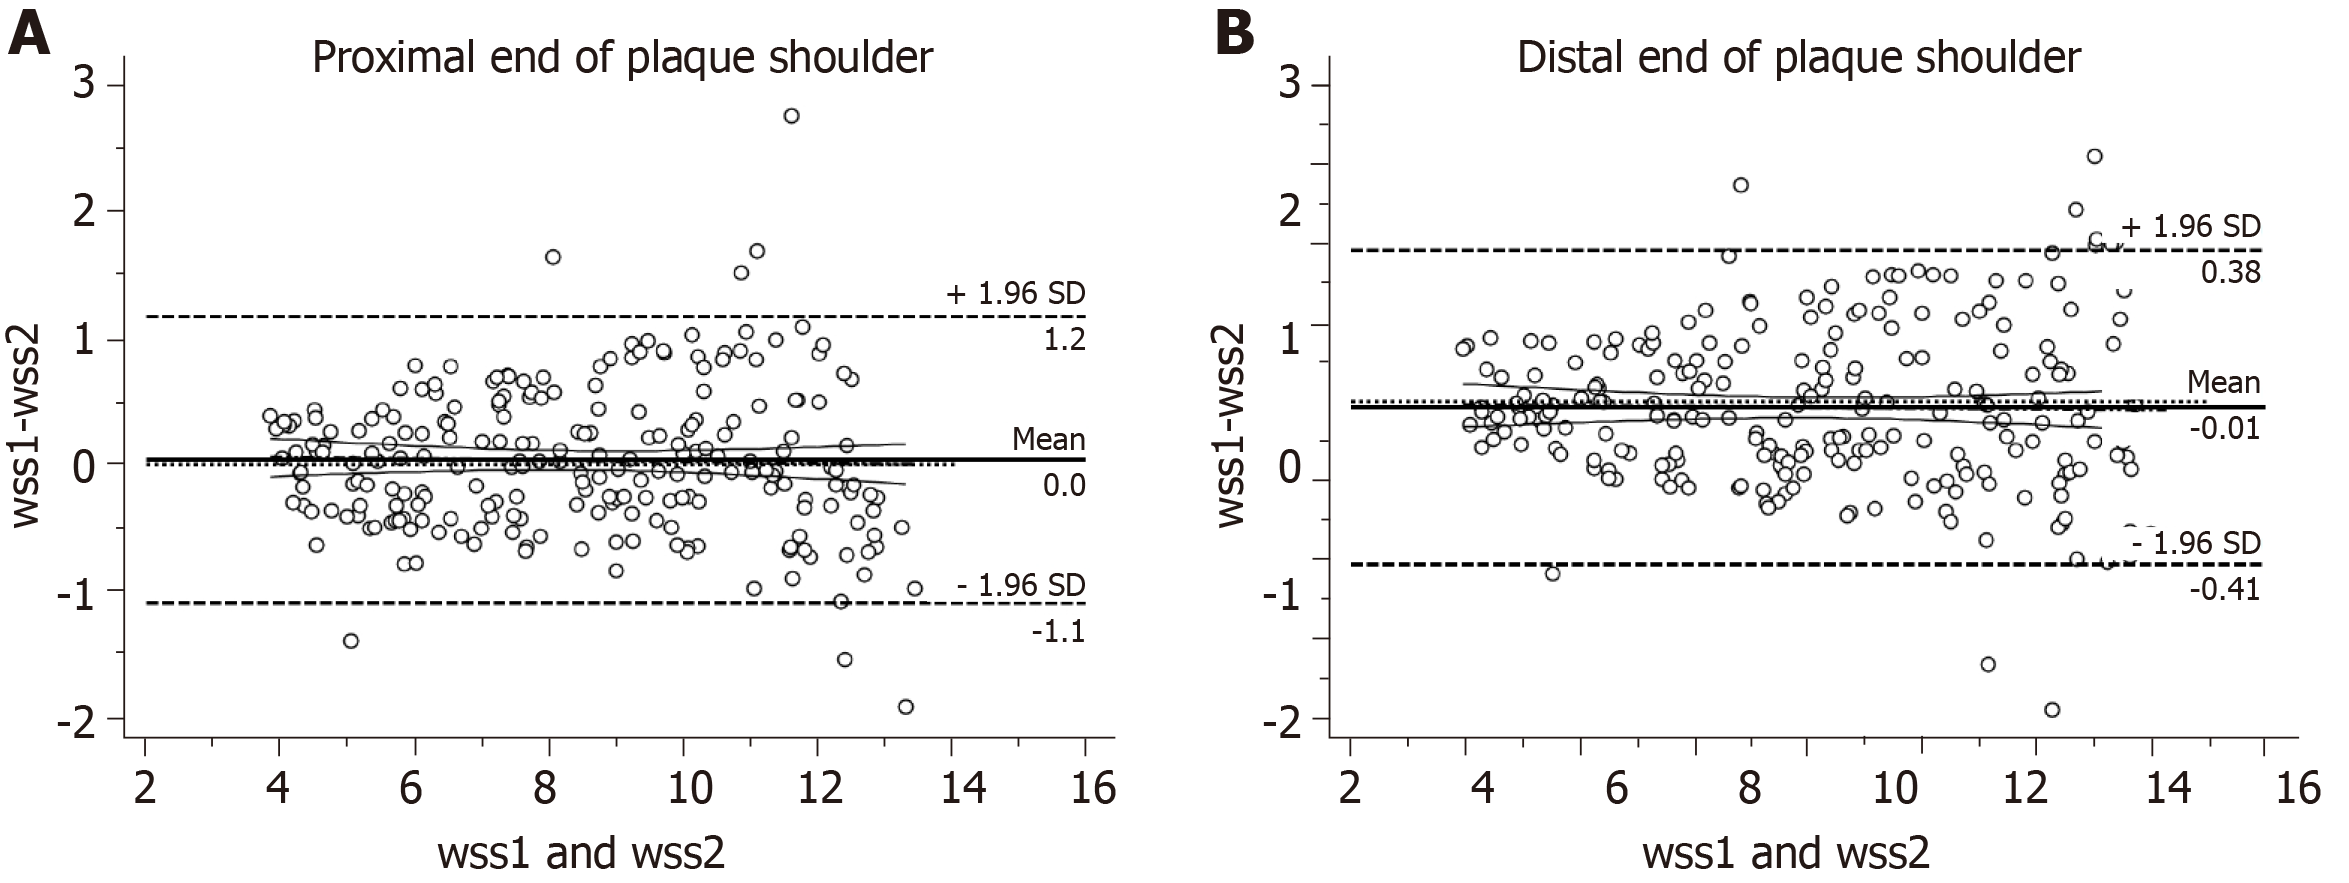
Figure 3 Bland-Altman analysis of wall shear stress by two sonographers.
A: Consistency analysis of wall shear stress (WSS) at the proximal end of the plaque shoulder; B: Consistency analysis of WSS at the distal end of the plaque shoulder.
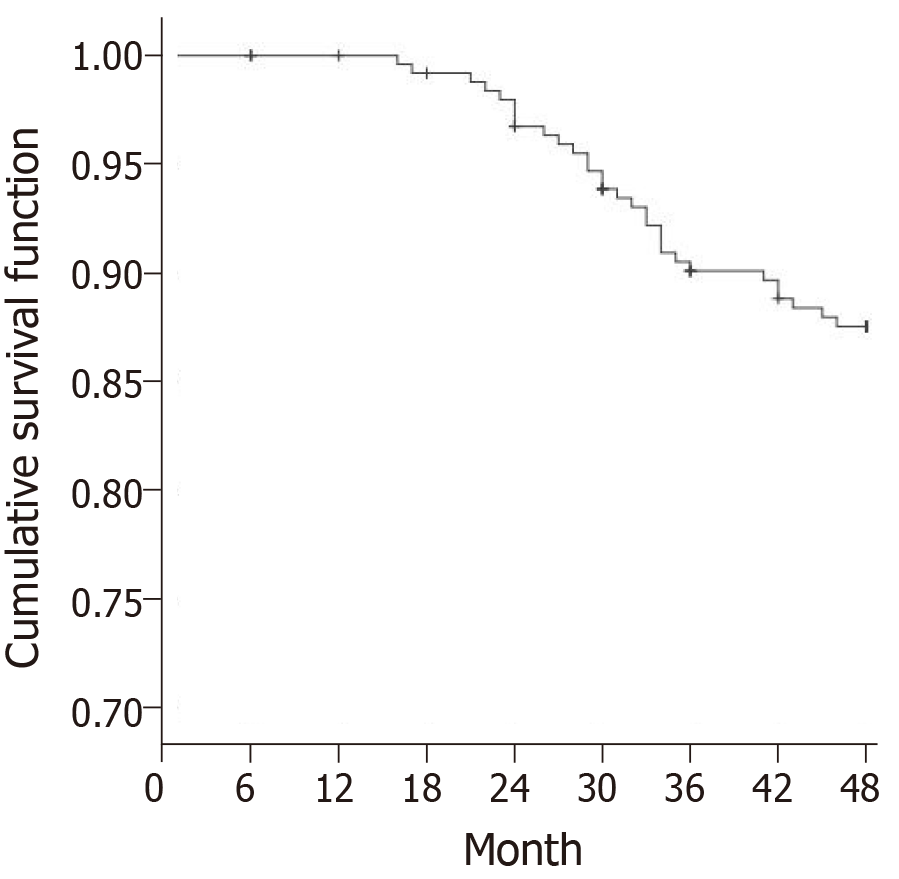
Figure 4 Transient ischemic attack occurrence during follow-up in patients with atherosclerosis (Kaplan-Meier method).
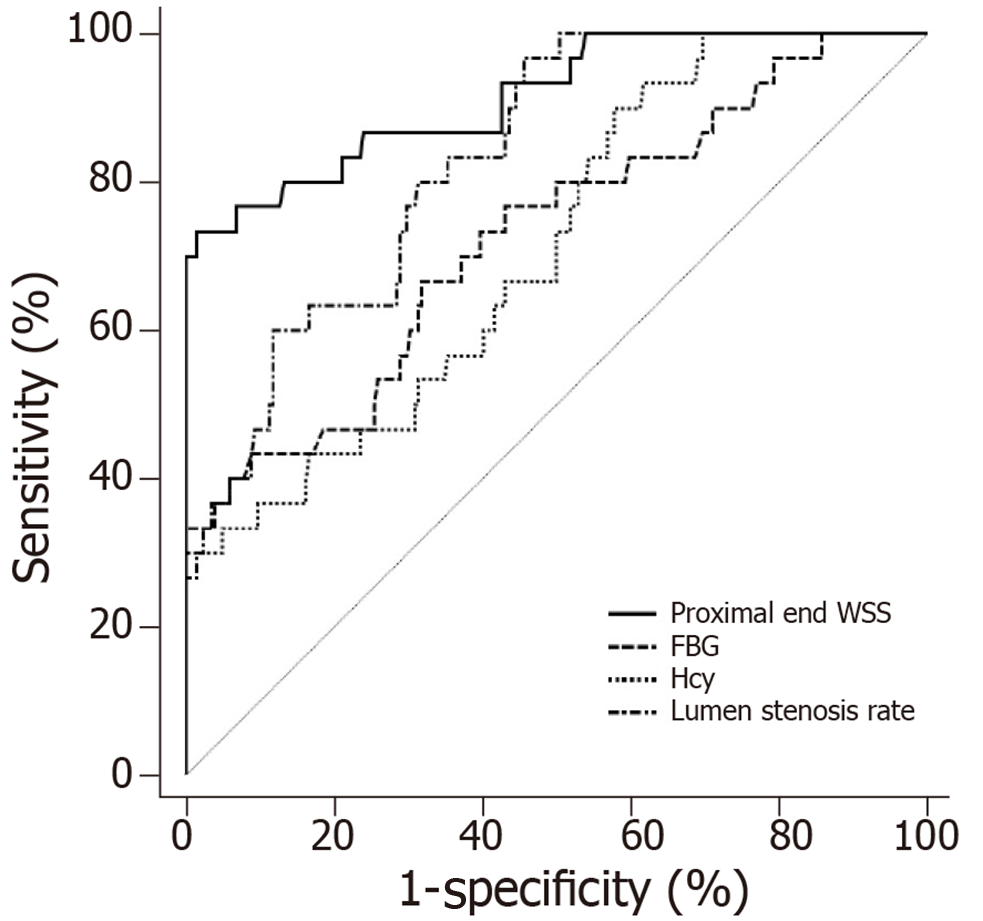
Figure 5 Receiver operating characteristic curve analysis of potential indicators for predicting transient ischemic attack individually.
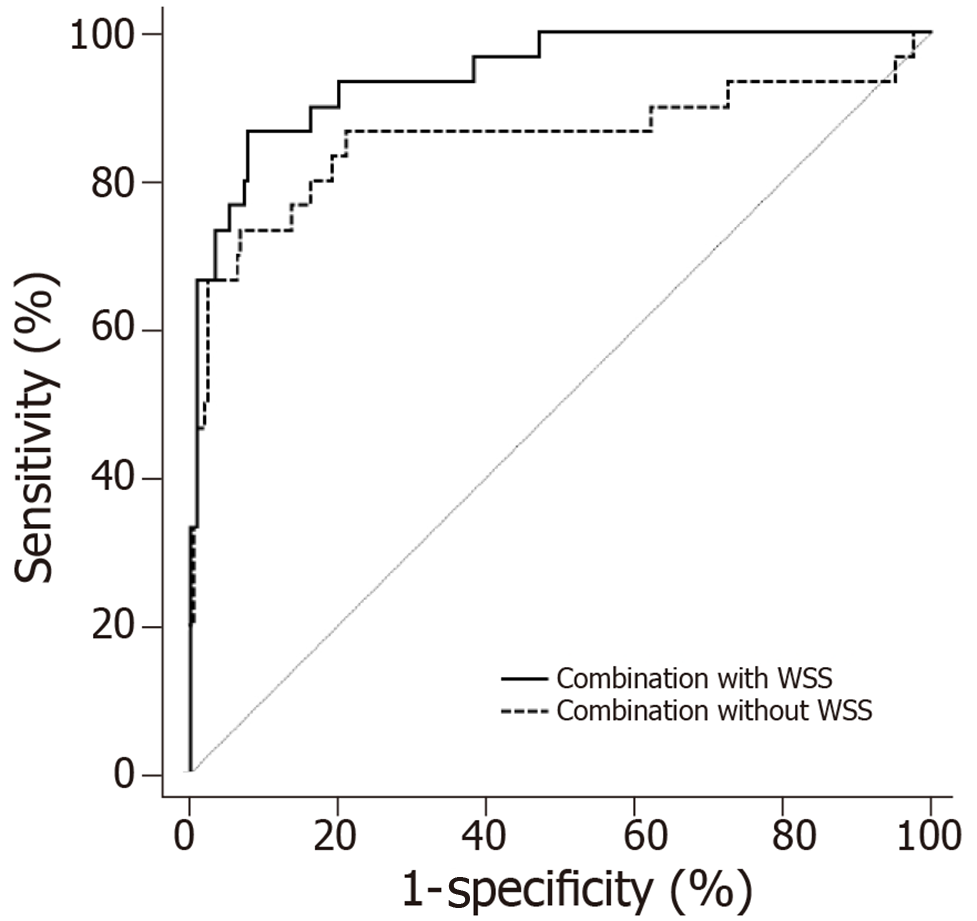
Figure 6 Receiver operating characteristic curves of combined indicator with wall shear stress vs combined indicator without wall shear stress.
- Citation: Liu QY, Duan Q, Fu XH, Jiang M, Xia HW, Wan YL. Wall shear stress can improve prediction accuracy for transient ischemic attack. World J Clin Cases 2019; 7(18): 2722-2733
- URL: https://www.wjgnet.com/2307-8960/full/v7/i18/2722.htm
- DOI: https://dx.doi.org/10.12998/wjcc.v7.i18.2722


