Copyright
©The Author(s) 2019.
World J Clin Cases. Aug 26, 2019; 7(16): 2176-2188
Published online Aug 26, 2019. doi: 10.12998/wjcc.v7.i16.2176
Published online Aug 26, 2019. doi: 10.12998/wjcc.v7.i16.2176
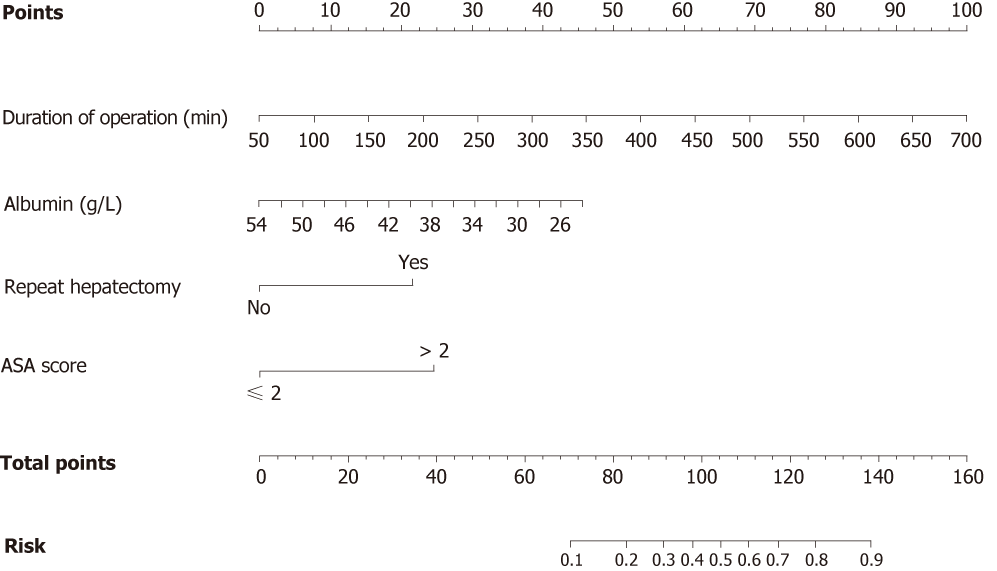
Figure 1 Nomogram predicting the probability of surgical site infection occurrence in patients undergoing hepatectomy.
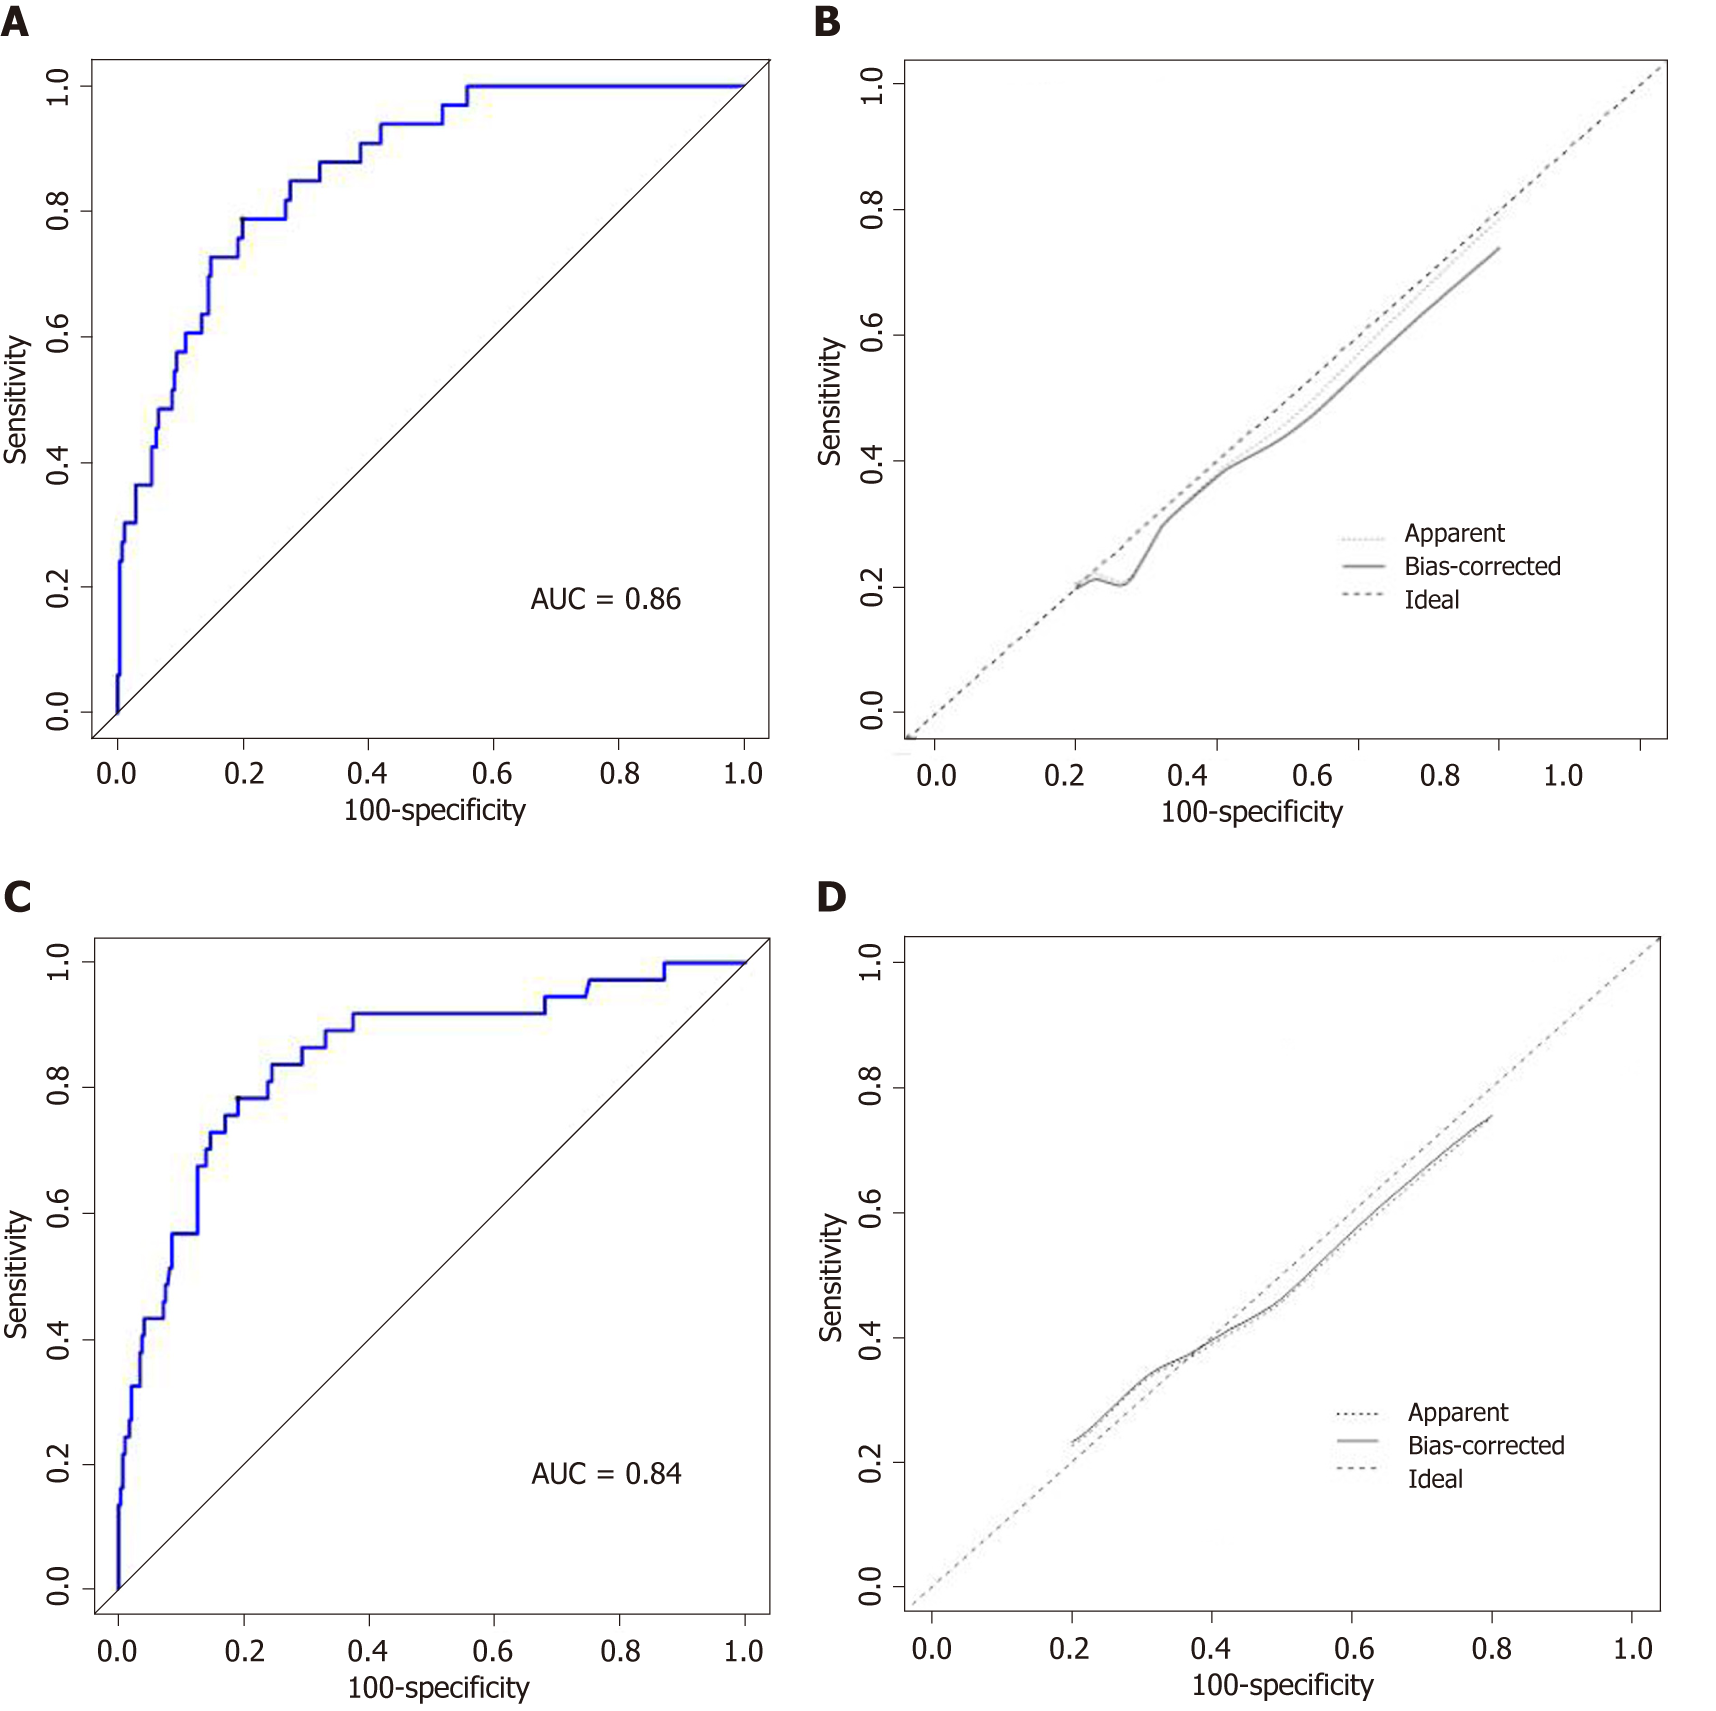
Figure 2 Receiver operating characteristic curve of nomogram prediction in the training cohort (AUC = 0.
86) (A) and in the training cohort (AUC = 0.84) (B) Calibration curve of nomogram prediction in the training cohort (C) and validation cohort (D). ROC: Receiver operating characteristic; AUC: Area under the ROC curve.
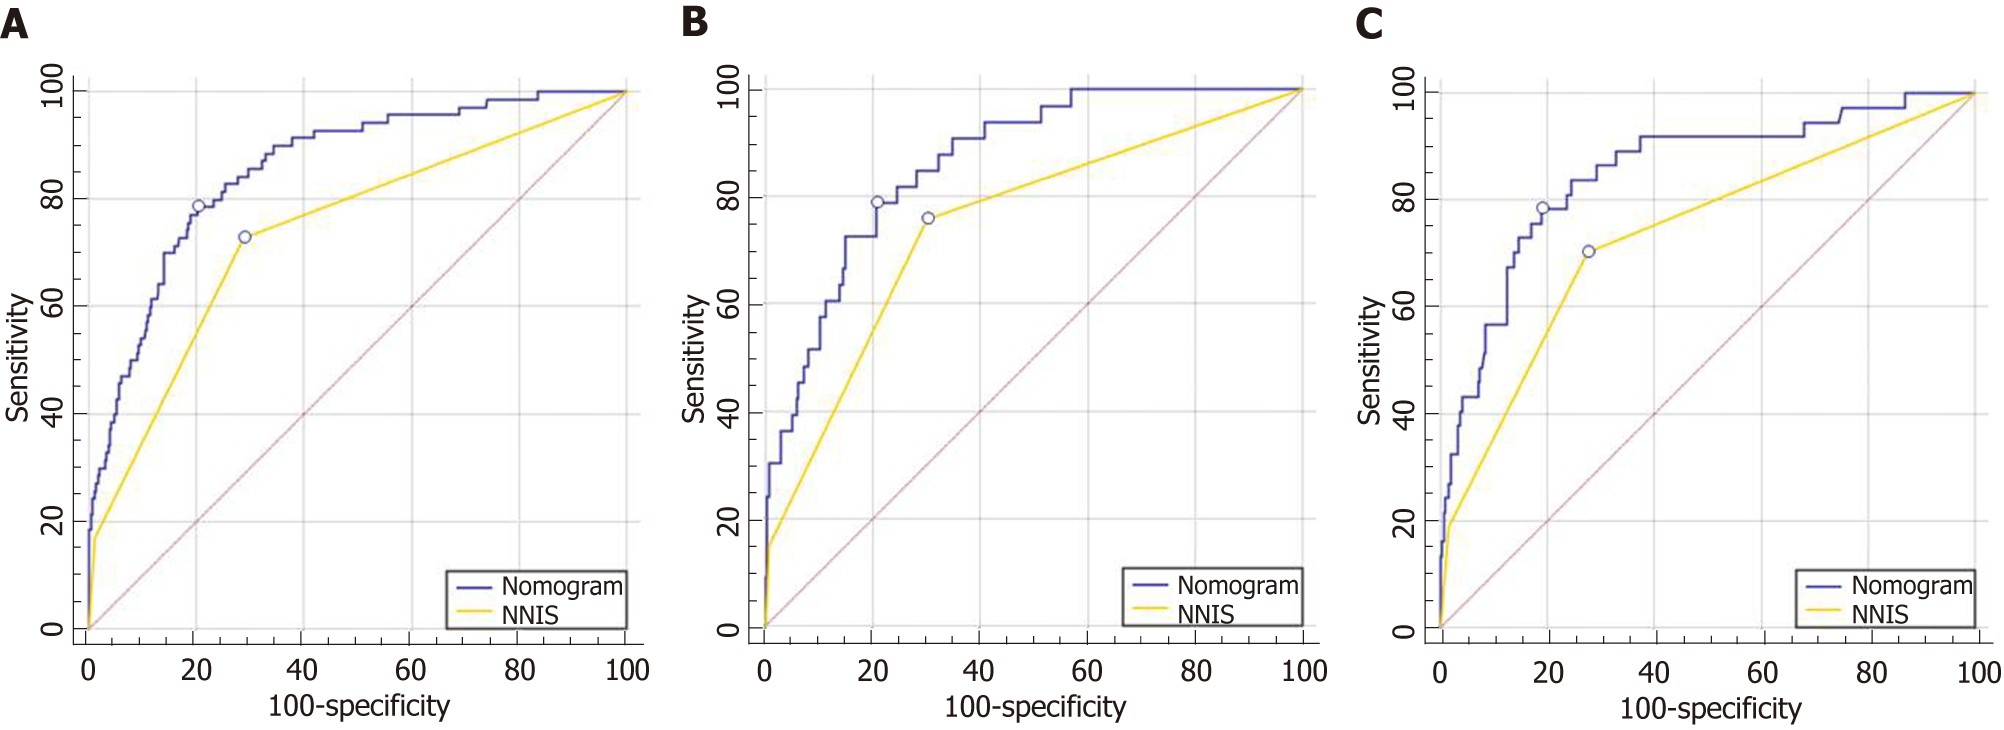
Figure 3 Receiver operating characteristic curve of prediction with the nomogram and the NNIS risk index.
The area under the ROC curve (AUC) for the NNIS risk index was 0.75 for the entire population, 0.75 for the training cohort, and 0.73 for the validation cohort. The AUC for the nomogram was 0.86 for the training cohort, 0.84 for the validation cohort, and 0.85 for the entire population.
- Citation: Tang TY, Zong Y, Shen YN, Guo CX, Zhang XZ, Zou XW, Yao WY, Liang TB, Bai XL. Predicting surgical site infections using a novel nomogram in patients with hepatocelluar carcinoma undergoing hepatectomy. World J Clin Cases 2019; 7(16): 2176-2188
- URL: https://www.wjgnet.com/2307-8960/full/v7/i16/2176.htm
- DOI: https://dx.doi.org/10.12998/wjcc.v7.i16.2176


