Copyright
©The Author(s) 2019.
World J Clin Cases. Jul 6, 2019; 7(13): 1686-1695
Published online Jul 6, 2019. doi: 10.12998/wjcc.v7.i13.1686
Published online Jul 6, 2019. doi: 10.12998/wjcc.v7.i13.1686
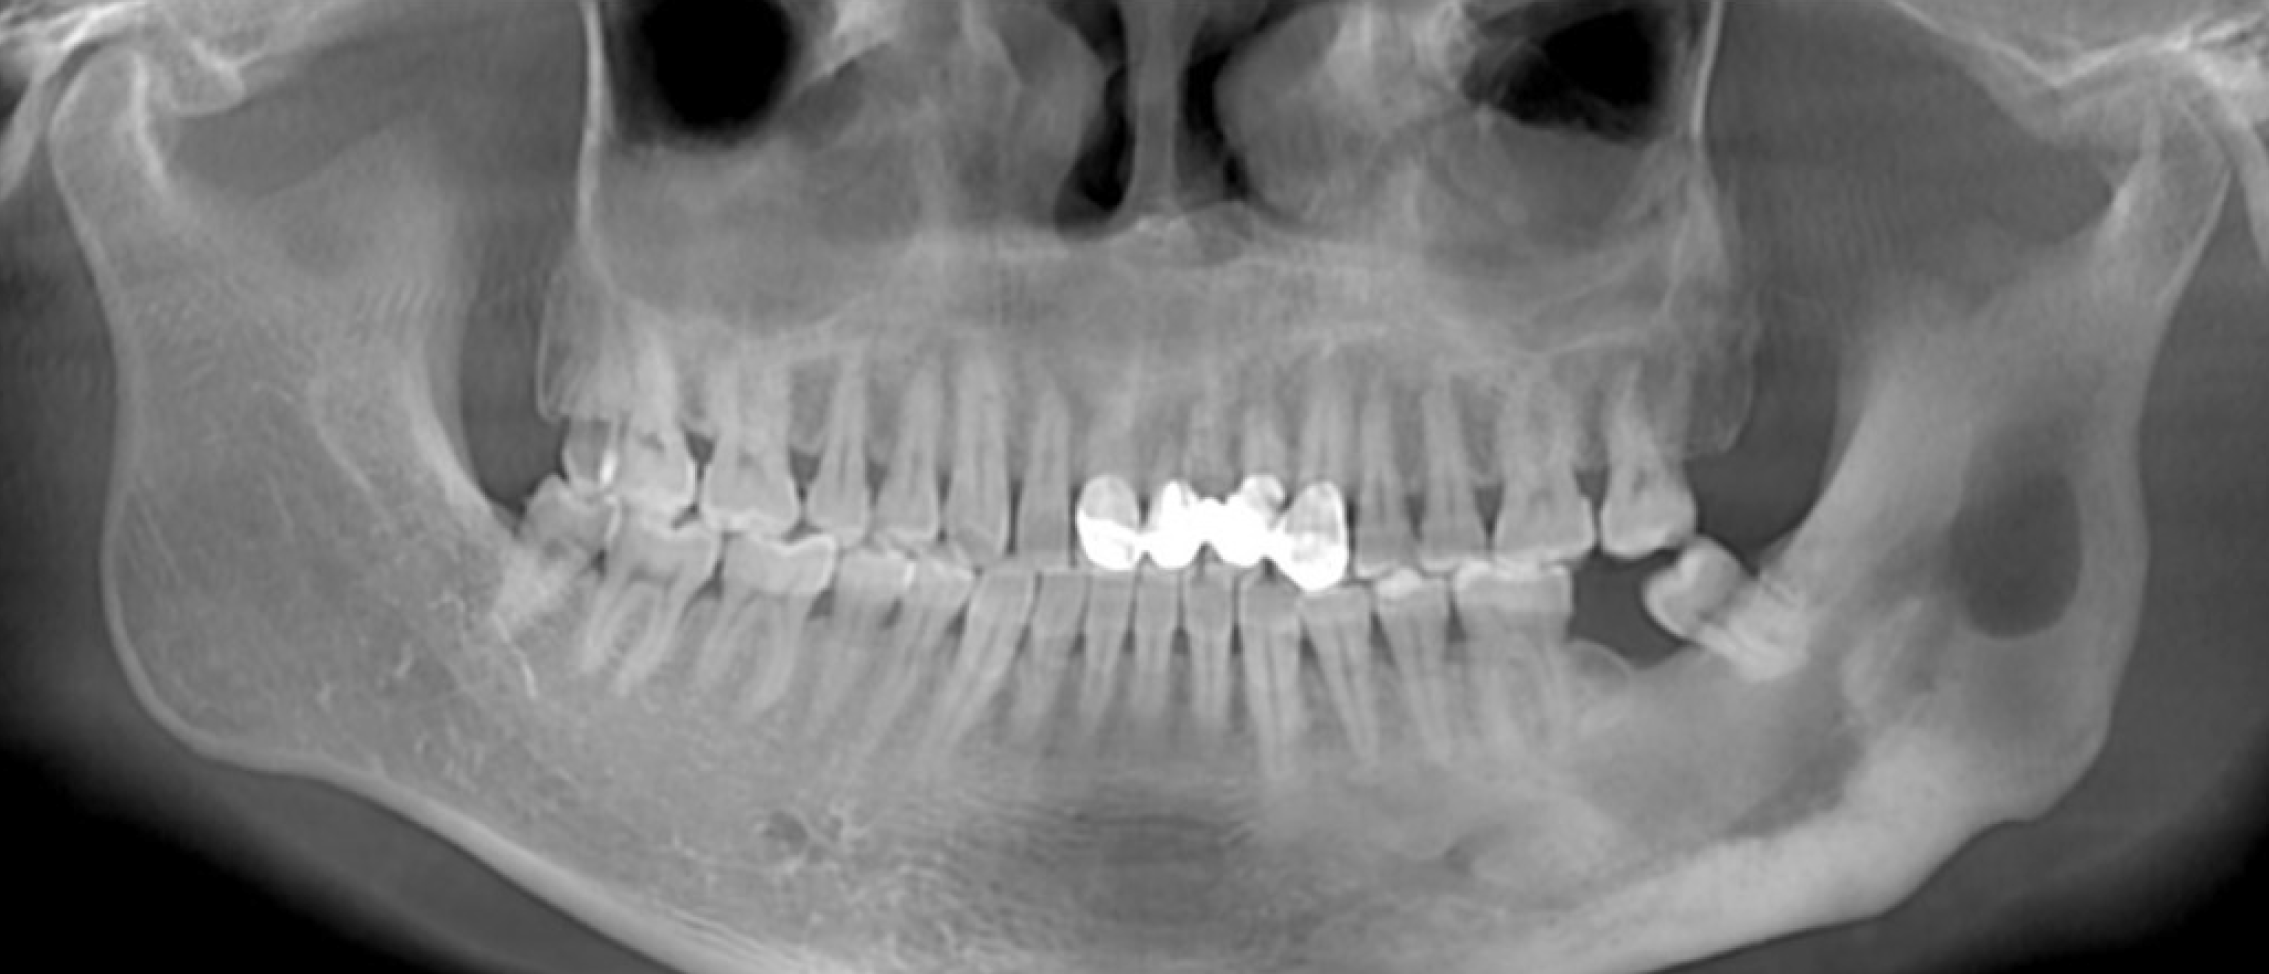
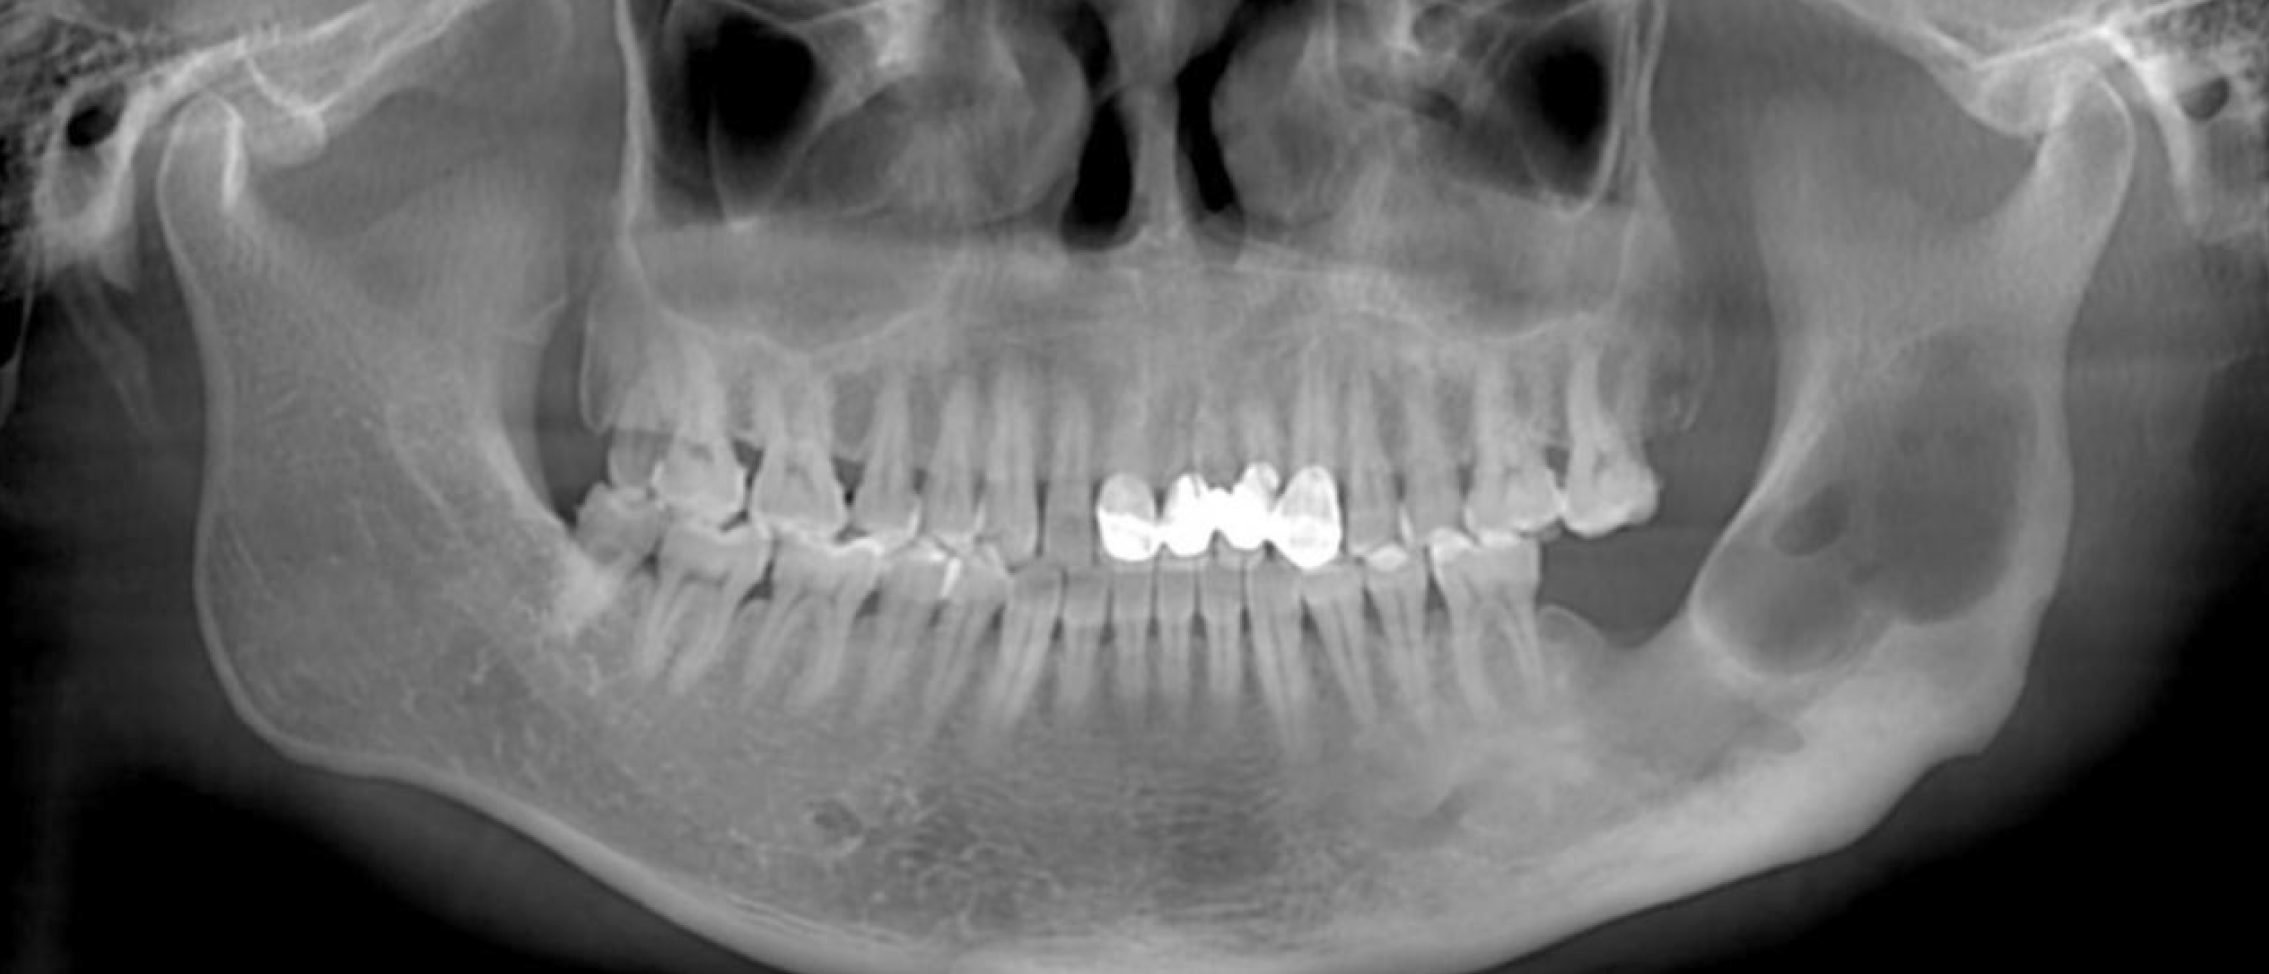
Figure 1 Orthopantomogram showed a lesion in the left mandibular gonial area and ramus with decreased density, which measured 14 mm × 32 mm × 60 mm (anterior/posterior × left/right × cranial/caudal) (August 2018, third recurrence).
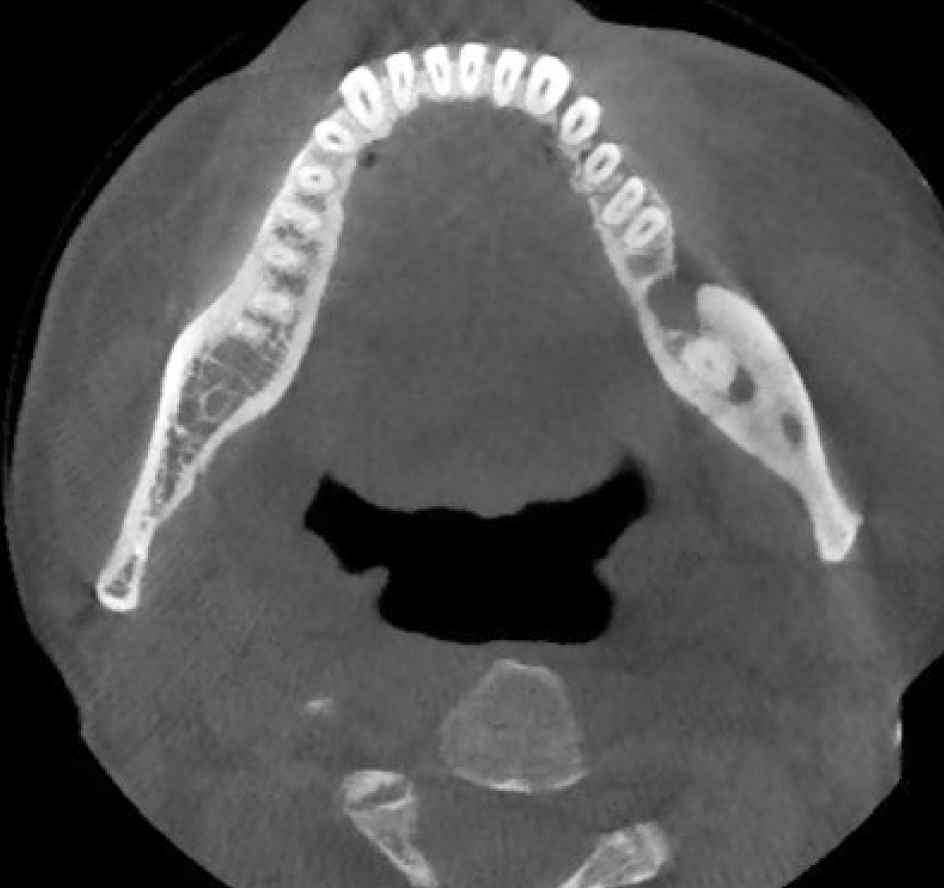
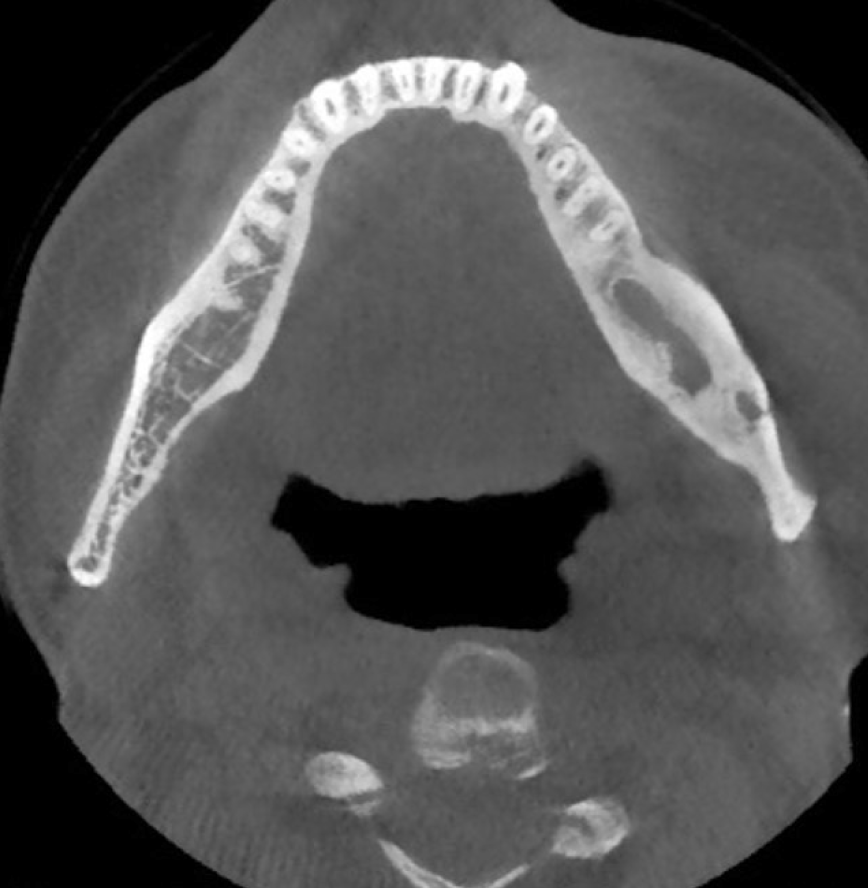
Figure 2 Axial plane view showing cystic lesion with irregular boundaries in the mandible (August 2018, third recurrence).
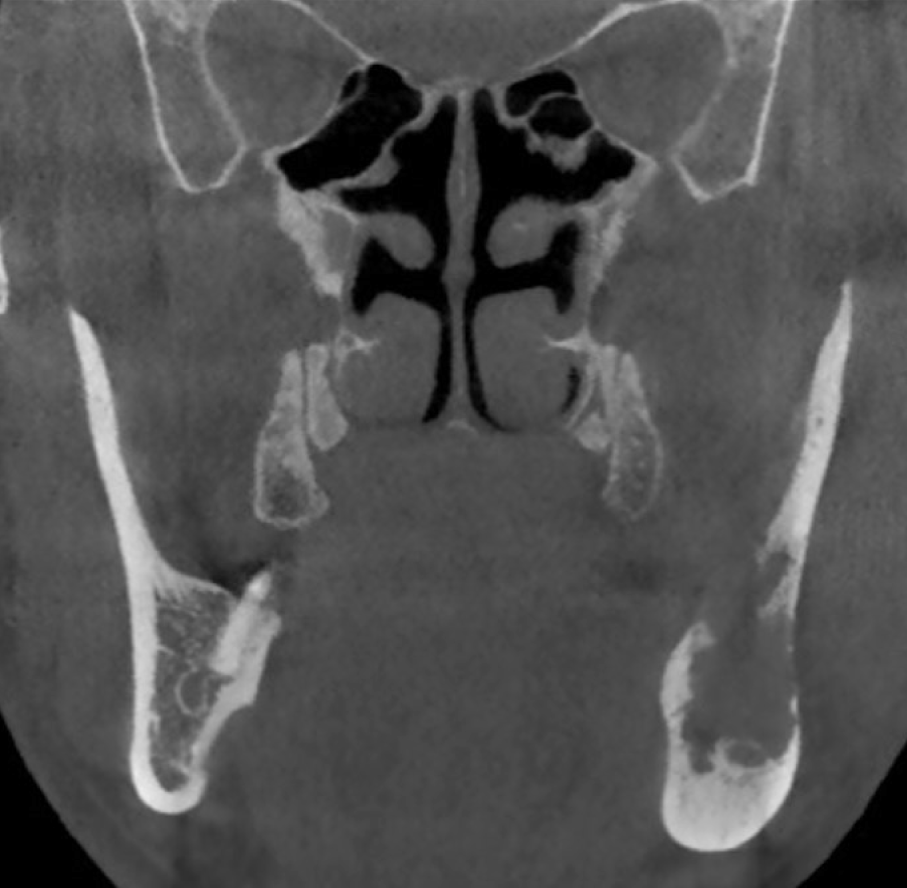
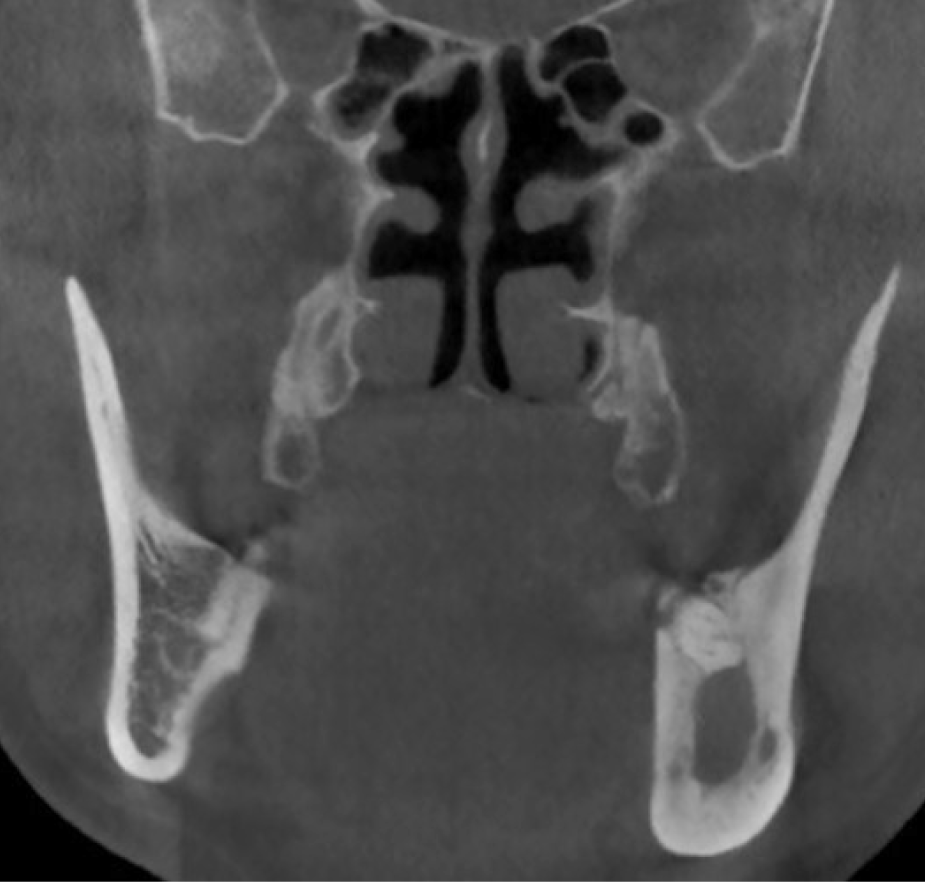
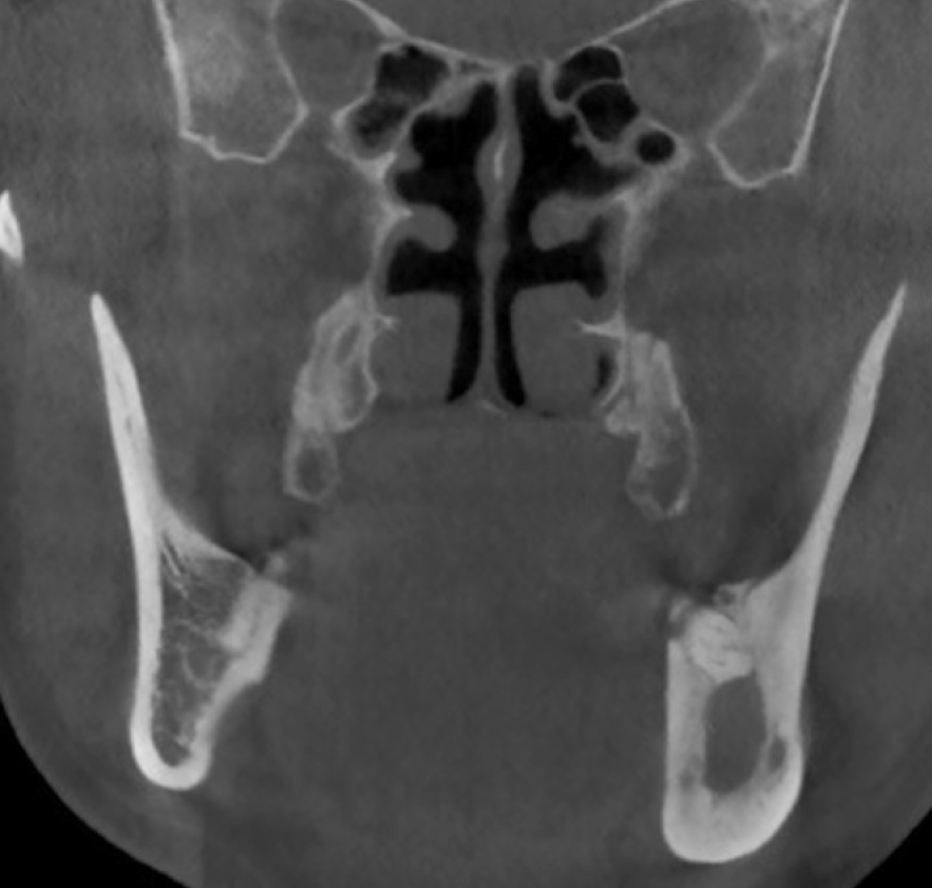
Figure 3 Coronal plane view showing the mandibular cortex was invaded by the cystic lesion (August 2018, third recurrence).
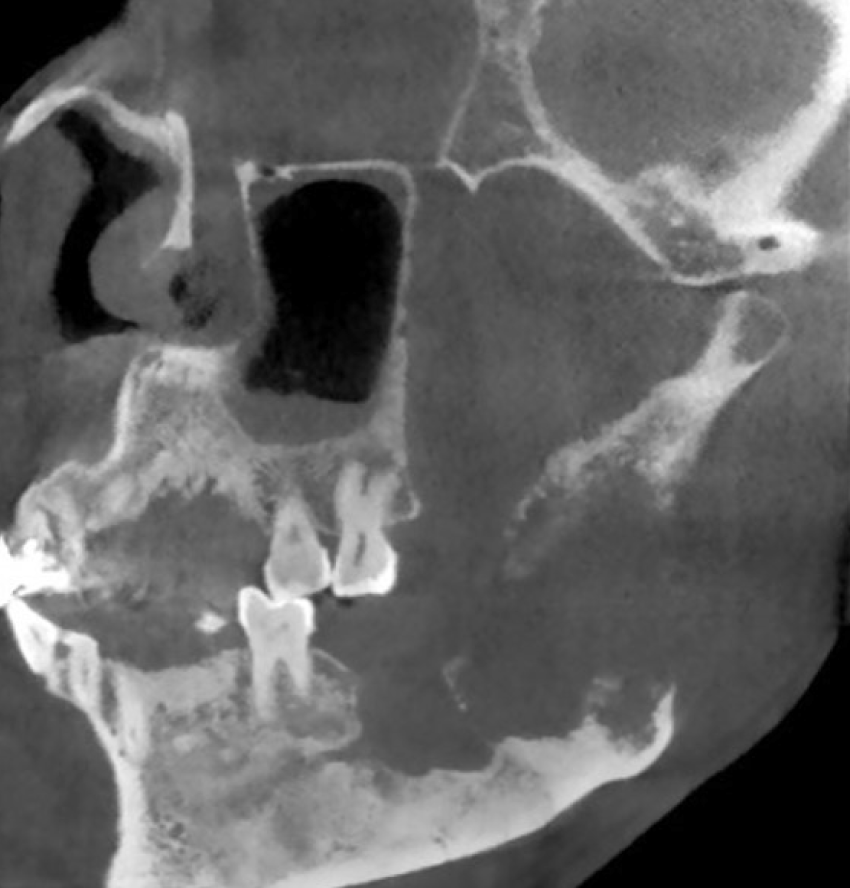
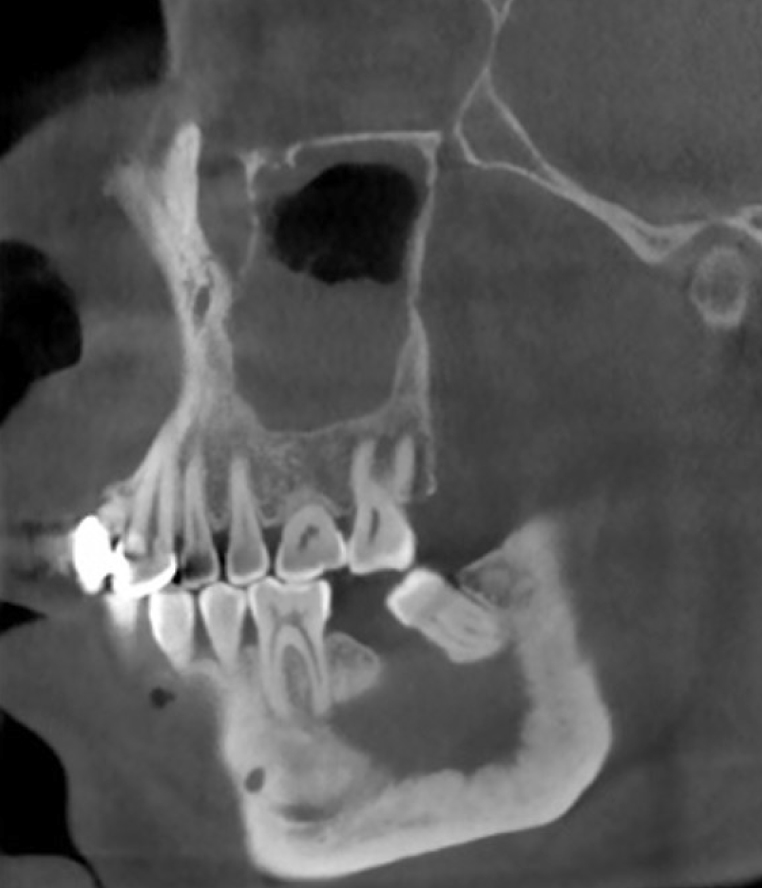
Figure 4 Sagittal plane view showing the left mandible was significantly damaged and teeth 37 and 38 were lost (August 2018, third recurrence).
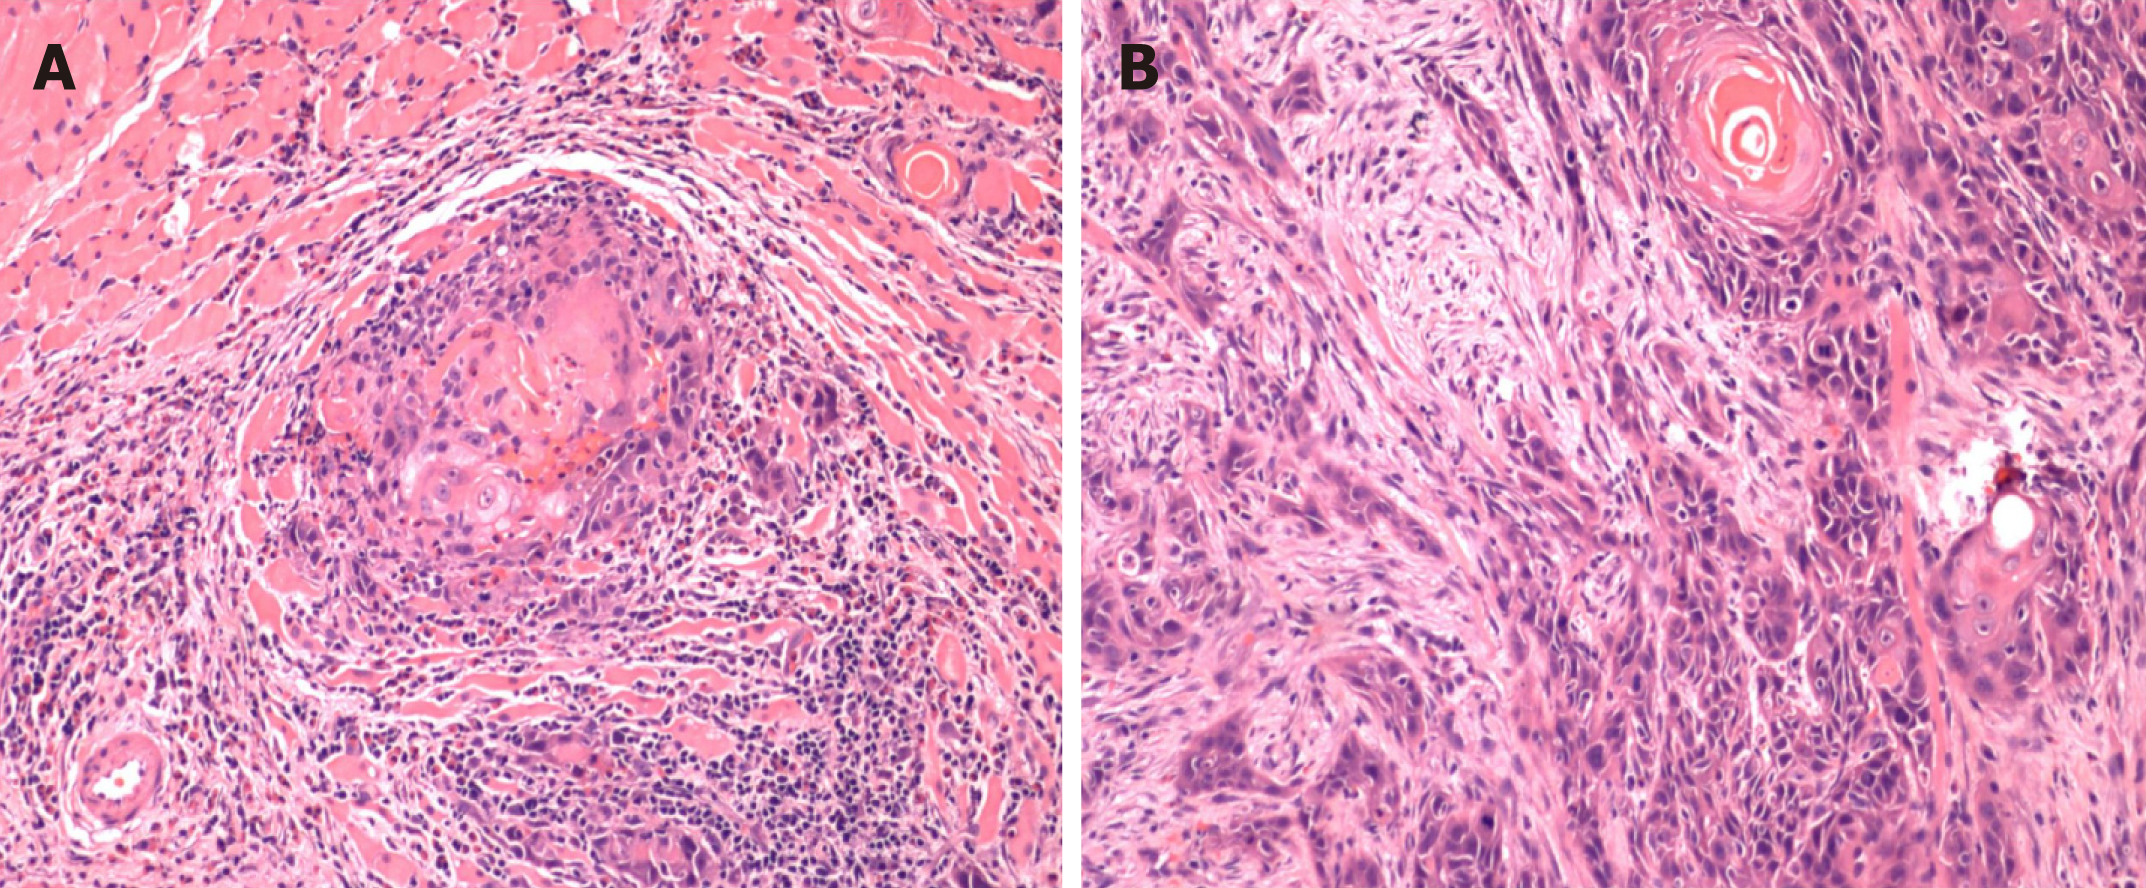
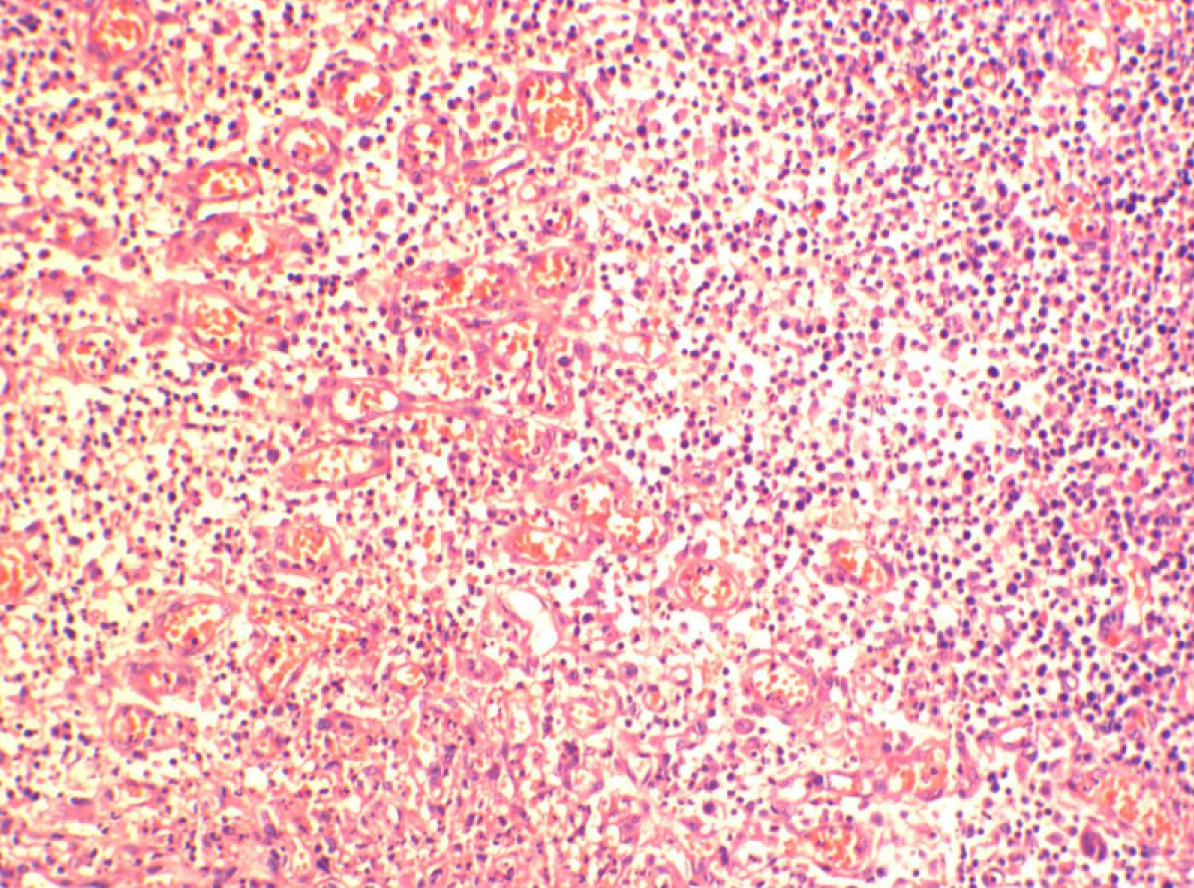
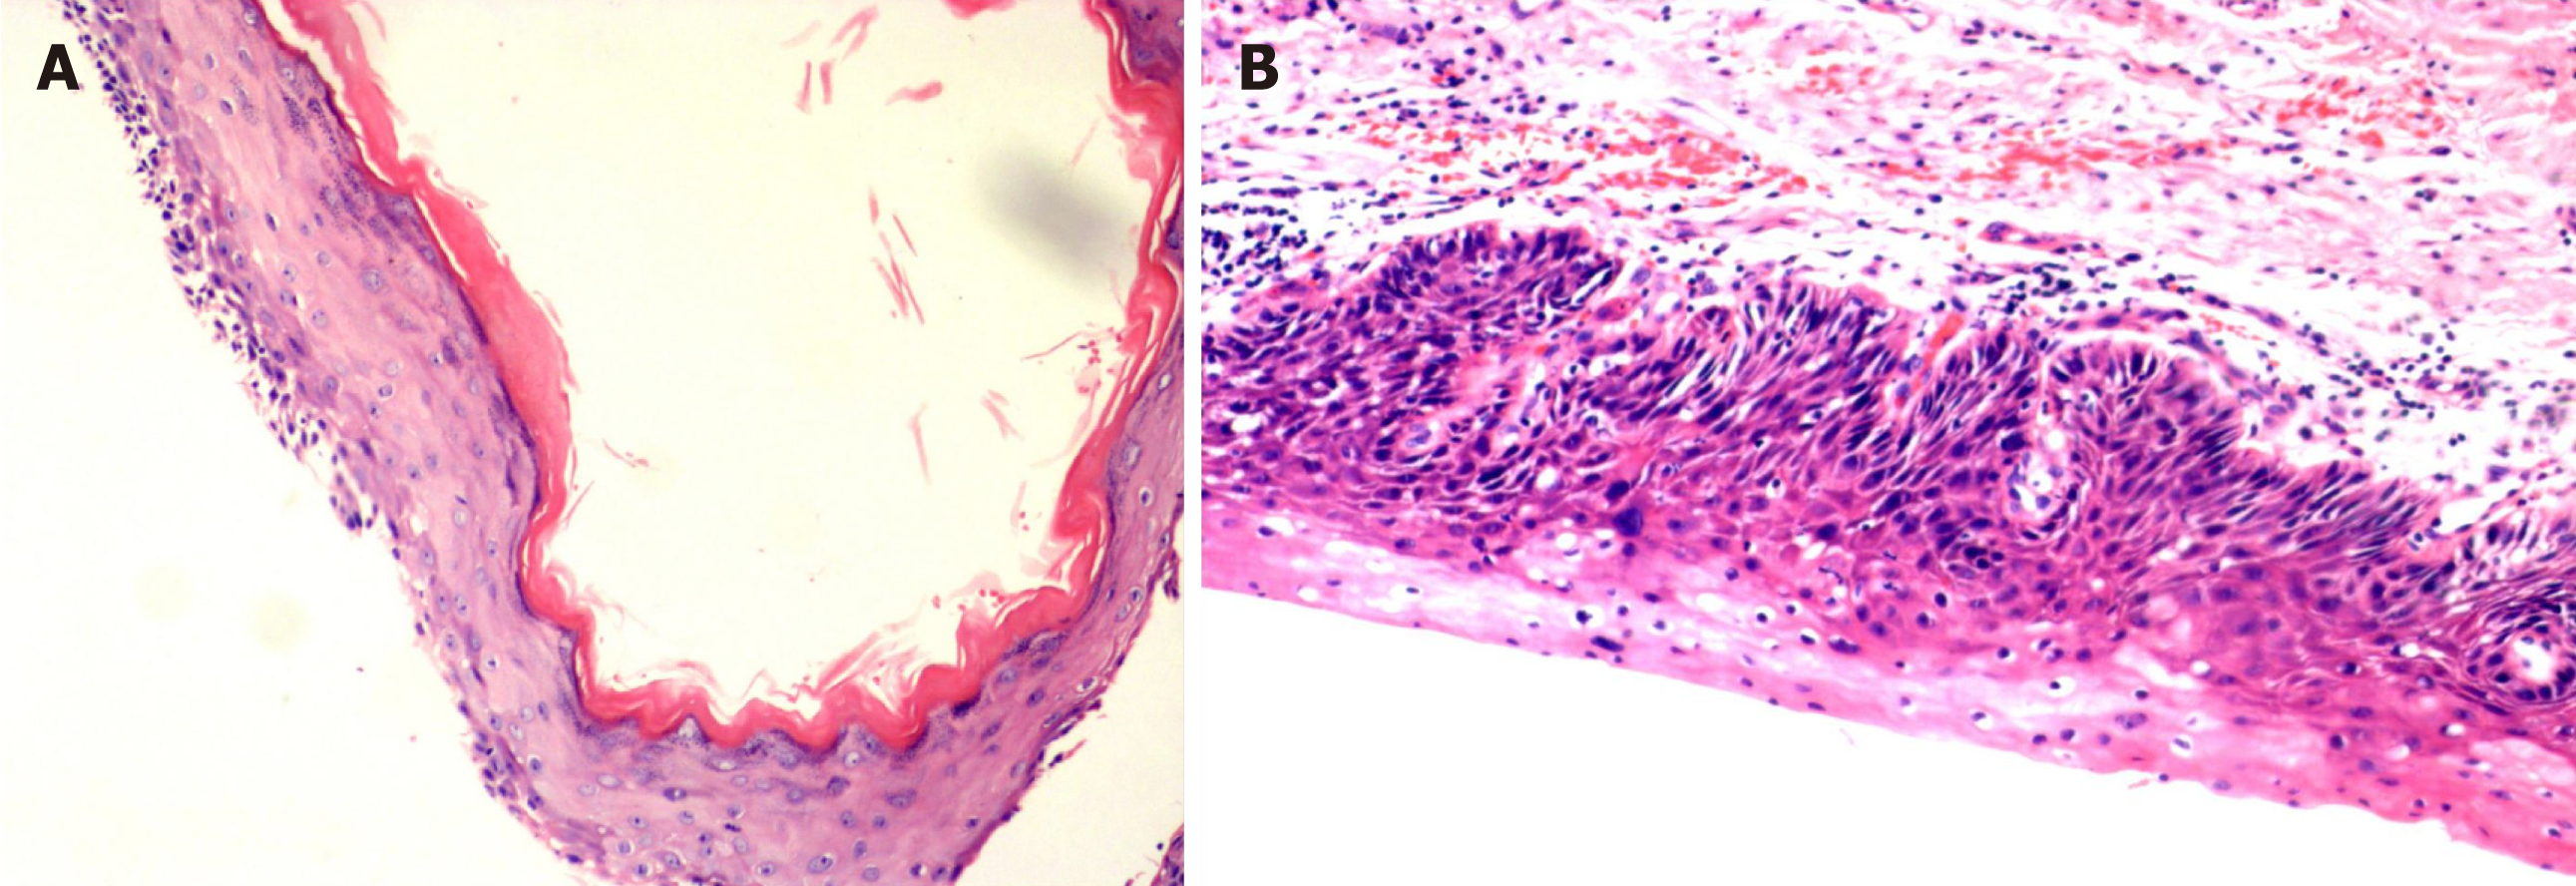
Figure 5 Pathological examination of disease tissue.
A: Moderately differentiated SCC, pleomorphic nests of squamous cells infiltrated the tissue; B: Mass of squamous cells penetrated the vascular wall. August 2018, third recurrence.
Figure 6 Orthopantomogram from cone beam computed tomography of the left mandibular angle and ramus: the cyst boundary was clear, and tooth 37 was lost (January 2013, first visit).
Figure 7 Axial plane of cone beam computed tomography showing the cyst lesion limited in the region of lost tooth 37 with clear margin (January 2013, first visit).
Figure 8 Coronal plane of cone beam computed tomography showing the cortical bone around the cyst incrassates but not damaged (January 2013, first visit).
Figure 9 Sagittal plane of cone beam computed tomography showing a cystic lesion with clear boundaries (January 2013, first visit).
Figure 10 Pathological examination of the lesion tissue consisting of granulation and inflammatory cells (January 2013, first visit).
Figure 11 Orthopantomogram showing the cystic lesion in the left mandible angle and ramus, with area of decreased density measuring 15 mm × 25 mm × 41 mm (anterior/posterior × left/right × cranial/caudal) (February 2017, second recurrence).
Figure 12 Axial plane view of cone beam computed tomography showing that the cystic lesion was larger than in the previous image (February 2017, second recurrence).
Figure 13 Coronal plane view of cone beam computed tomography showing a regular-shaped cyst with clear boundaries (February 2017, second recurrence).
Figure 14 Sagittal plane of cone beam computed tomography showing a cyst involving the previous positions of teeth 37 and 38 (February 2017, second recurrence).
Figure 15 Pathological examination of the disease tissue showing a cyst with thick “onion-like skin” uniform orthokeratinized squamous epithelial lining (A) or mild-to-moderate epithelial dysplasia of the local lesion (B) (February 2017, second recurrence).
- Citation: Wu RY, Shao Z, Wu TF. Chronic progression of recurrent orthokeratinized odontogenic cyst into squamous cell carcinoma: A case report. World J Clin Cases 2019; 7(13): 1686-1695
- URL: https://www.wjgnet.com/2307-8960/full/v7/i13/1686.htm
- DOI: https://dx.doi.org/10.12998/wjcc.v7.i13.1686


