Copyright
©The Author(s) 2019.
World J Clin Cases. Jul 6, 2019; 7(13): 1660-1670
Published online Jul 6, 2019. doi: 10.12998/wjcc.v7.i13.1660
Published online Jul 6, 2019. doi: 10.12998/wjcc.v7.i13.1660
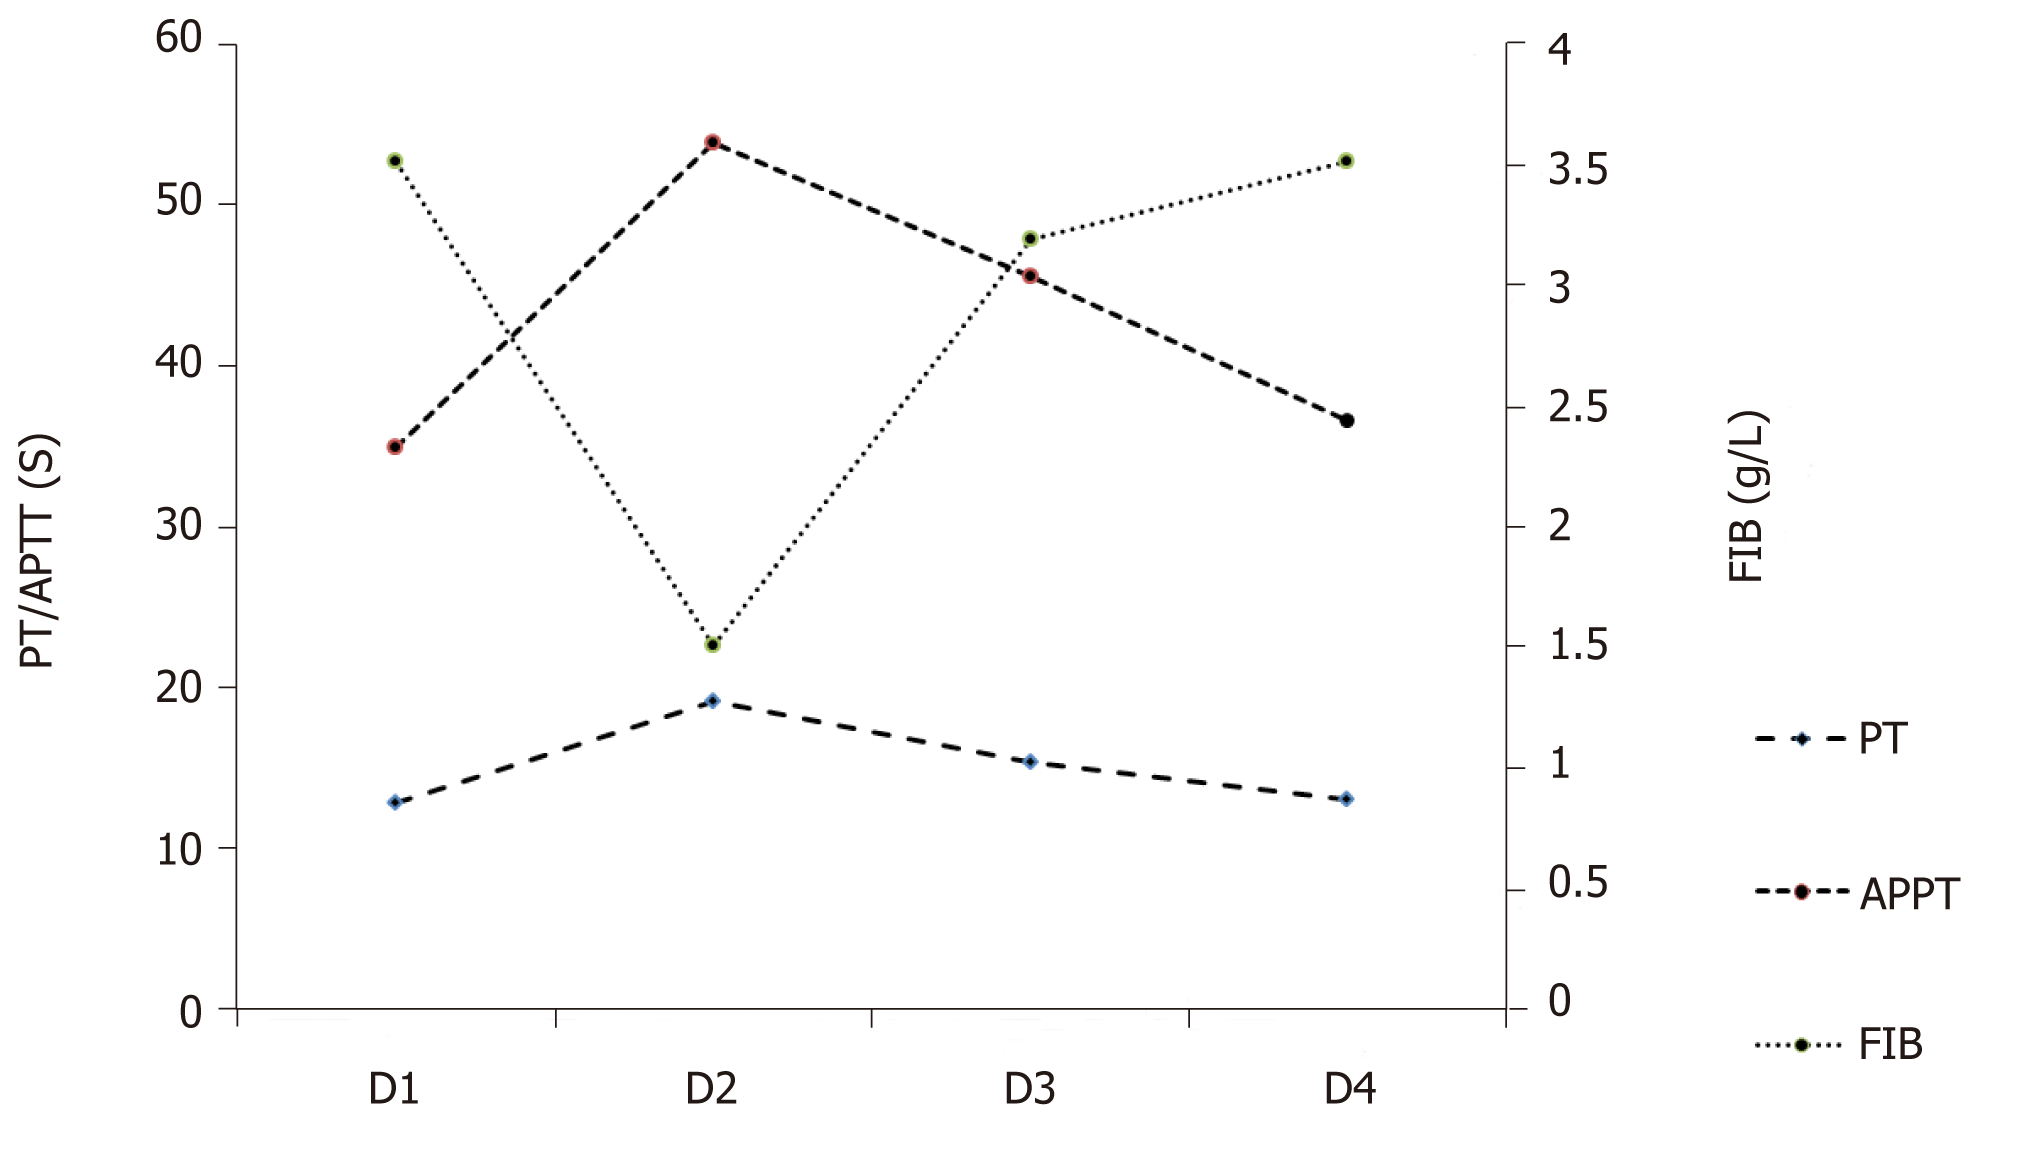
Figure 1 The variations of prothrombin time, activated partial thromboplastin time and fibrinogen as a function of time from day 1 to day 4.
PT: Prothrombin time; APTT: Activated partial thromboplastin time; Fib: Fibrinogen.
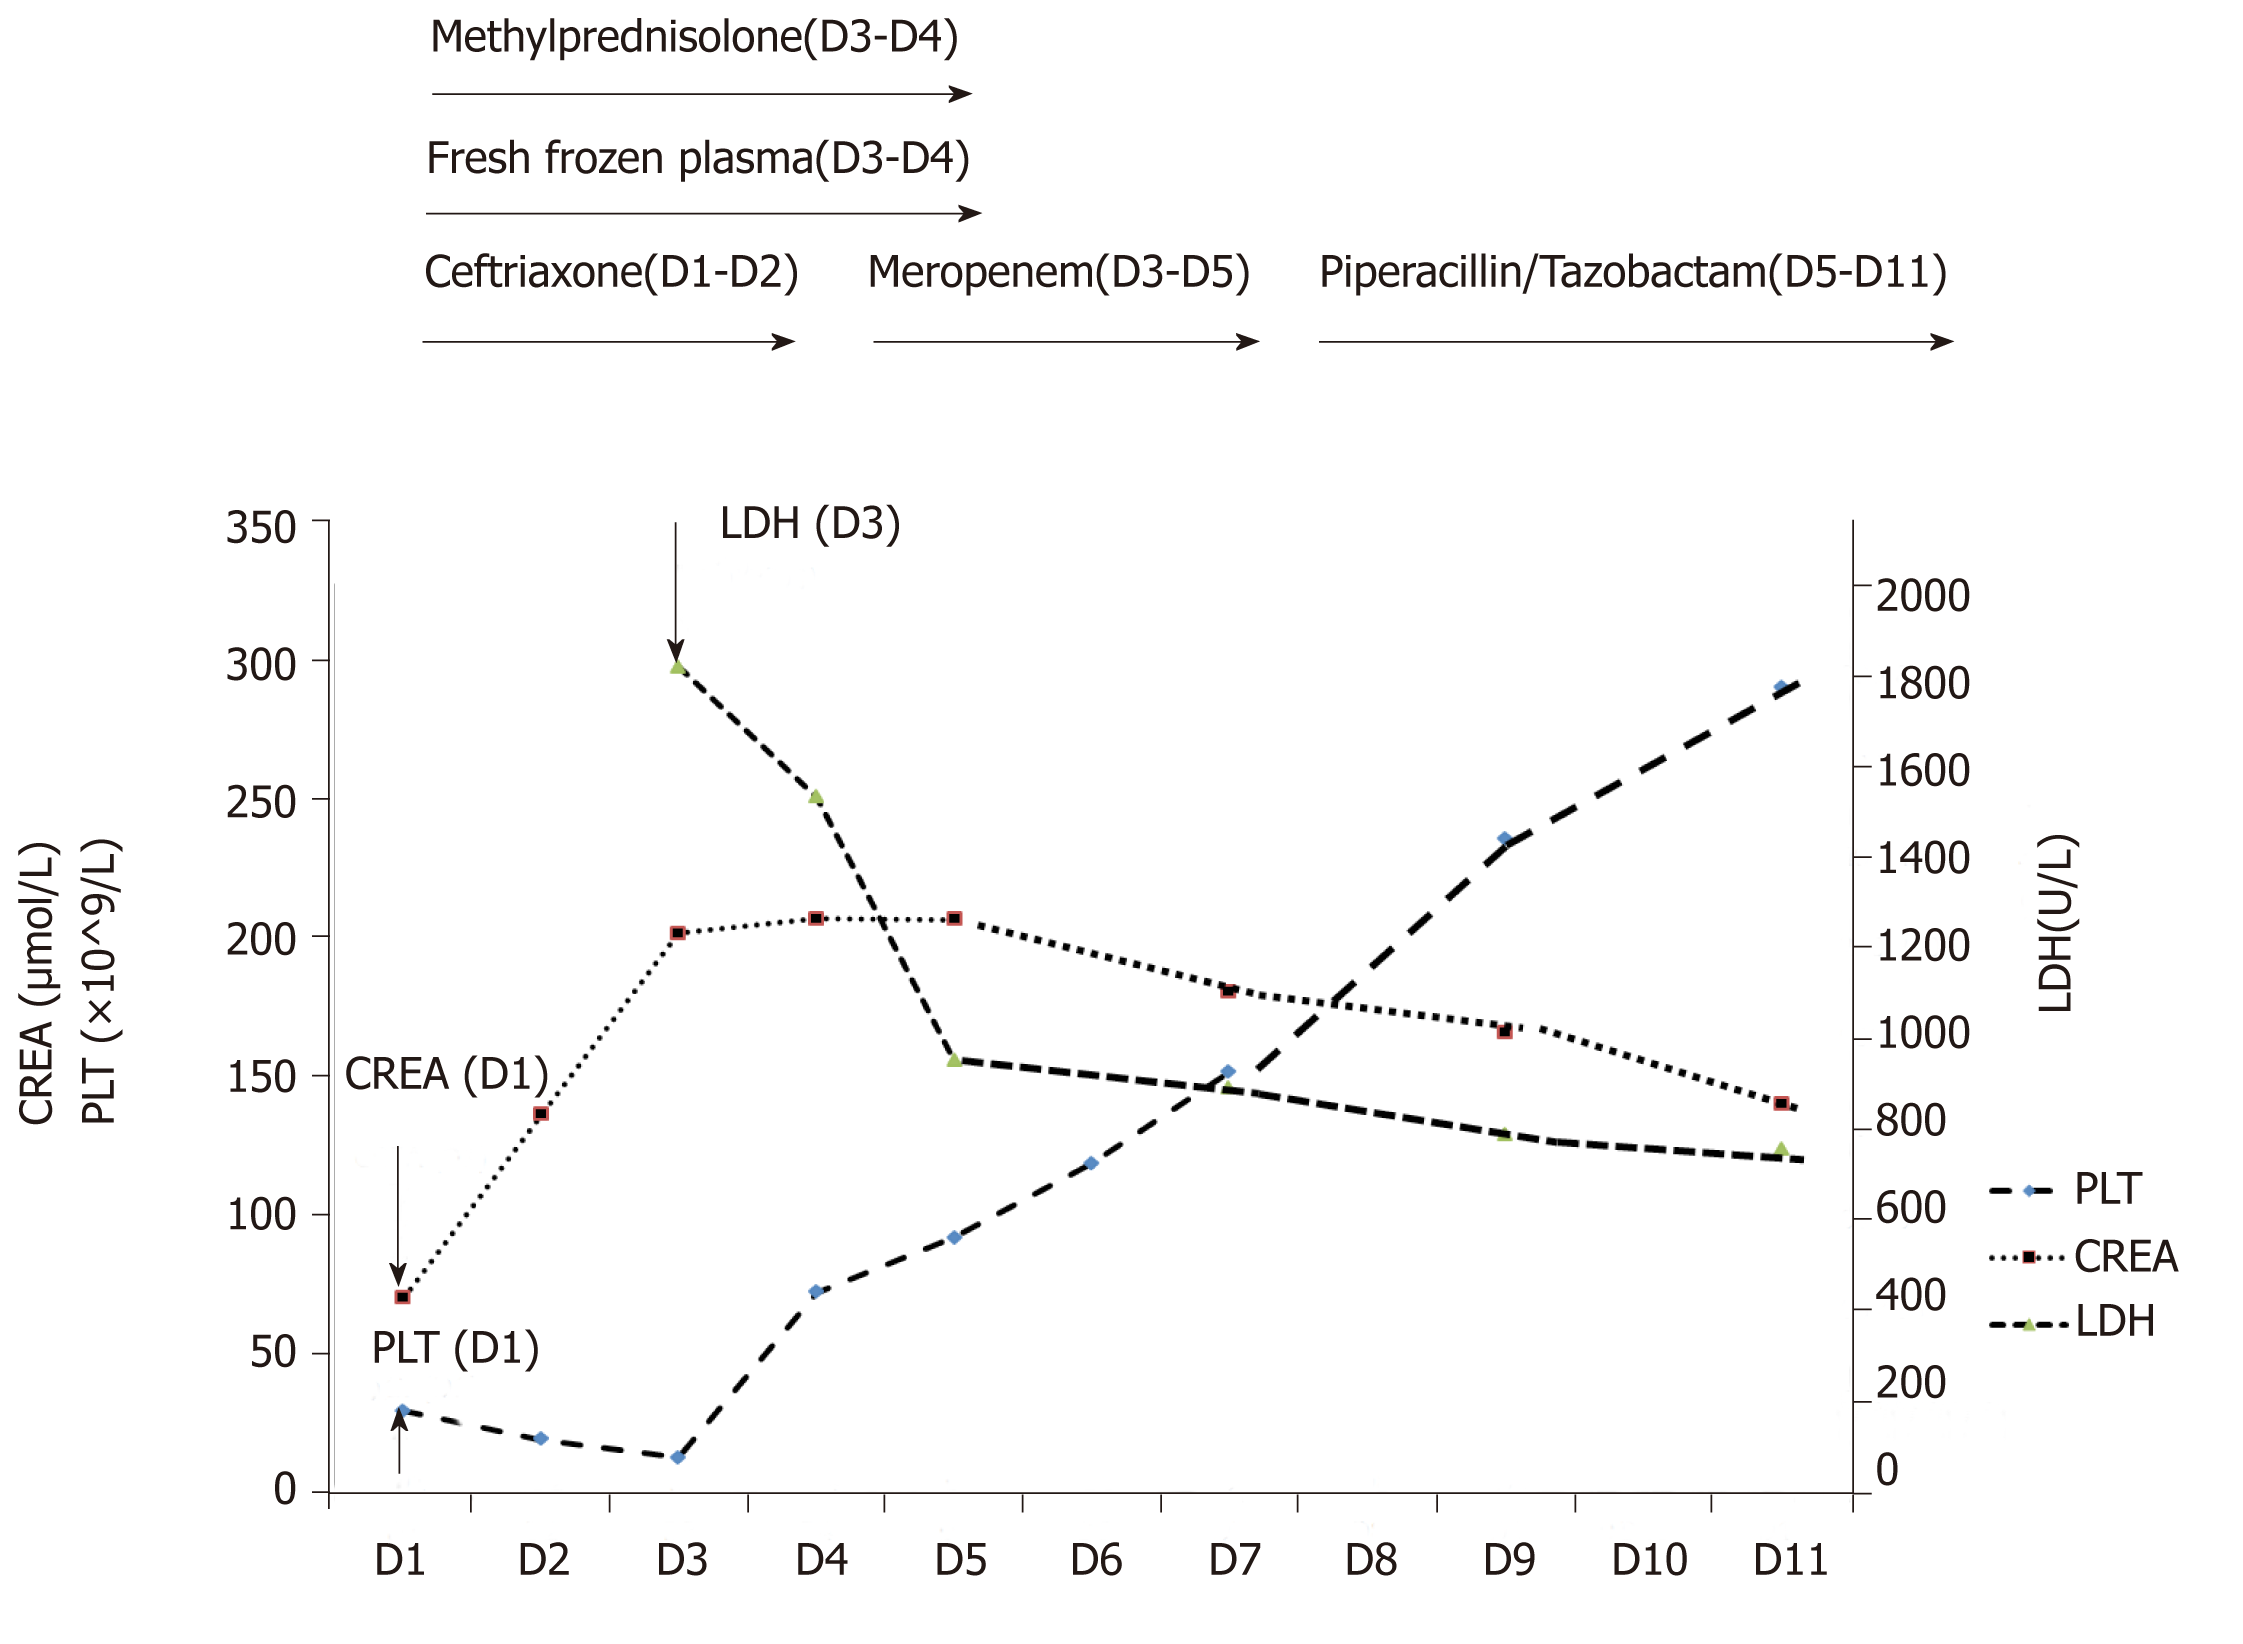
Figure 2 The variations of platelet, creatinine and lactate dehydrogenase as a function of time and interventions from day 1 to day 11.
PLT: Platelet; CREA: Creatinine; LDH: Lactate dehydrogenase.
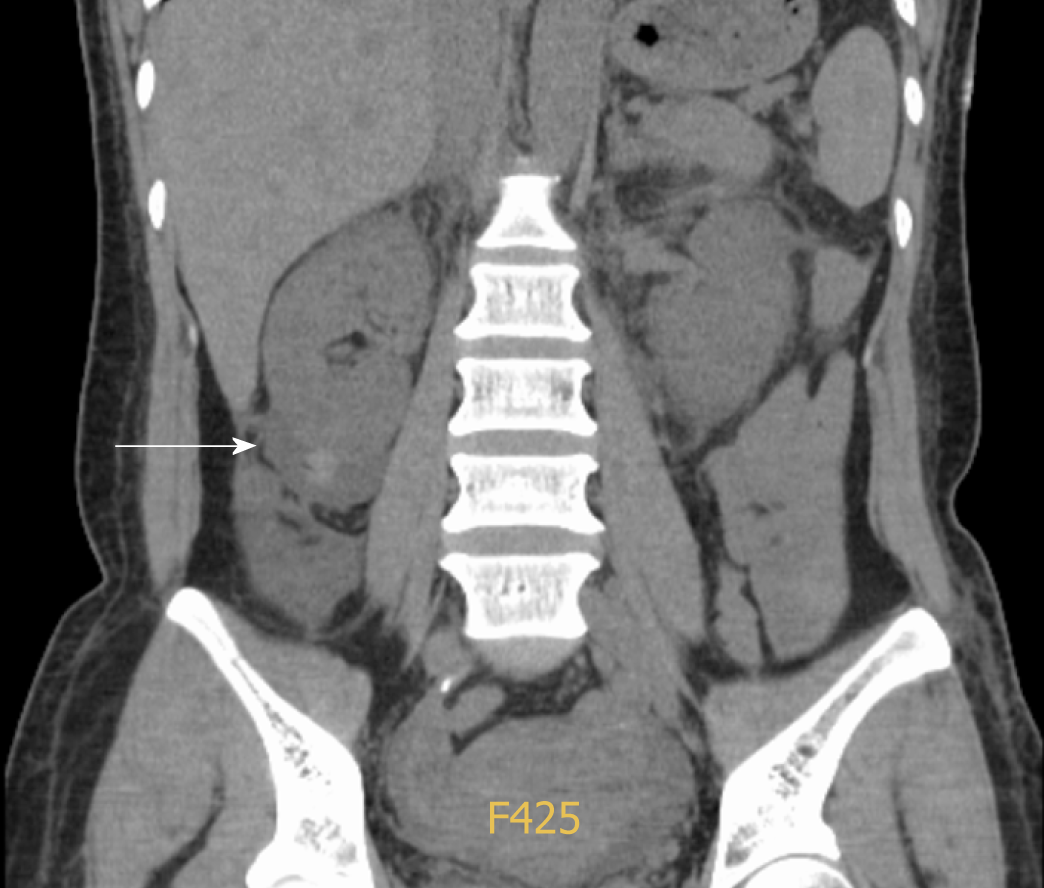
Figure 3 Abdominal computed tomography scan.
The arrow indicates the area of hematoma around the lower right kidney.
- Citation: Li XY, Mai YF, Huang J, Pai P. Gastrointestinal infection-related disseminated intravascular coagulation mimicking Shiga toxin-mediated hemolytic uremic syndrome - implications of classical clinical indexes in making the diagnosis: A case report and literature review. World J Clin Cases 2019; 7(13): 1660-1670
- URL: https://www.wjgnet.com/2307-8960/full/v7/i13/1660.htm
- DOI: https://dx.doi.org/10.12998/wjcc.v7.i13.1660


