Copyright
©The Author(s) 2019.
World J Clin Cases. Jul 6, 2019; 7(13): 1611-1622
Published online Jul 6, 2019. doi: 10.12998/wjcc.v7.i13.1611
Published online Jul 6, 2019. doi: 10.12998/wjcc.v7.i13.1611
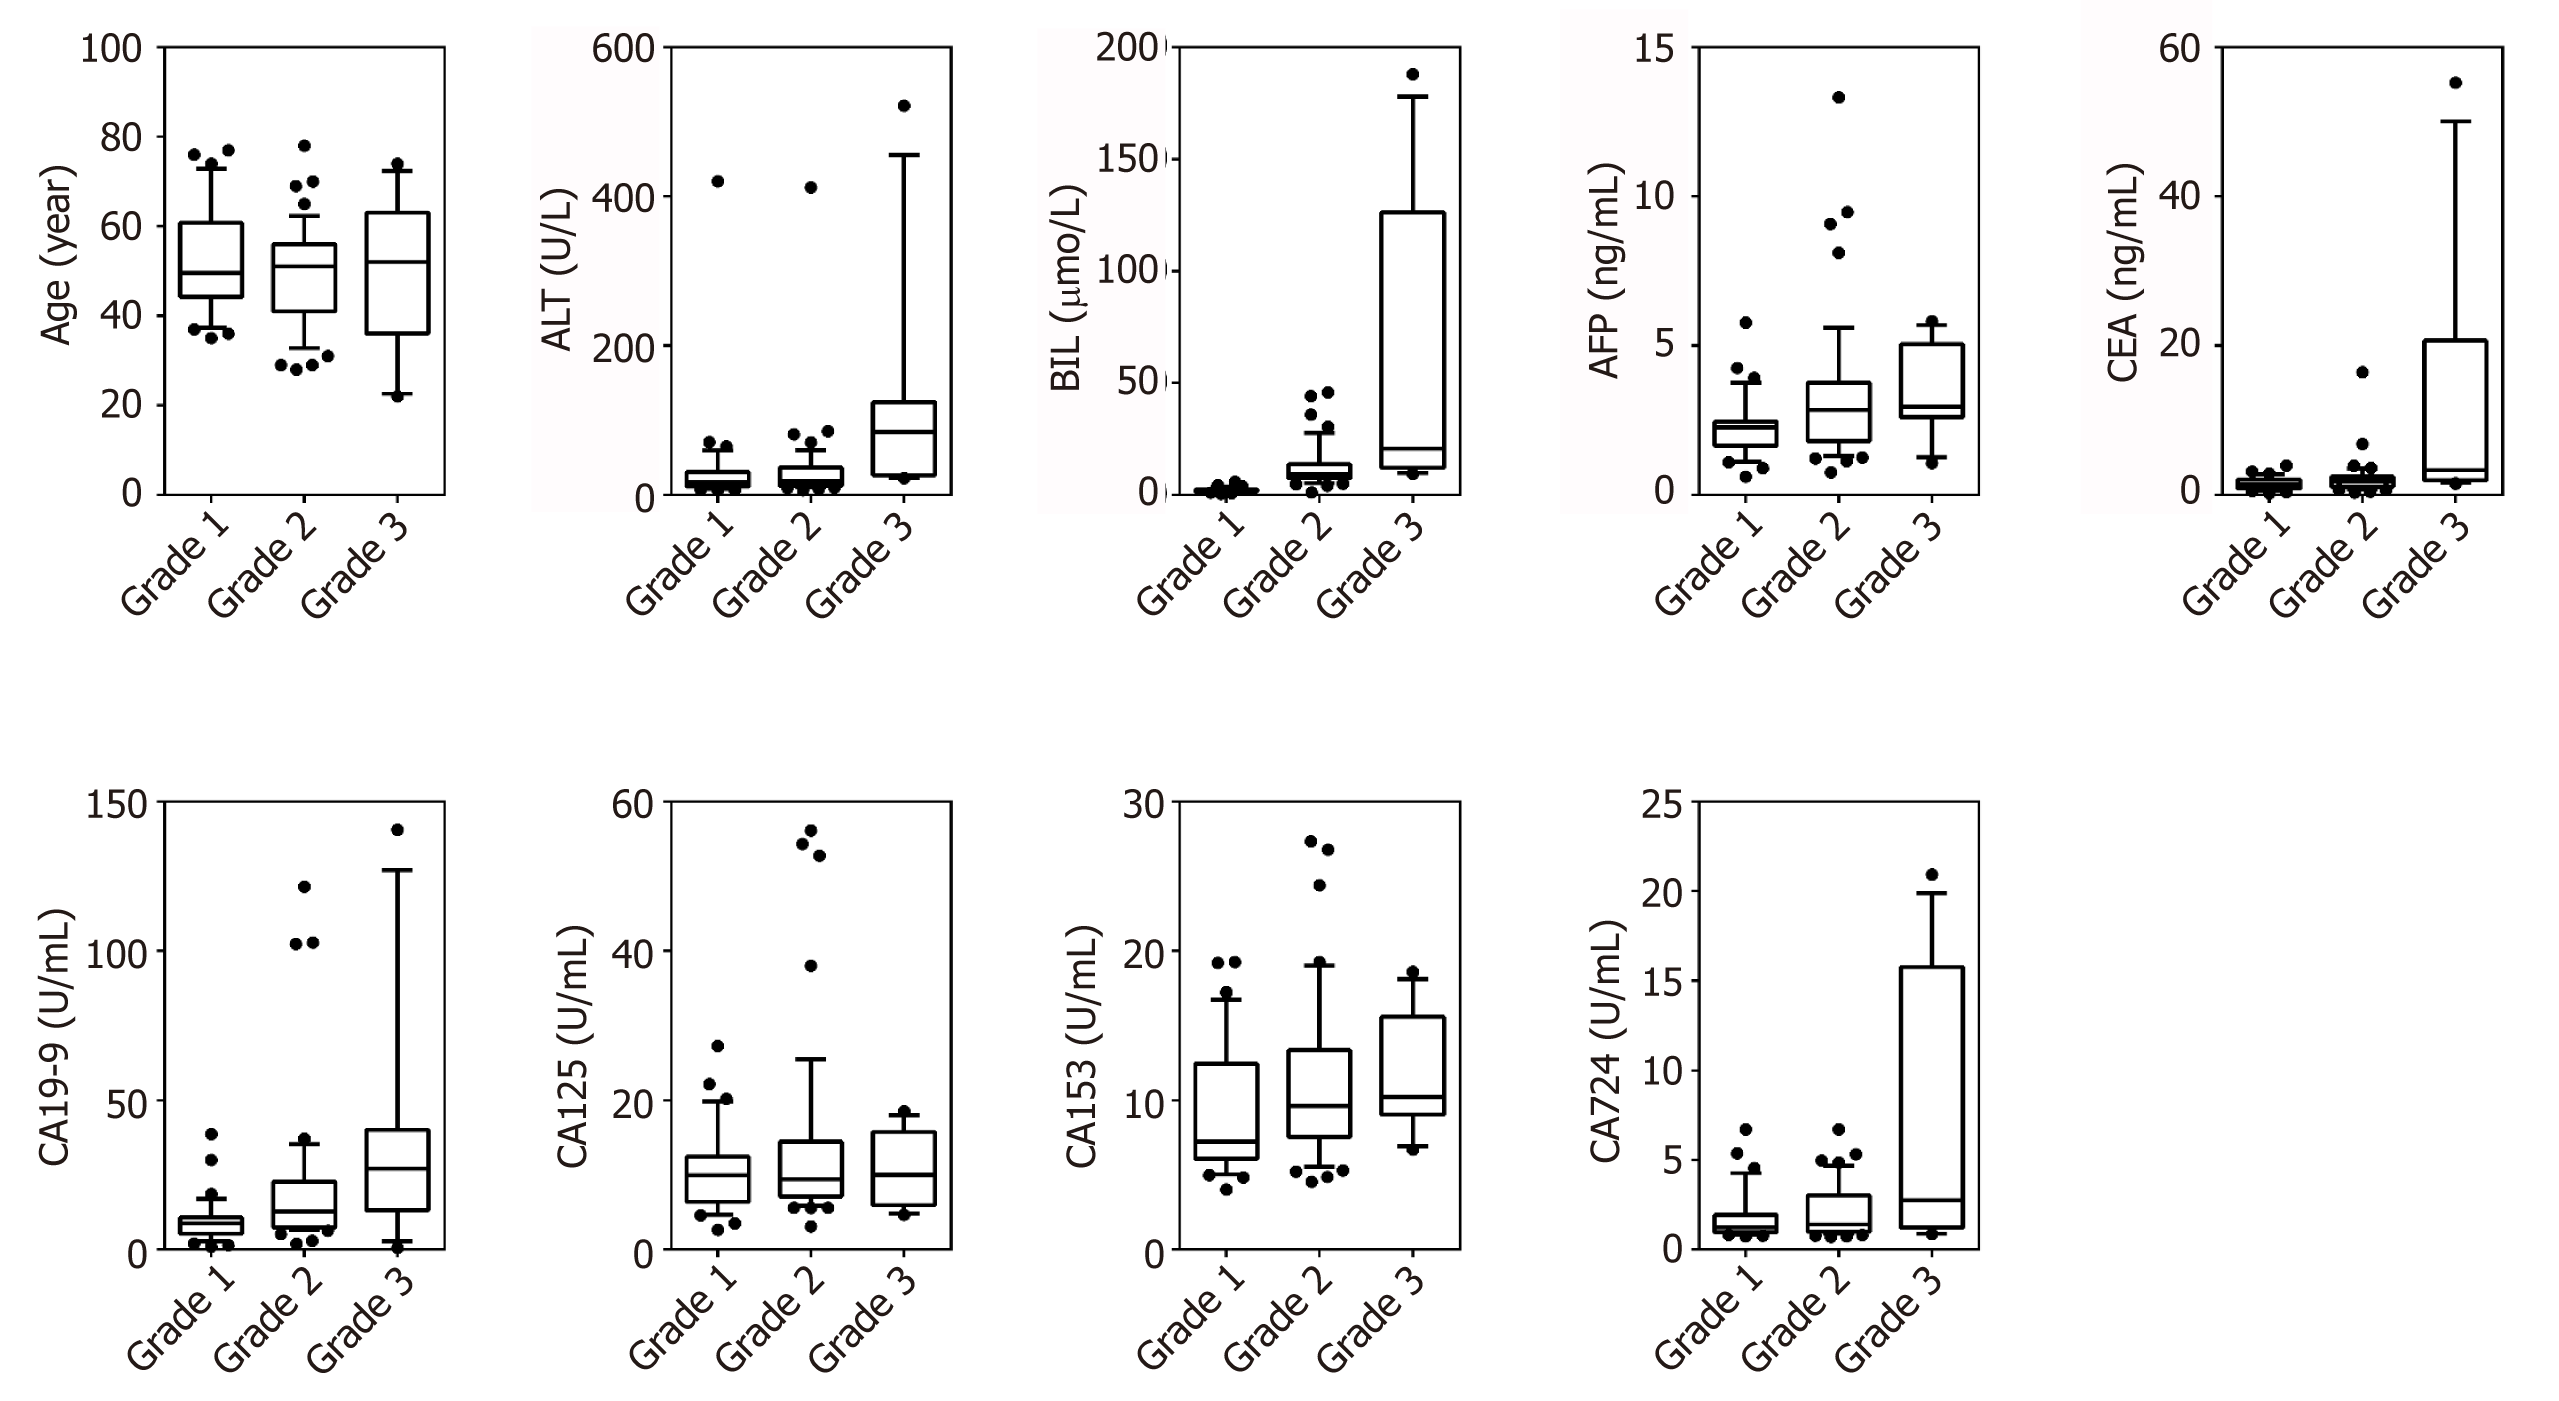
Figure 1 Distribution of different clinical variables.
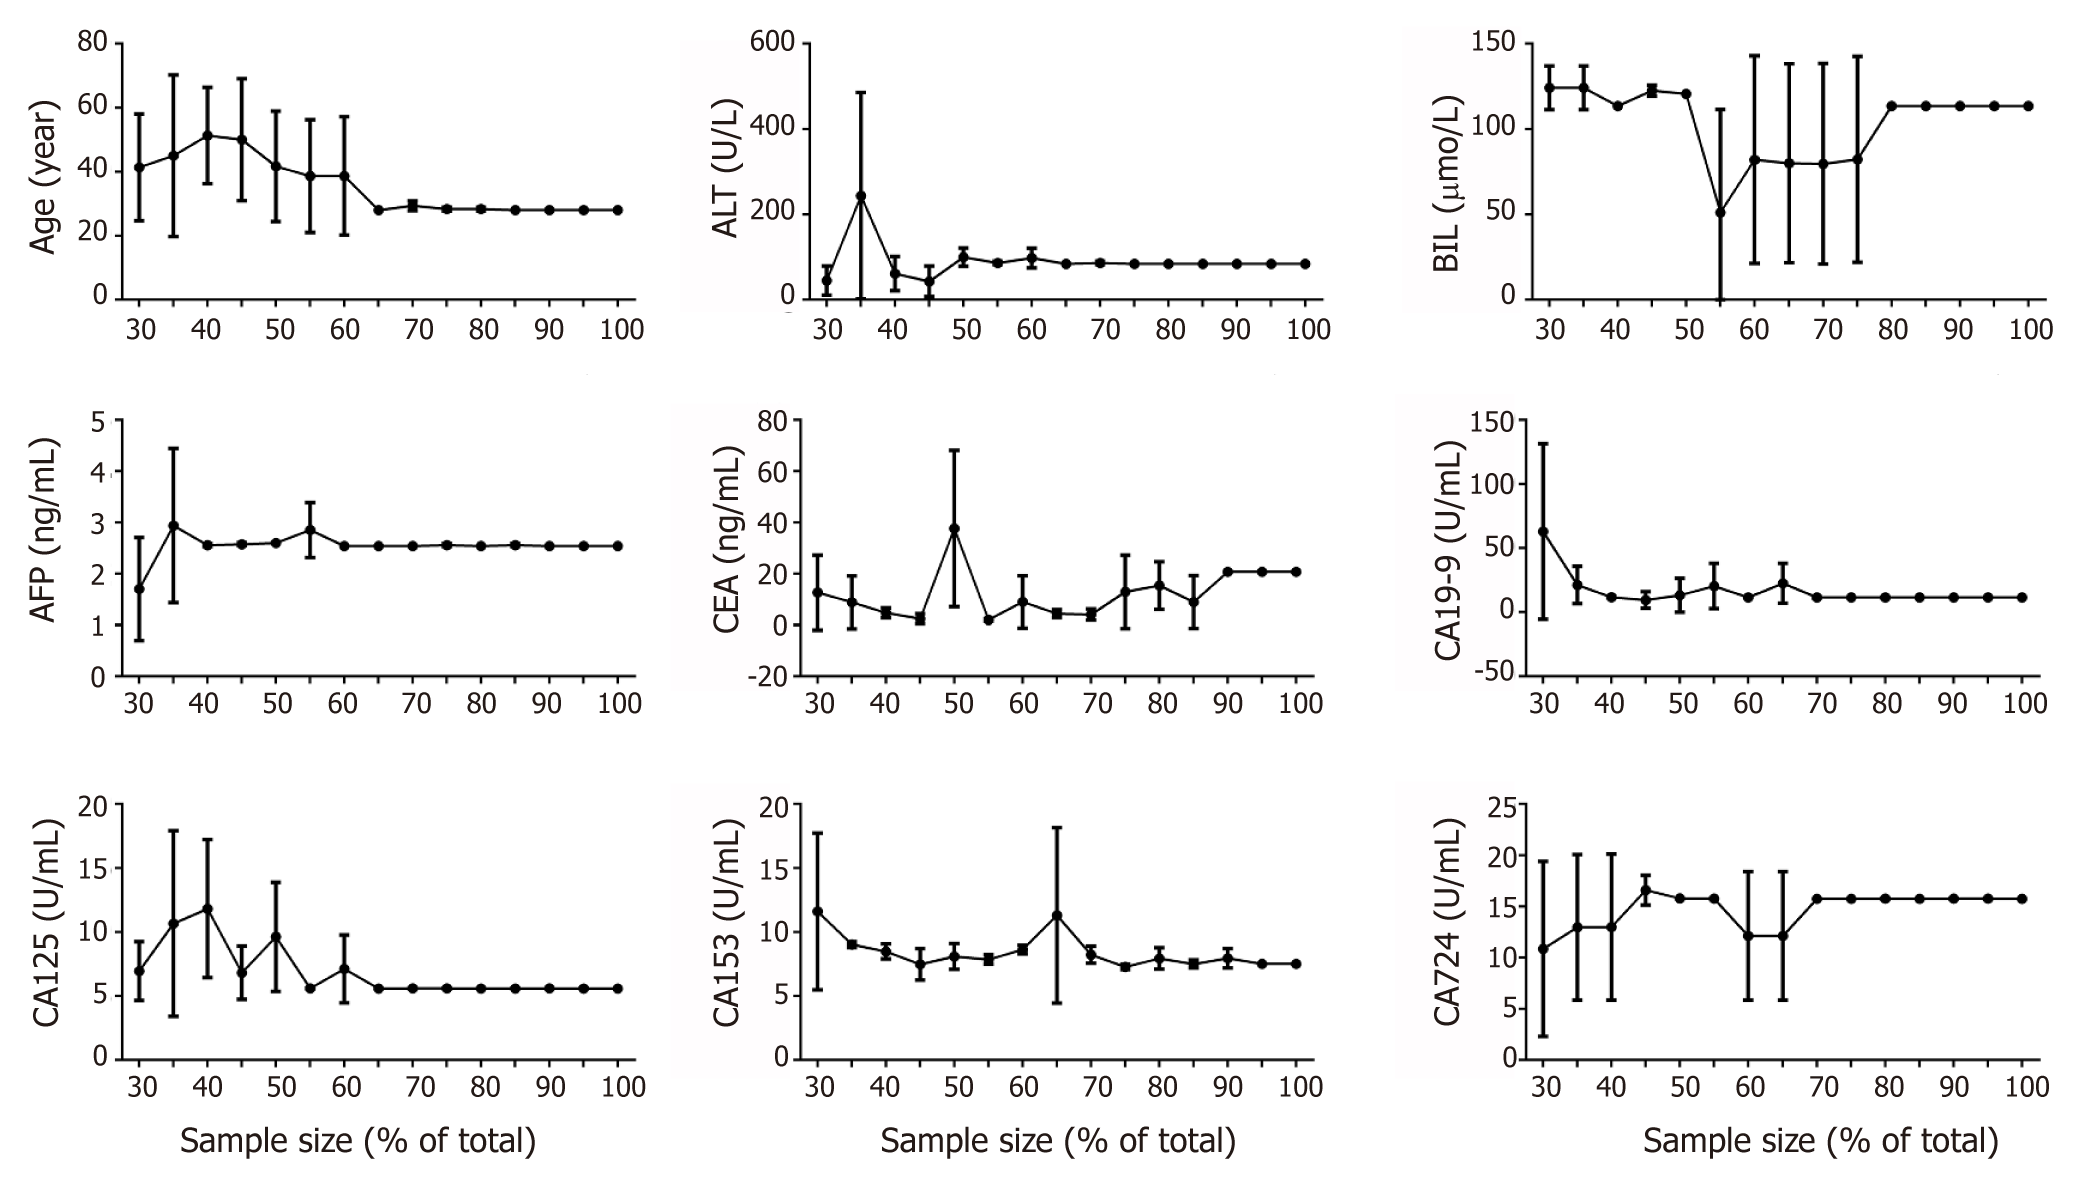
Figure 2 The cutoff value with the minimum P for Chi-square test when sample volume ranged from 30% to 100% in steps of 5%.
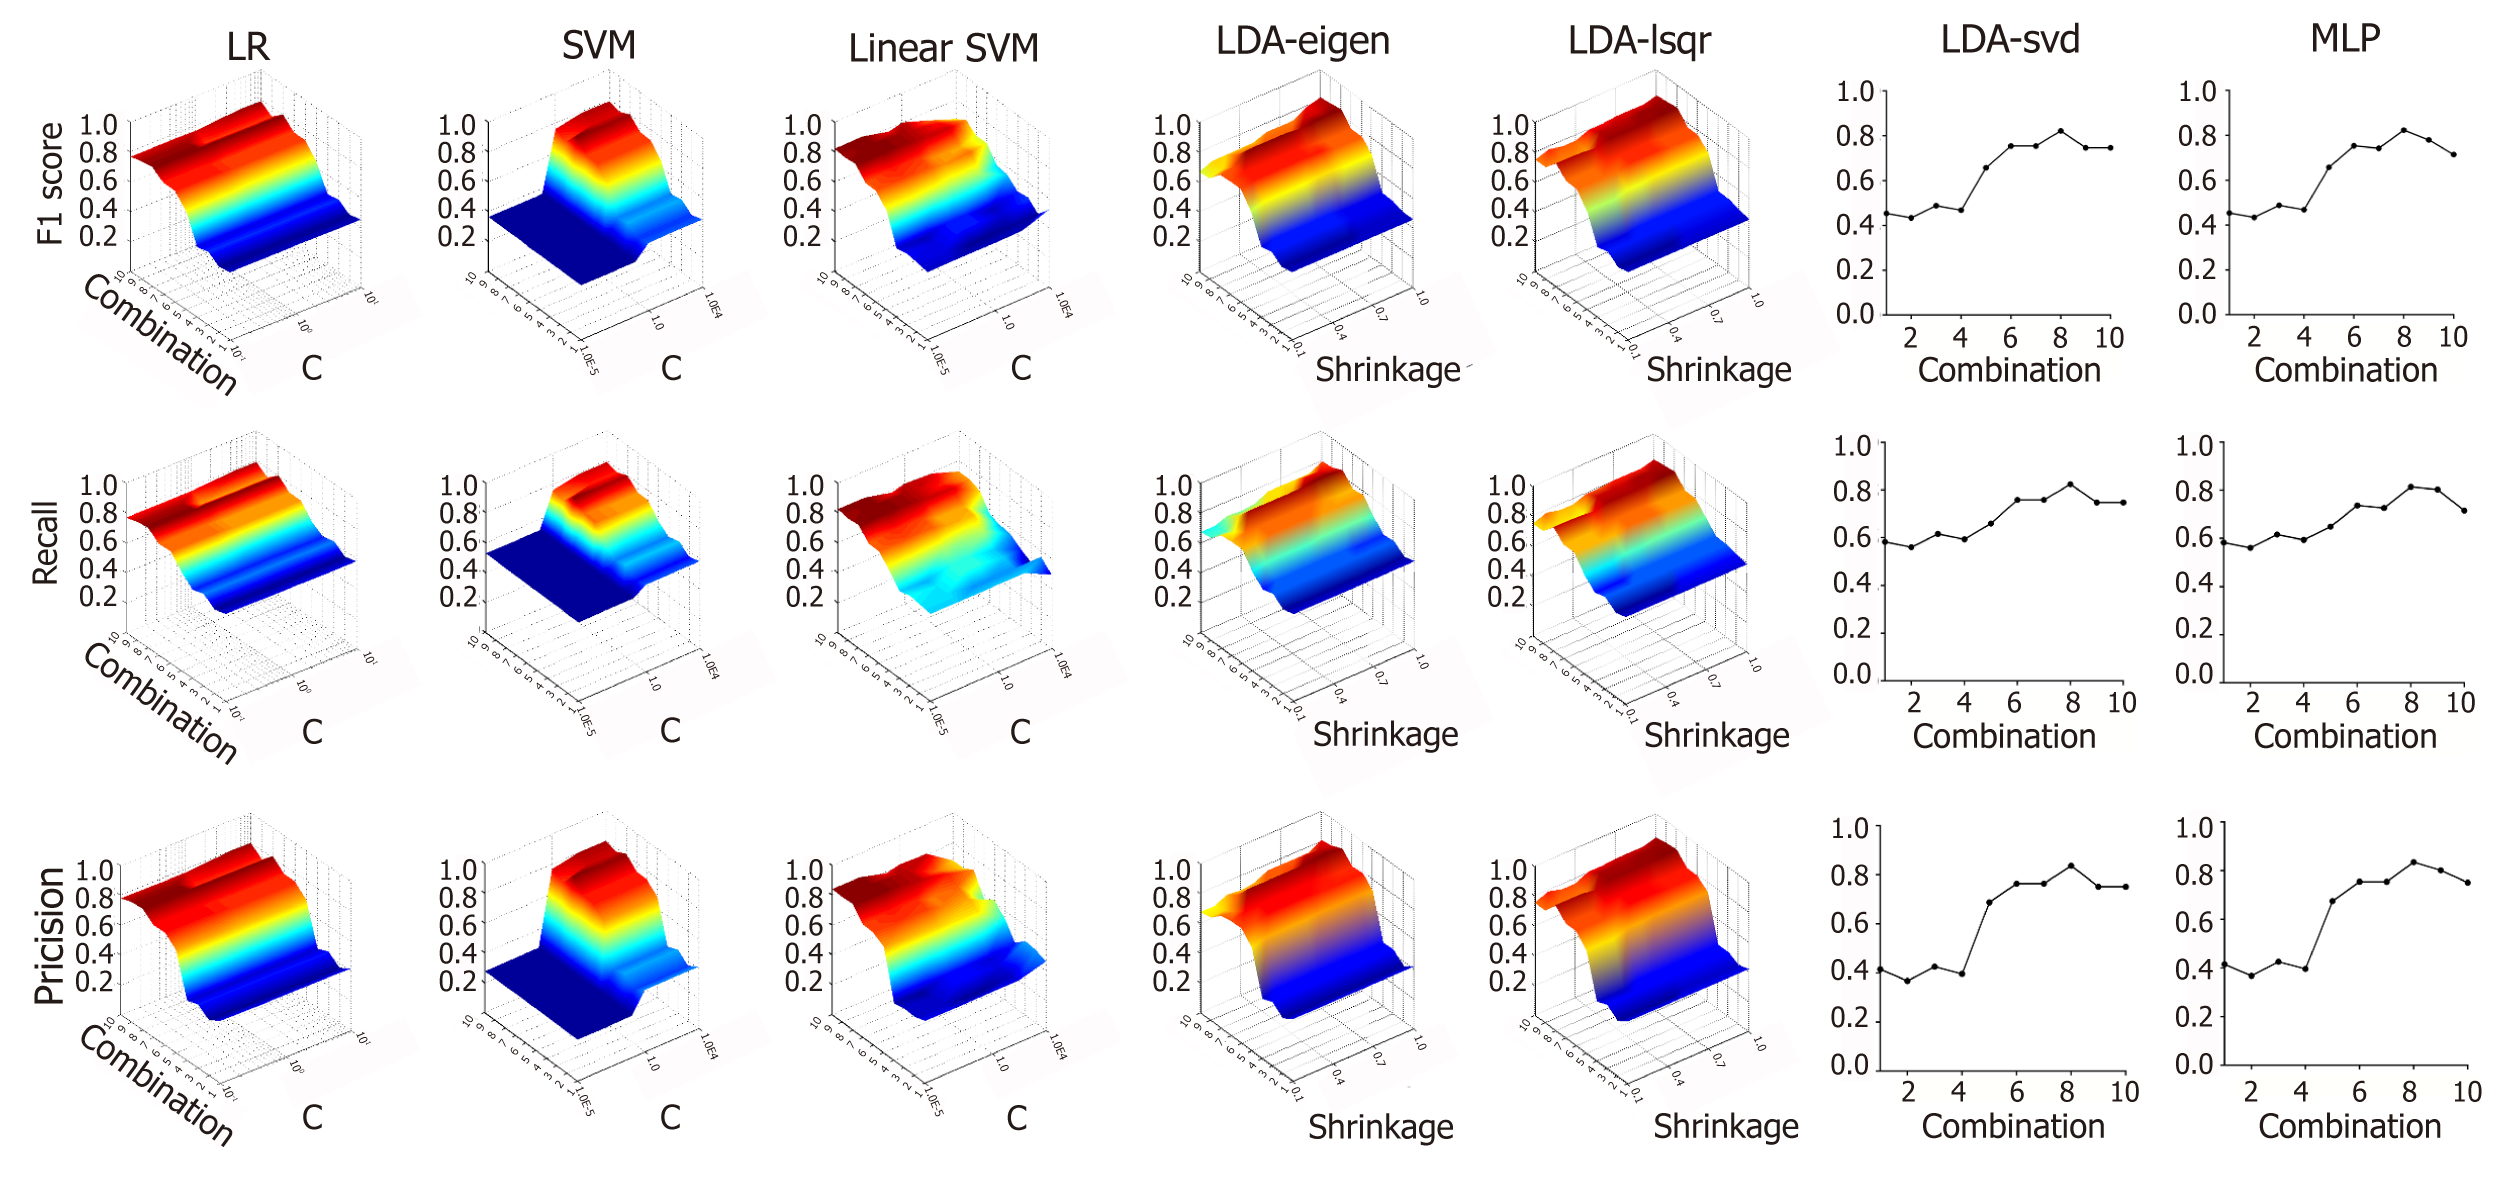
Figure 3 The impact of a combination of independent variables and change of parameter on F1 score, recall rate and precision rate of four models.
Combination 1: bilirubin (BIL); 2: BIL + alanine transaminase (ALT); 3: BIL + ALT + carbohydrate antigen 72-4 (CA72-4); 4: BIL + ALT + CA72-4 + carcinoembryonic antigen (CEA); 5: BIL + ALT + CA72-4 + CEA + CA19-9; 6: BIL + ALT + CA72-4 + CEA + CA19-9 + alpha fetoprotein (AFP); 7: BIL + ALT + CA72-4 + CEA + CA19-9 + AFP + age; 8: BIL + ALT + CA72-4 + CEA + CA19-9 + AFP + age + CA15-3; 9: BIL + ALT + CA72-4 + CEA + CA19-9 + AFP + age + CA15-3 + CA125; 10: BIL + ALT + CA72-4 + CEA + CA19-9 + AFP + age + CA15-3 + CA125 + gender). LR: Logistic regression; SVM: Support vector machine; LDA: Linear discriminant analysis MLP: Multilayer perceptron.
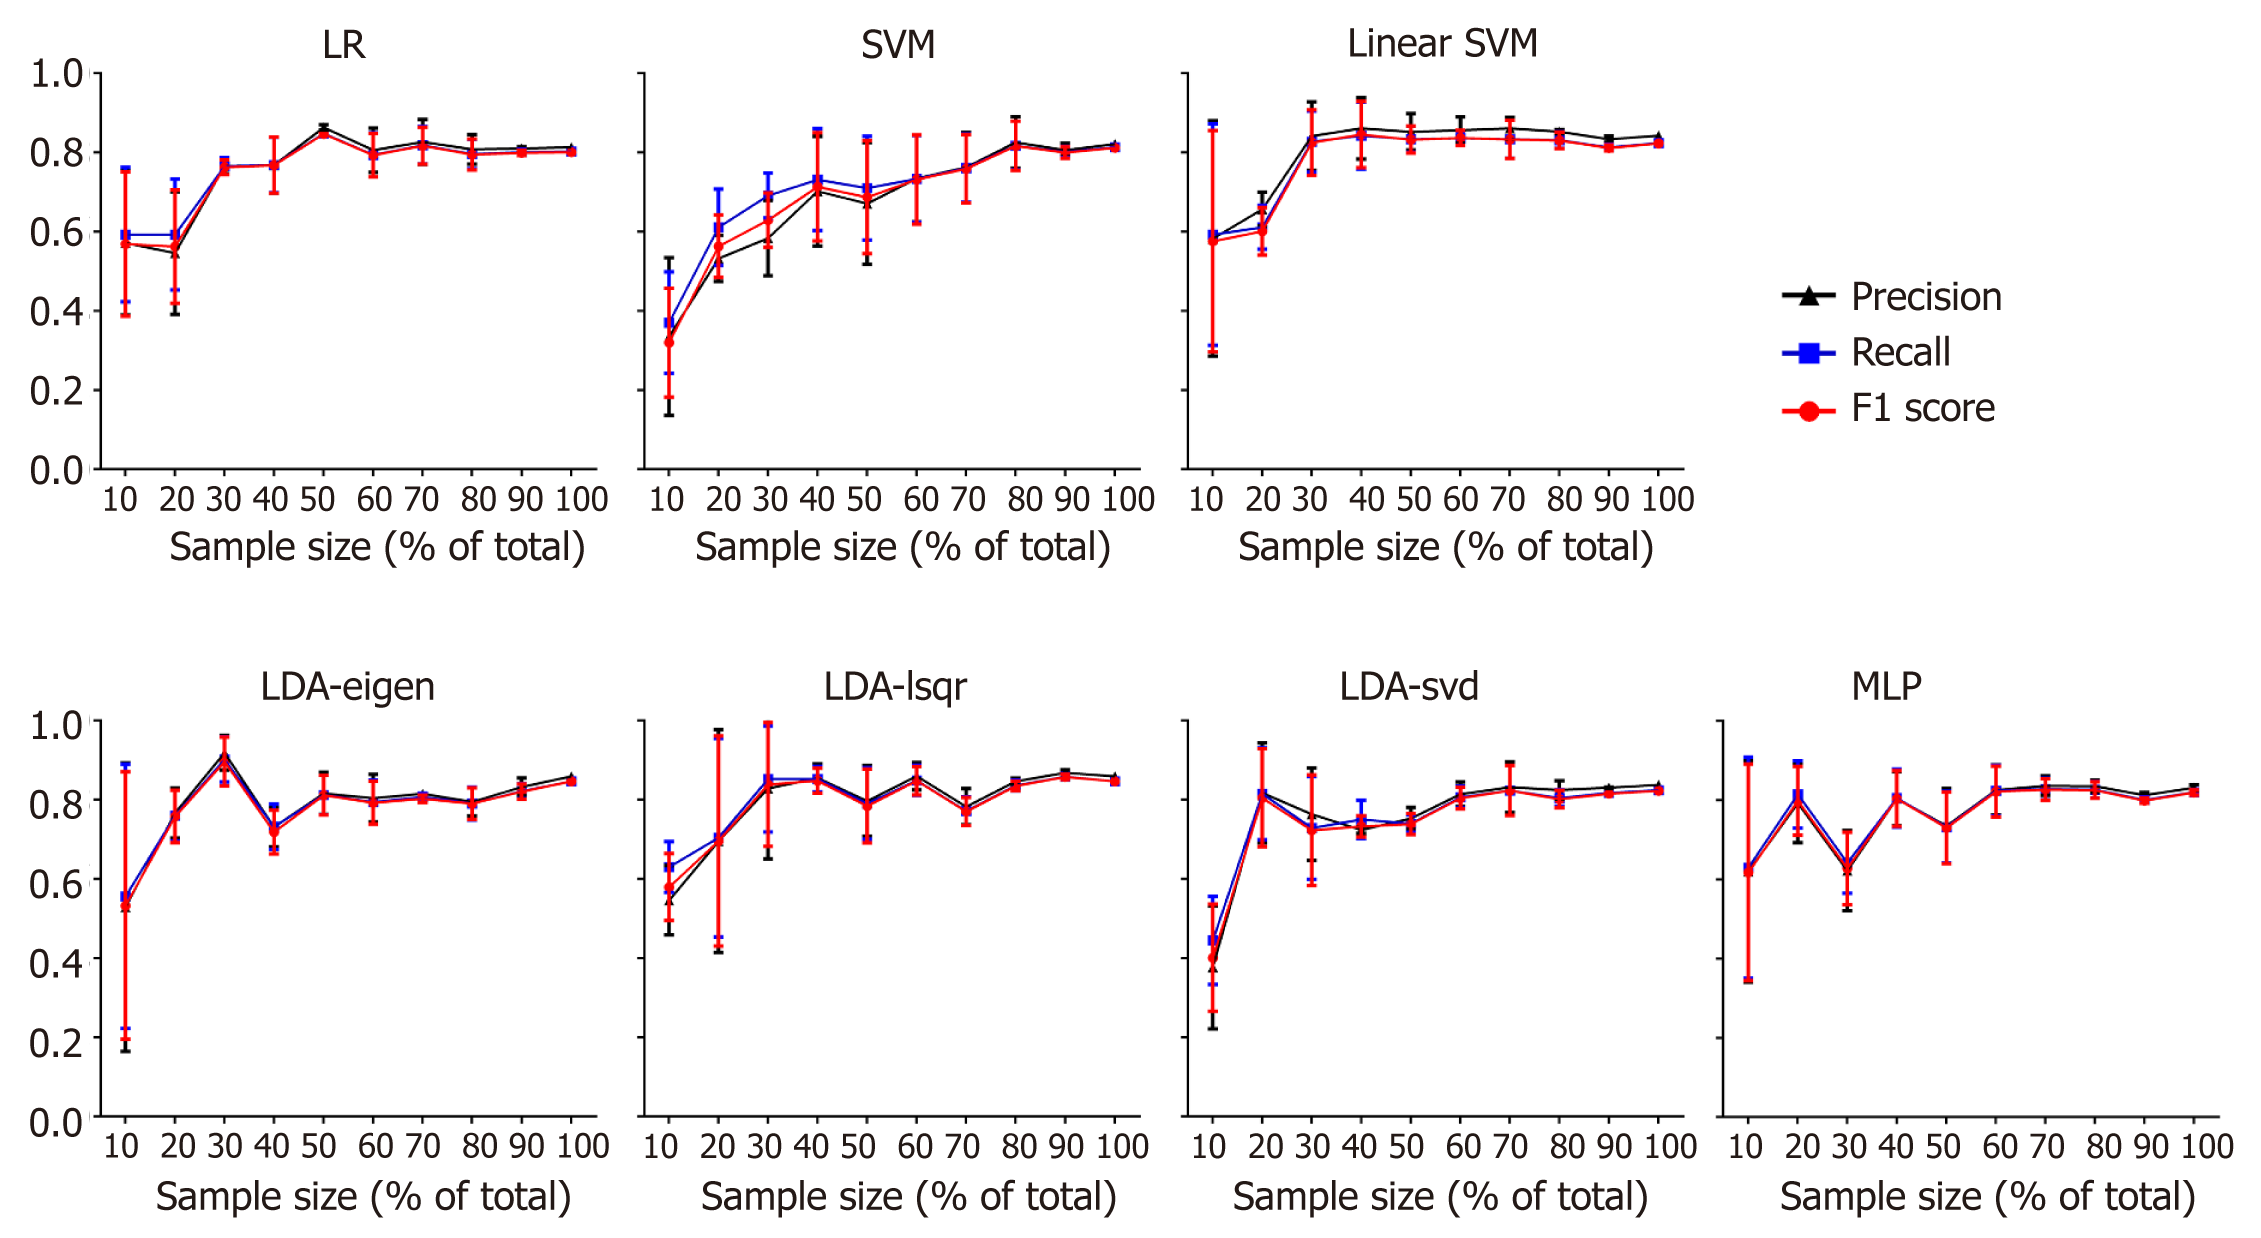
Figure 4 F1 score, recall rate and precision rate of different models with increasing sample size.
LR: Logistic regression; SVM: Support vector machine; LDA: Linear discriminant analysis MLP: Multilayer perceptron.
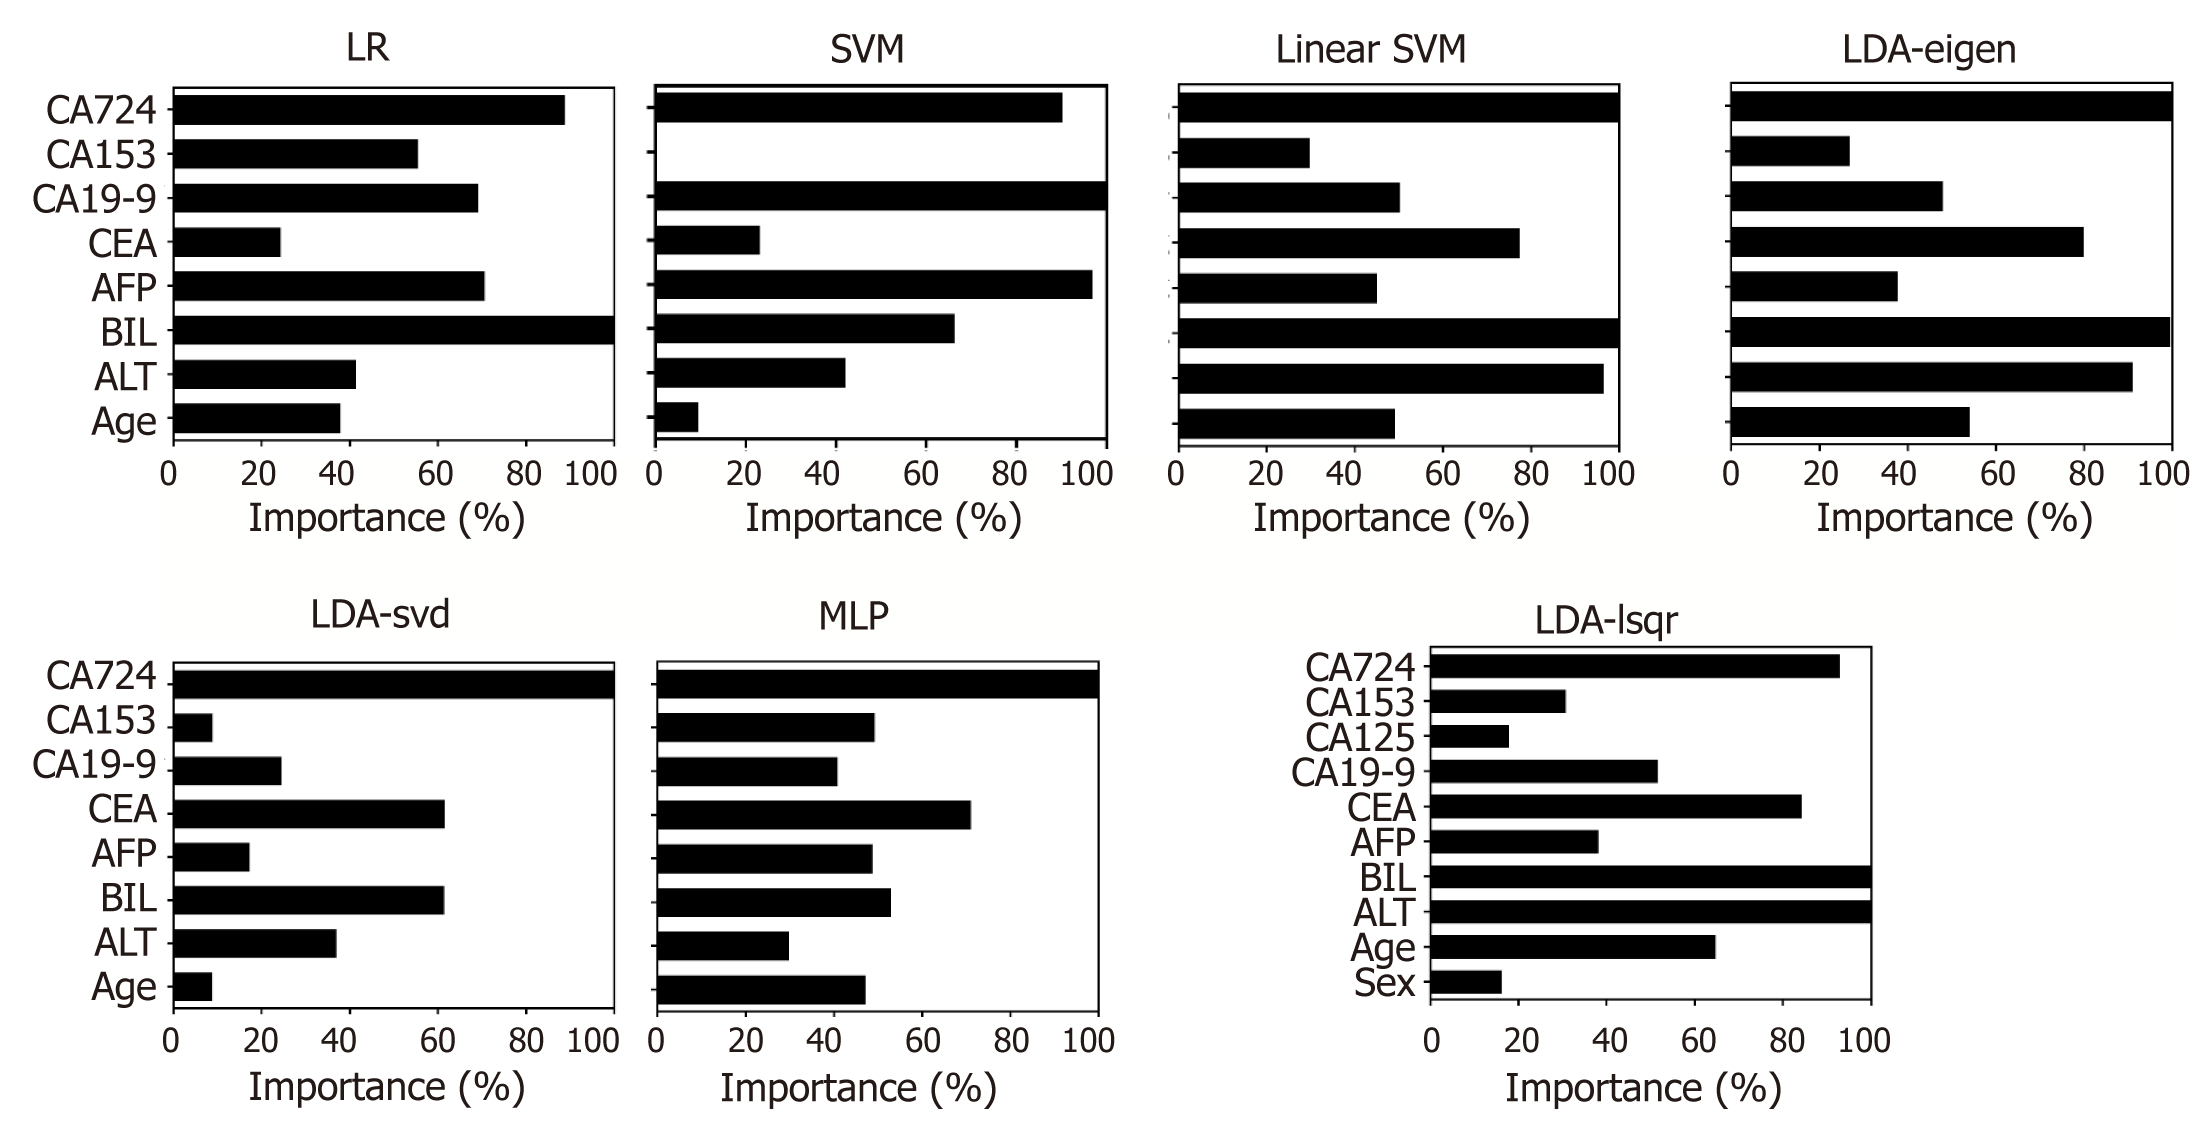
Figure 5 The importance of different variables for each model.
LR: Logistic regression; SVM: Support vector machine; LDA: Linear discriminant analysis MLP: Multilayer perceptron.
- Citation: Zhou RQ, Ji HC, Liu Q, Zhu CY, Liu R. Leveraging machine learning techniques for predicting pancreatic neuroendocrine tumor grades using biochemical and tumor markers. World J Clin Cases 2019; 7(13): 1611-1622
- URL: https://www.wjgnet.com/2307-8960/full/v7/i13/1611.htm
- DOI: https://dx.doi.org/10.12998/wjcc.v7.i13.1611


