Copyright
©The Author(s) 2019.
World J Clin Cases. Jun 26, 2019; 7(12): 1483-1491
Published online Jun 26, 2019. doi: 10.12998/wjcc.v7.i12.1483
Published online Jun 26, 2019. doi: 10.12998/wjcc.v7.i12.1483
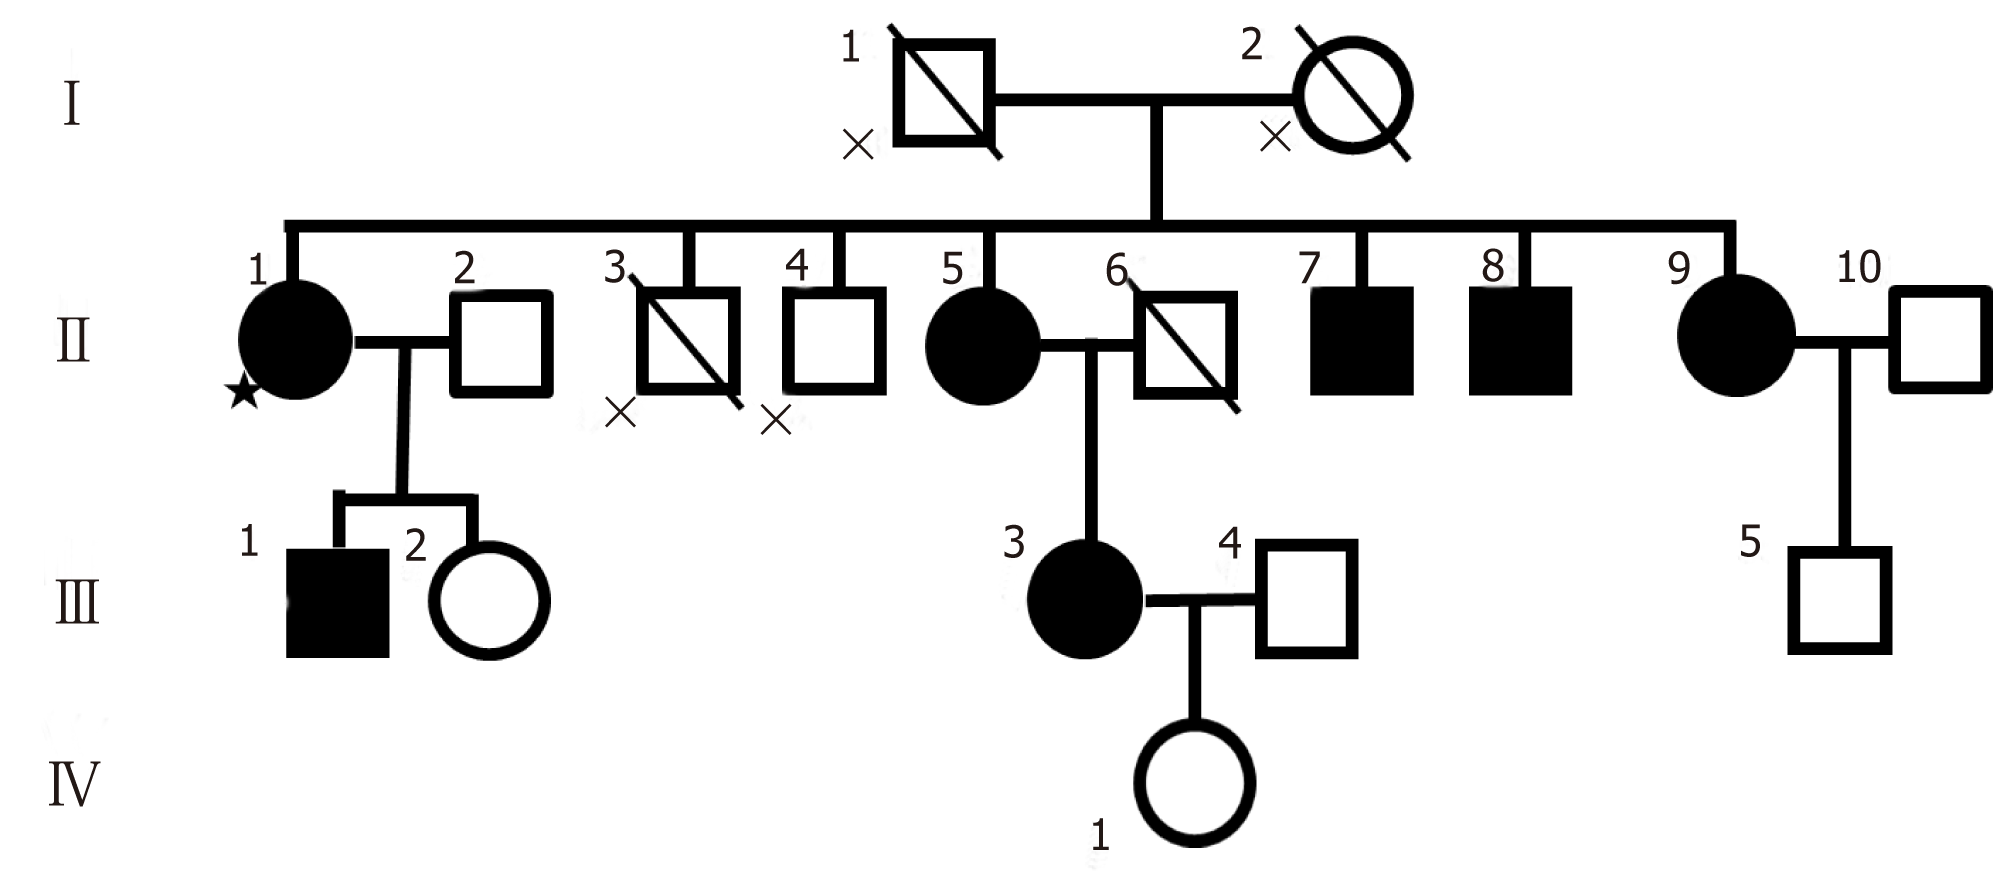
Figure 1 Pedigree of the Sunagawa family.
Legend The star sign indicates the index subject. Filled symbols represent patients affected with brain calcification. The cross marks indicate persons from whom samples and symptom were not available.
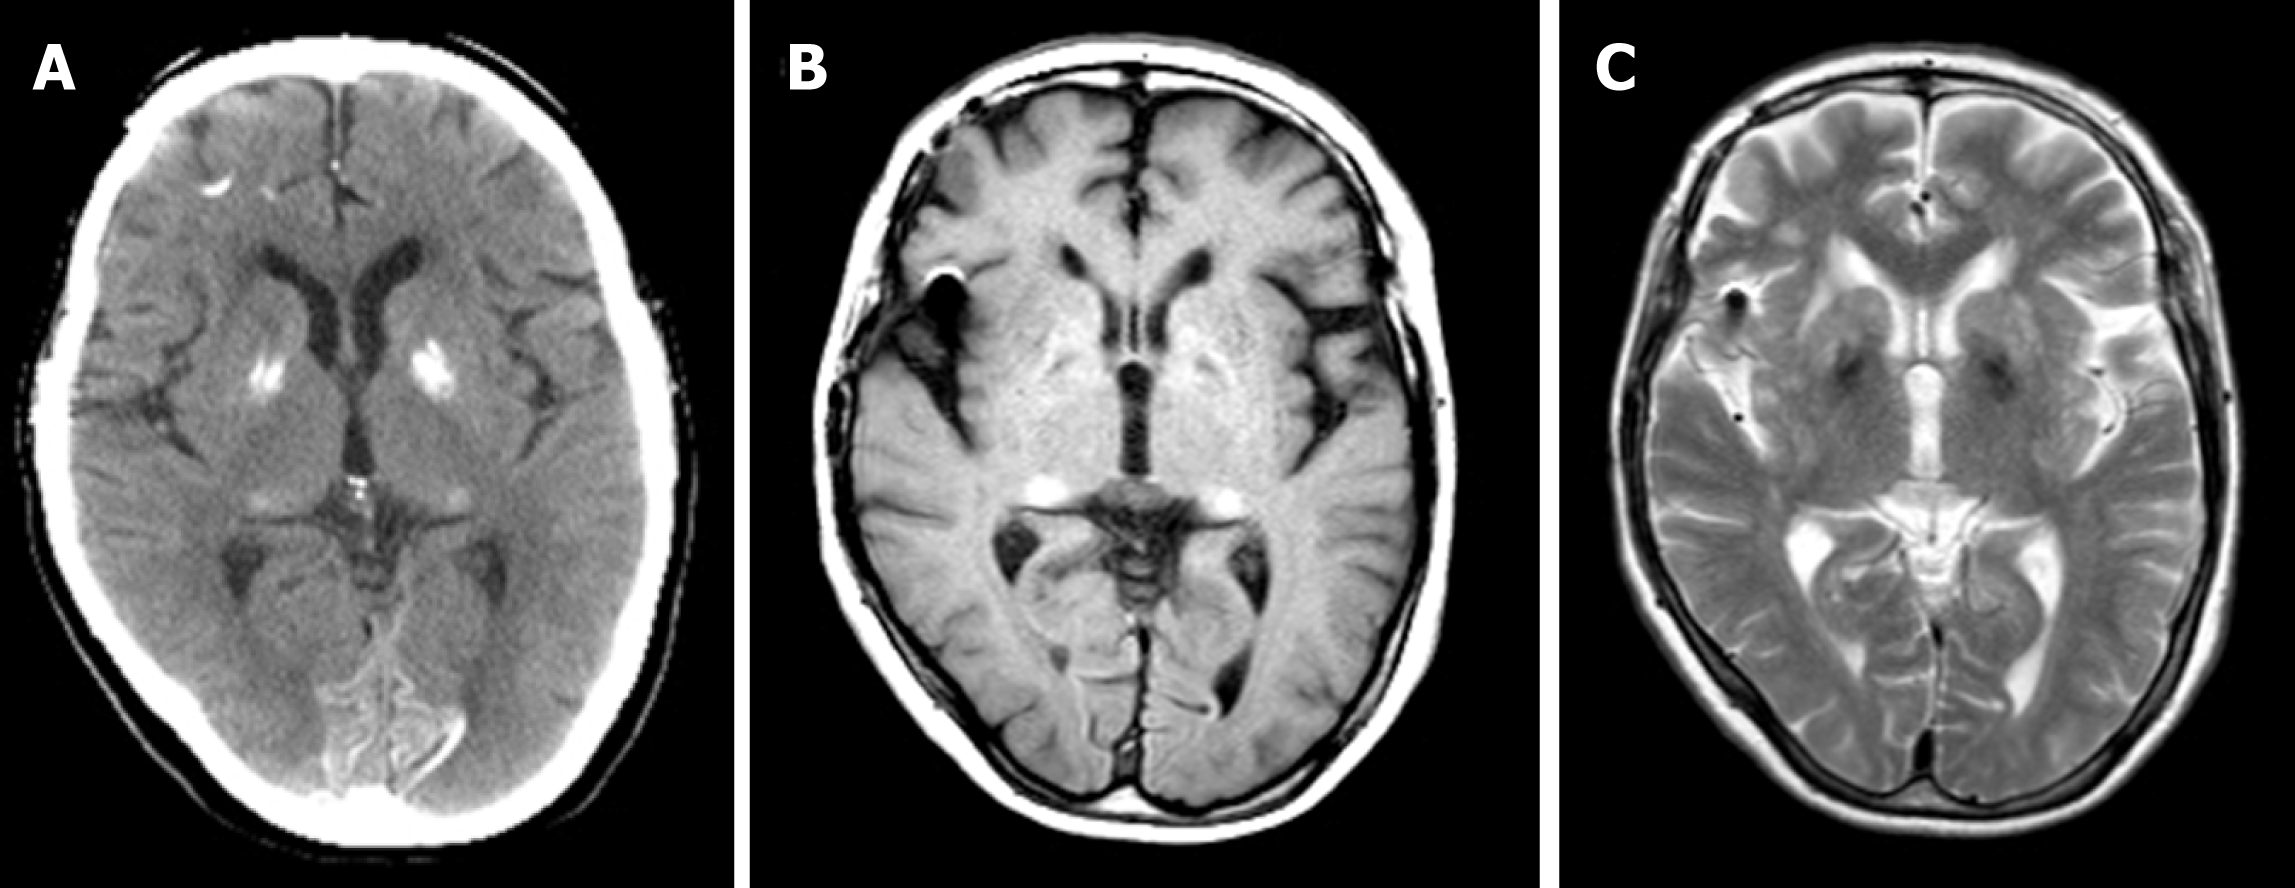
Figure 2 Computed tomography, magnetic resonance imaging-T1, and magnetic resonance imaging-T2 images of the proband (65 yr).
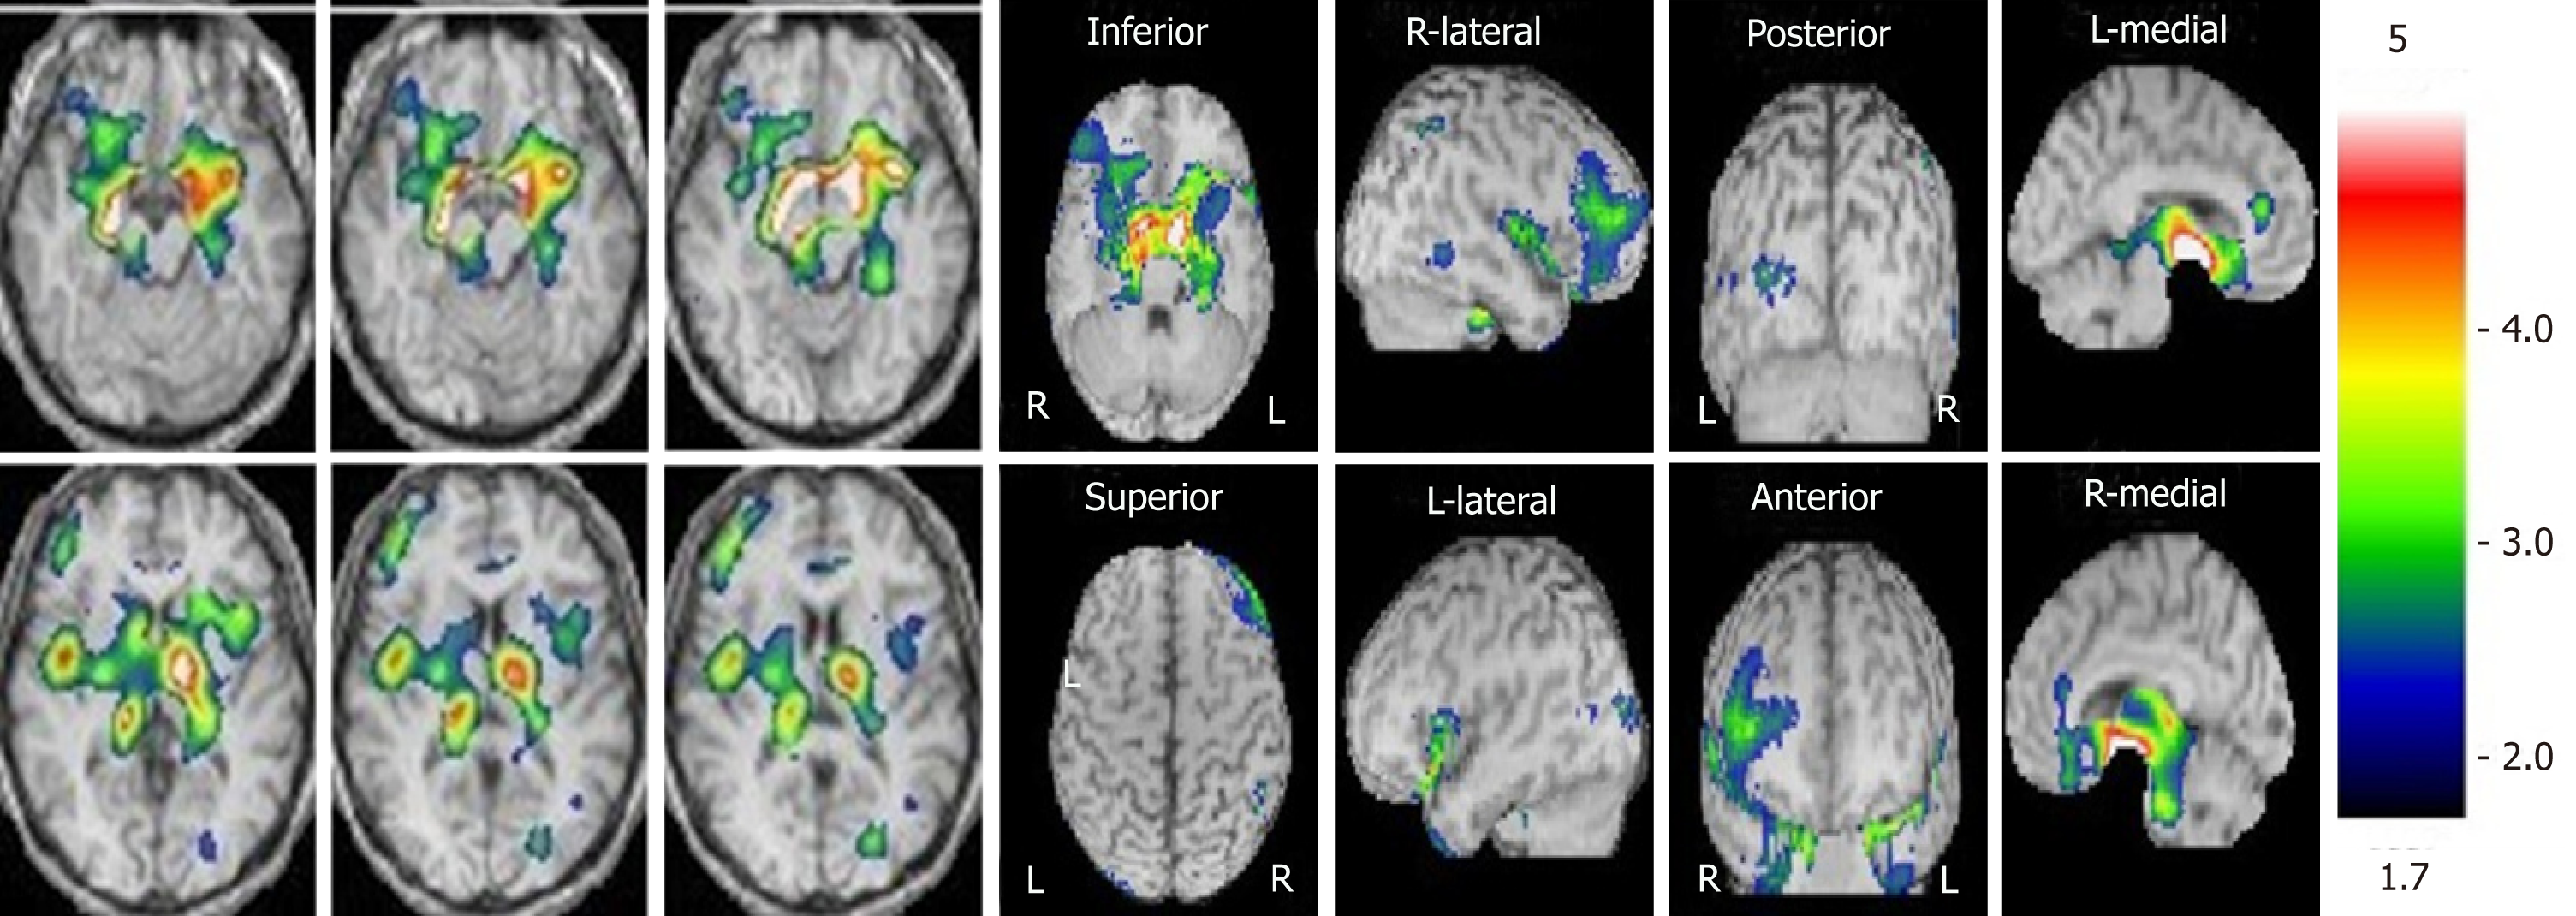
Figure 3 Brain perfusion single photon emission computed tomography (easy Z-score imaging system) of the proband (65 yr).
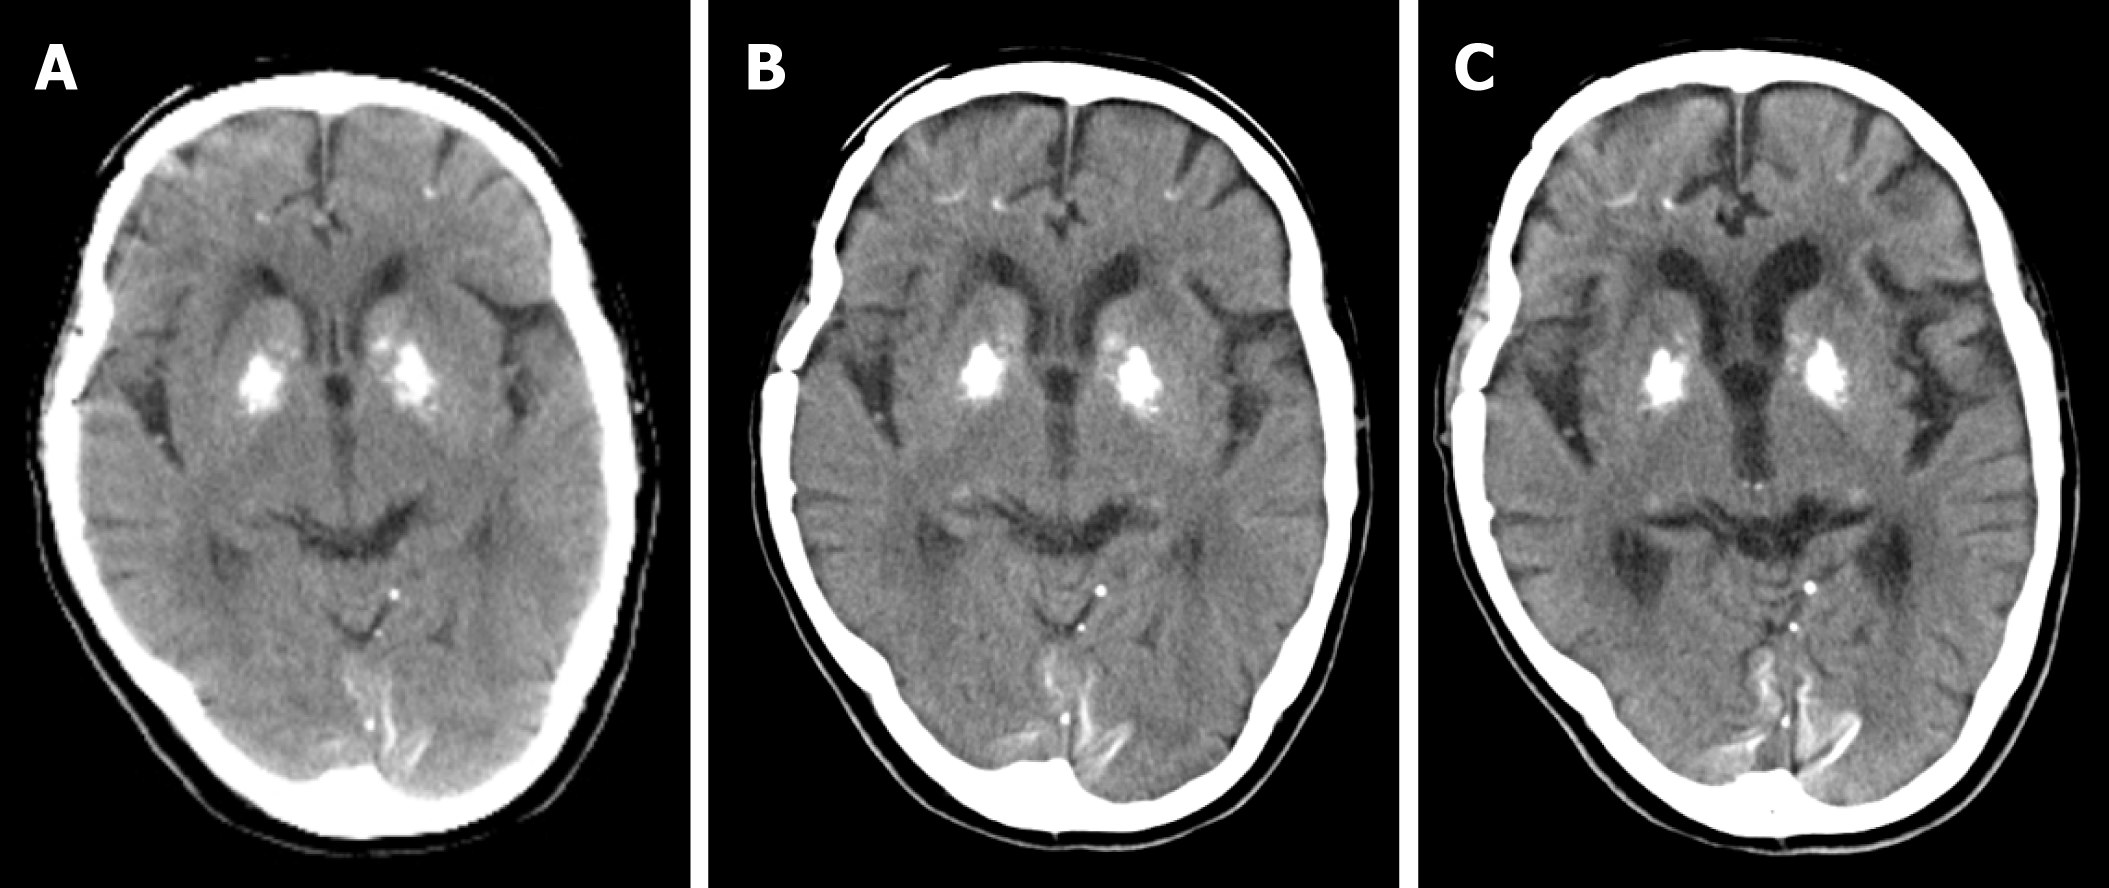
Figure 4 Computed tomography images of the proband.
A: 65 yr; B: 69 yr; C: 75 yr.
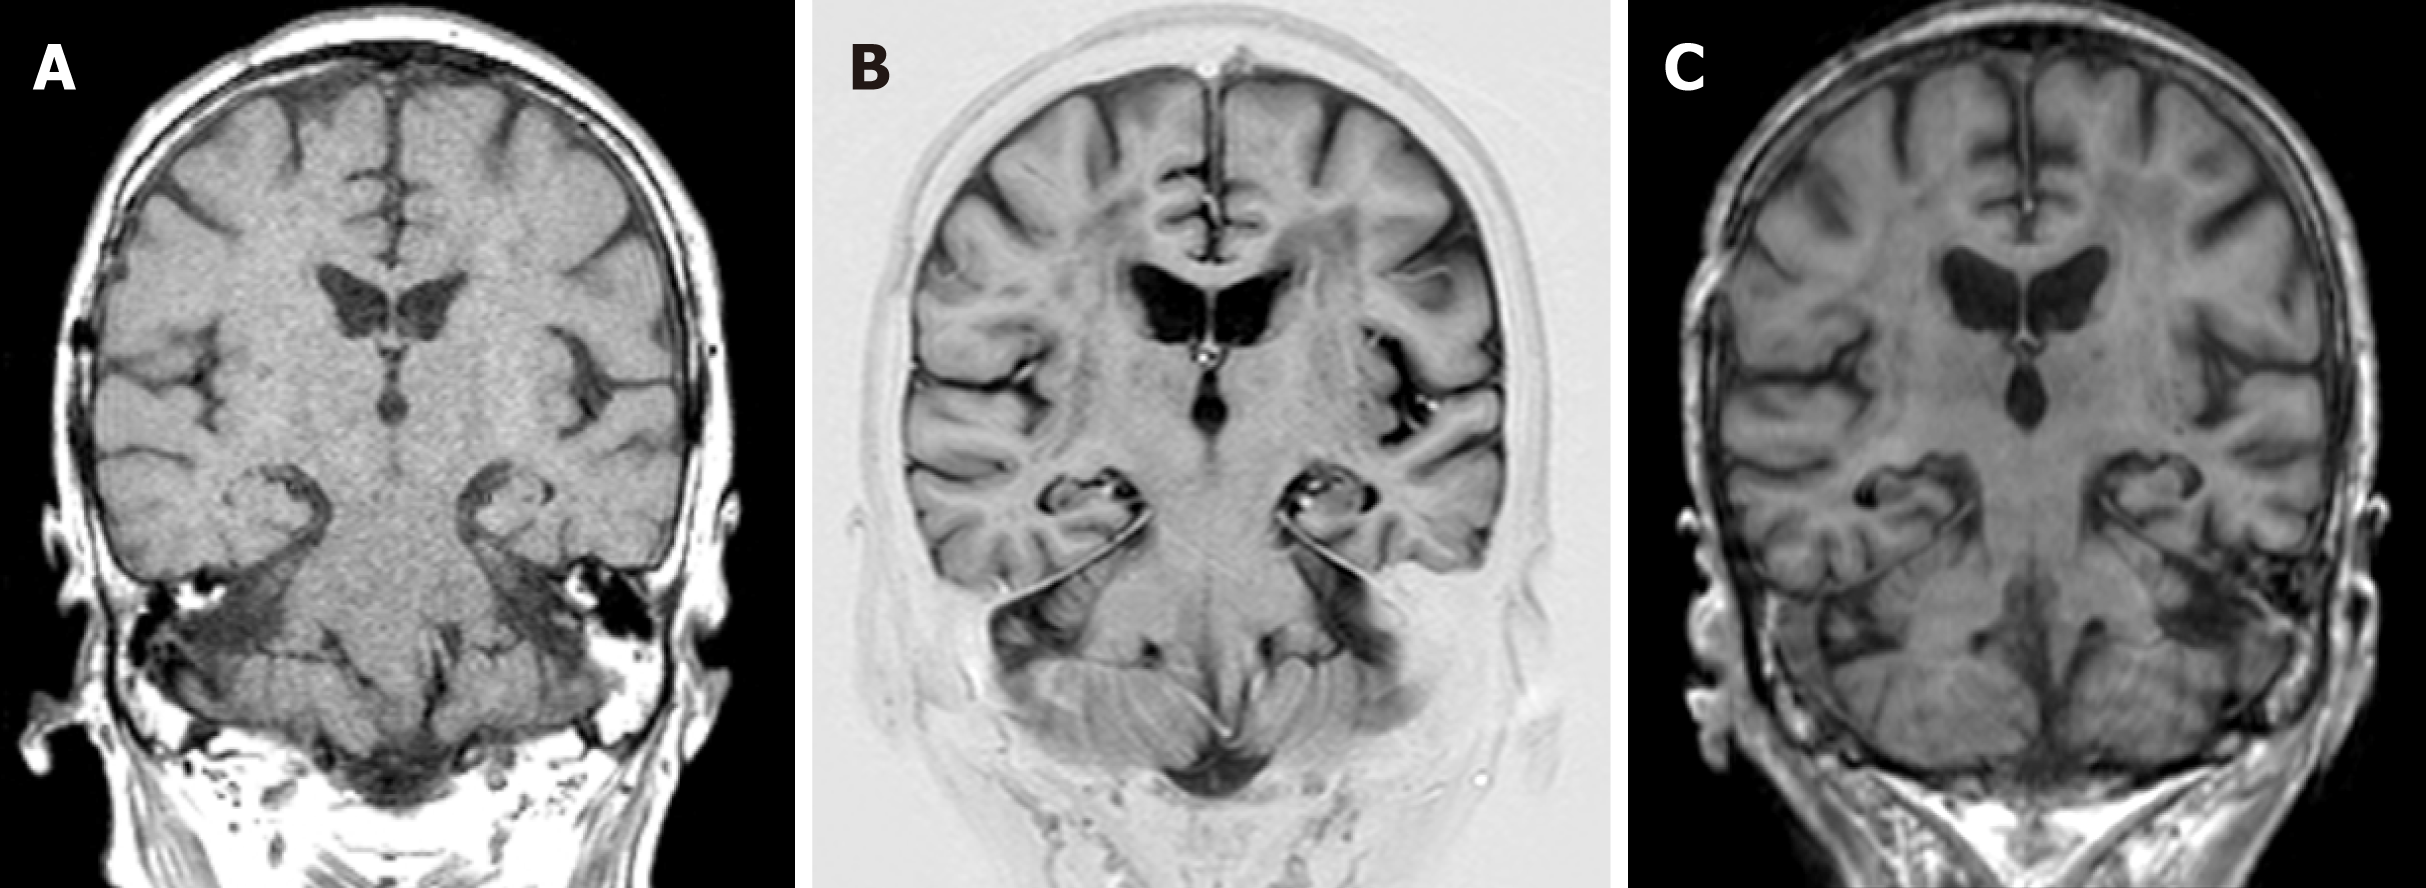
Figure 5 Magnetic resonance imaging-coronal images of the proband.
A: 65 yr; B: 69 yr; C: 75 yr.
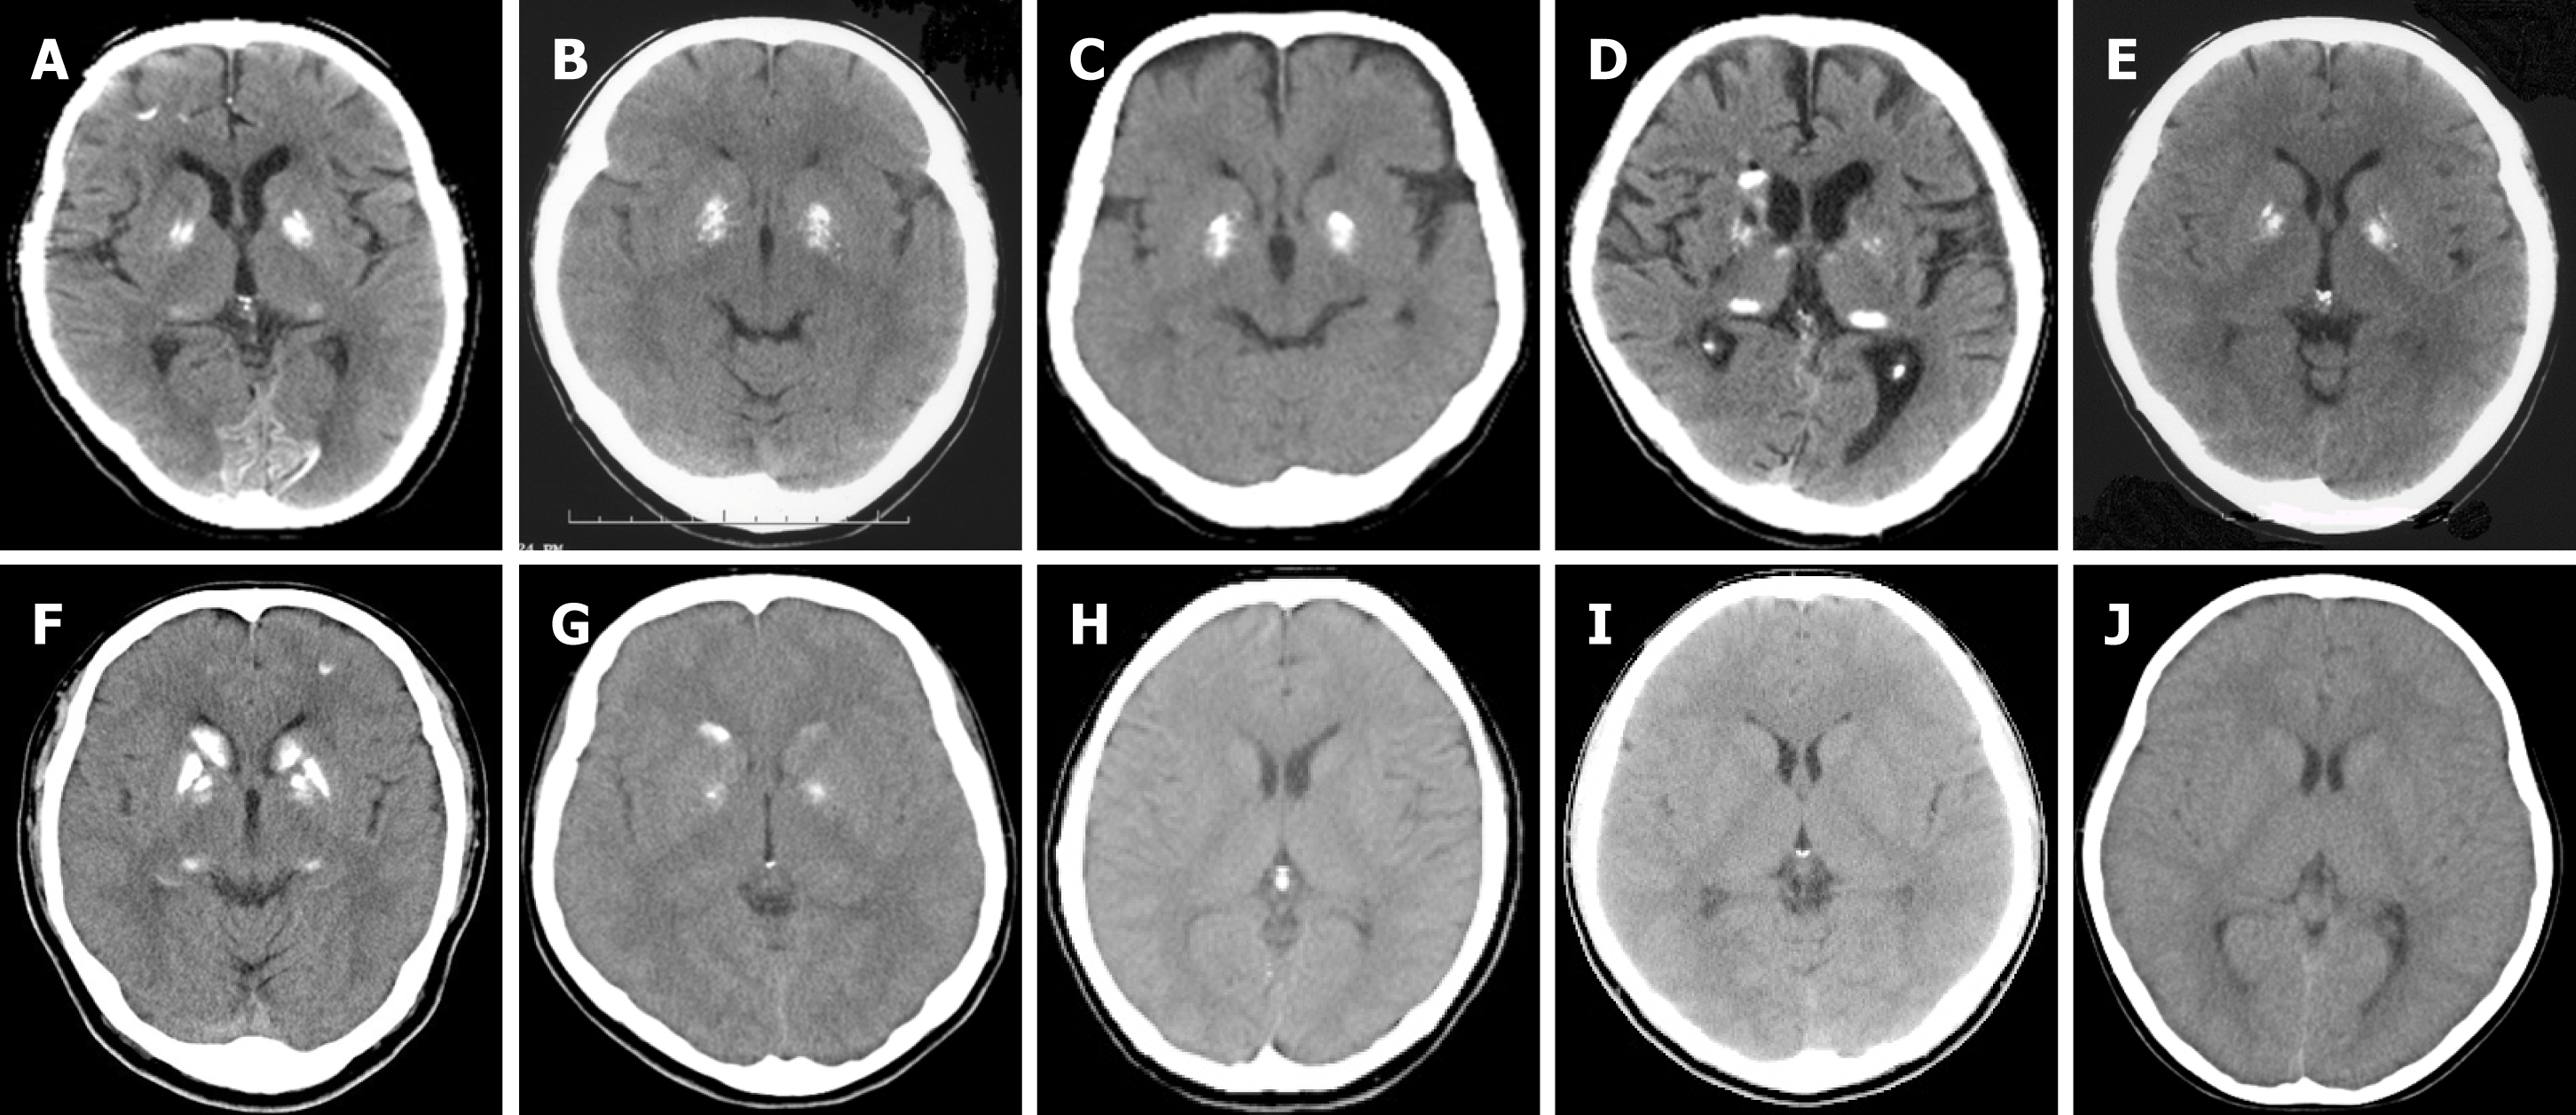
Figure 6 Computed tomography images of the family members.
A: Computed tomography (CT) image of the proband (II-1 in pedigree of the family); B: CT image of asymptomatic II-5; C: CT image of symptomatic II-7; D: CT image of symptomatic II-8; E: CT image of asymptomatic II-9; F: CT image of asymptomatic III-1; G: CT image of asymptomatic III-3; H: CT image of asymptomatic III-2; I: CT image of asymptomatic III-5; J: CT image of asymptomatic IV-1.
- Citation: Kobayashi S, Utsumi K, Tateno M, Iwamoto T, Murayama T, Sohma H, Ukai W, Hashimoto E, Kawanishi C. Longitudinal observation of ten family members with idiopathic basal ganglia calcification: A case report. World J Clin Cases 2019; 7(12): 1483-1491
- URL: https://www.wjgnet.com/2307-8960/full/v7/i12/1483.htm
- DOI: https://dx.doi.org/10.12998/wjcc.v7.i12.1483


