Copyright
©The Author(s) 2019.
World J Clin Cases. Jun 6, 2019; 7(11): 1330-1336
Published online Jun 6, 2019. doi: 10.12998/wjcc.v7.i11.1330
Published online Jun 6, 2019. doi: 10.12998/wjcc.v7.i11.1330
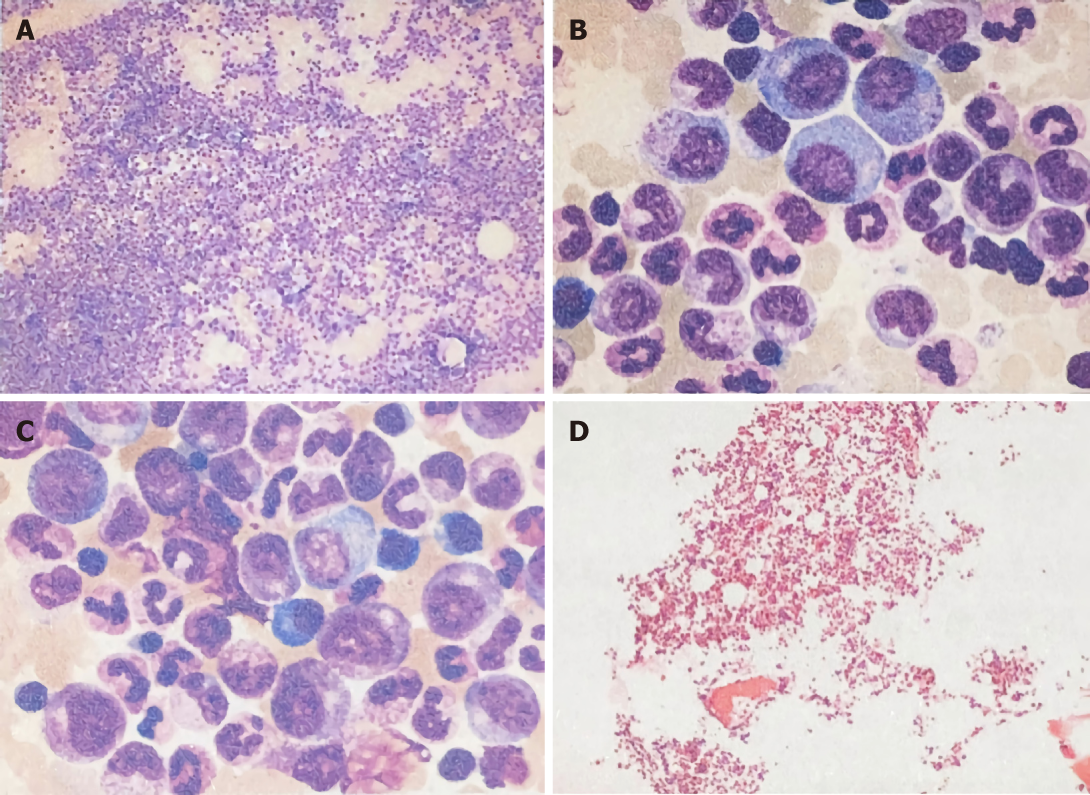
Figure 1 Bone marrow smear and bone marrow biopsy results.
A-C: Bone marrow smears showed that hyperplasia was extremely active, the proportion of granulocyte-neutrophil nucleated cells increased, and most of the granules were coarse and numerous; D: Bone marrow biopsy examination showed that the hematopoietic tissue was obviously increased, the adipose tissue was reduced, the ratio of granulocytes to red blood cells was increased, and the megakaryocytes were visible.
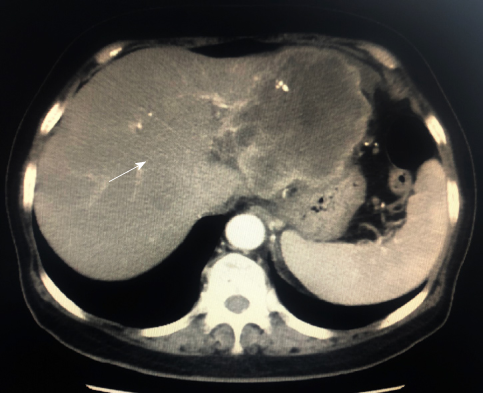
Figure 2 Computerized tomography image showing a 9.
3-cm focal hepatic mass in the left lobe of the liver and dilatation of intrahepatic bile duct, as indicated by the arrow.
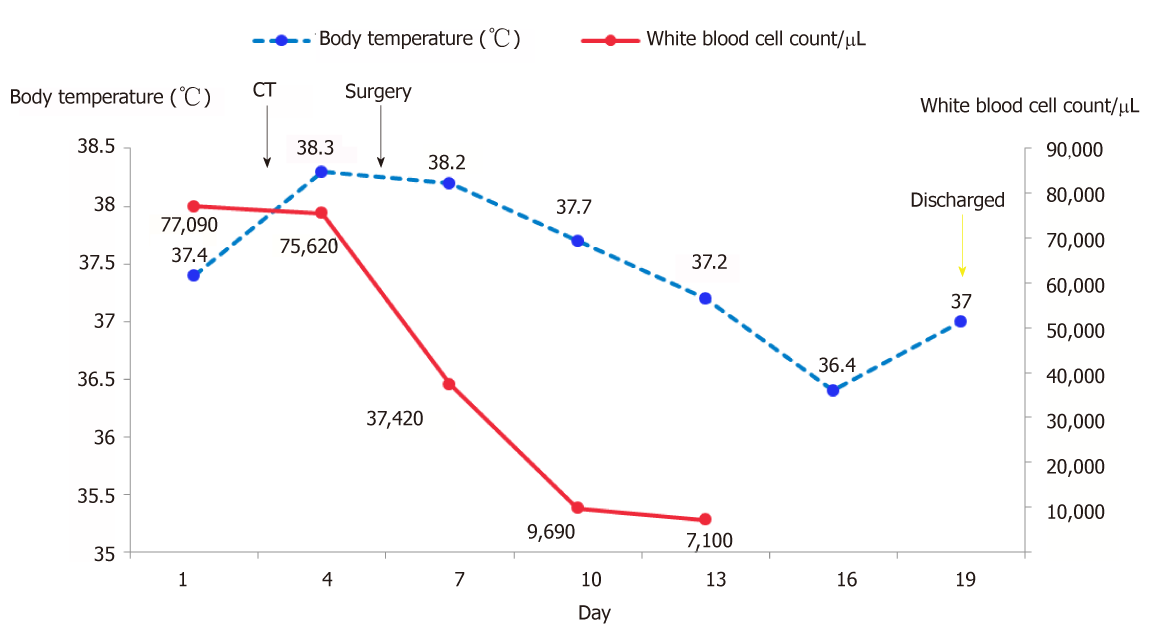
Figure 3 Illustration of the clinical course of body temperature and white blood cell counts during the second hospitalization.
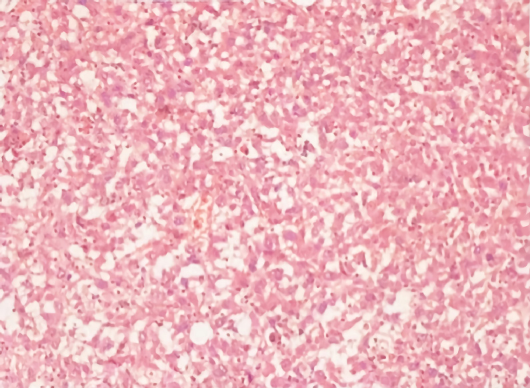
Figure 4 Microscopic image of the tumor showing poorly differentiated malignant cells suggestive of SHC.
- Citation: Hu B, Sang XT, Yang XB. Paraneoplastic leukemoid reaction in a patient with sarcomatoid hepatocellular carcinoma: A case report. World J Clin Cases 2019; 7(11): 1330-1336
- URL: https://www.wjgnet.com/2307-8960/full/v7/i11/1330.htm
- DOI: https://dx.doi.org/10.12998/wjcc.v7.i11.1330


