Copyright
©The Author(s) 2019.
World J Clin Cases. Jun 6, 2019; 7(11): 1262-1269
Published online Jun 6, 2019. doi: 10.12998/wjcc.v7.i11.1262
Published online Jun 6, 2019. doi: 10.12998/wjcc.v7.i11.1262
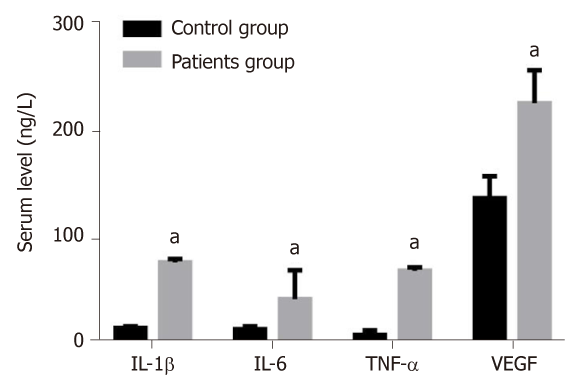
Figure 1 Levels of interleukin-1β, interleukin-6, tumor necrosis factor-α and vascular endothelial growth factor in patient and control groups.
aP < 0.05, vs control group. IL-1β: Interleukin-1β; TNF-α: Tumor necrosis factor-α; VEGF: Vascular endothelial growth factor.
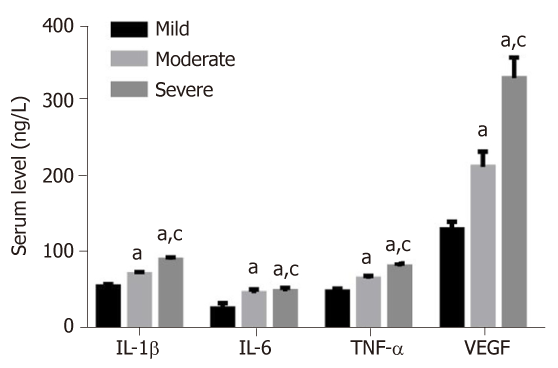
Figure 2 Serum levels of interleukin-1β, interleukin-6 and tumor necrosis factor-α in patients with different degrees of knee articular cartilage injury.
aP < 0.05, vs mild; cP < 0.05, vs moderate group. IL-1β: Interleukin-1β; TNF-α: Tumor necrosis factor-α; VEGF: Vascular endothelial growth factor.
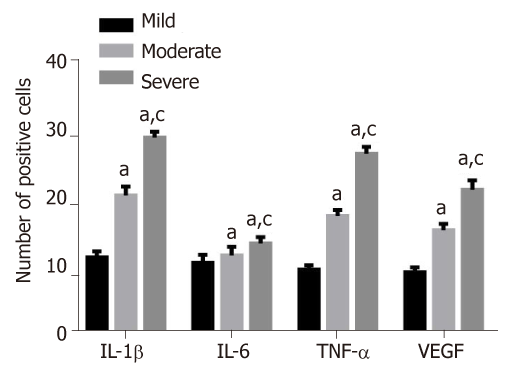
Figure 3 Immunohistochemical staining analysis of the number of positive cells of interleukin-1β, interleukin-6, tumor necrosis factor-α and vascular endothelial growth factor in synovial membrane (%).
aP < 0.05, vs mild; cP < 0.05, vs moderate group. IL-1β: Interleukin-1β; TNF-α: Tumor necrosis factor-α; VEGF: Vascular endothelial growth factor.
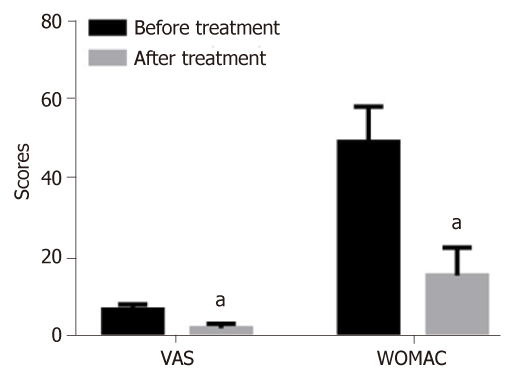
Figure 4 Comparisons of changes in clinical indices before and after treatment.
aP < 0.05, vs before treatment. VAS: Visual analogue scale; WOMAC: Western Ontario and McMaster University of Orthopaedic Index.
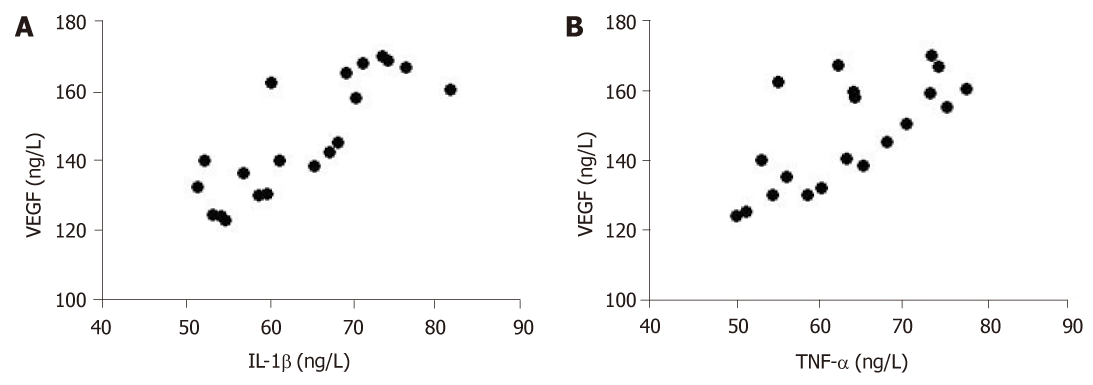
Figure 5 Correlation analysis of interleukin-1β (A) or tumor necrosis factor-α (B) with vascular endothelial growth factor.
IL-1β: Interleukin-1β; TNF-α: Tumor necrosis factor-α; VEGF: Vascular endothelial growth factor.
- Citation: Wang ZW, Chen L, Hao XR, Qu ZA, Huang SB, Ma XJ, Wang JC, Wang WM. Elevated levels of interleukin-1β, interleukin-6, tumor necrosis factor-α and vascular endothelial growth factor in patients with knee articular cartilage injury. World J Clin Cases 2019; 7(11): 1262-1269
- URL: https://www.wjgnet.com/2307-8960/full/v7/i11/1262.htm
- DOI: https://dx.doi.org/10.12998/wjcc.v7.i11.1262


