Copyright
©The Author(s) 2018.
World J Clin Cases. Dec 26, 2018; 6(16): 1094-1100
Published online Dec 26, 2018. doi: 10.12998/wjcc.v6.i16.1094
Published online Dec 26, 2018. doi: 10.12998/wjcc.v6.i16.1094
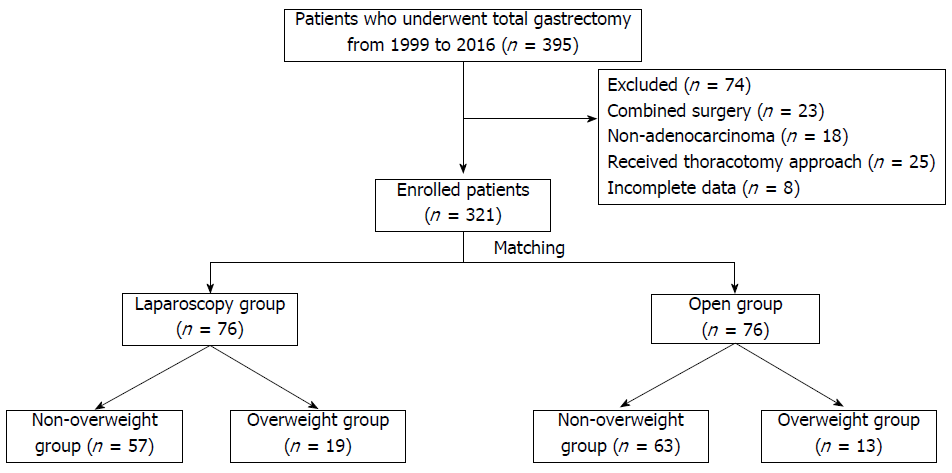
Figure 1 Flow chart of patient enrollment.
Figure 2 Kaplan-Meier curves for overall survival in the laparoscopic total gastrectomy (A) and open total gastrectomy (B) groups.
OW: Overweight.
- Citation: Nakagawa M, Kojima K, Inokuchi M, Kobayashi K, Tanioka T, Okuno K, Gokita K. Feasibility of laparoscopic total gastrectomy in overweight patients: Implications of less impact of overweight on laparoscopic versus open approach. World J Clin Cases 2018; 6(16): 1094-1100
- URL: https://www.wjgnet.com/2307-8960/full/v6/i16/1094.htm
- DOI: https://dx.doi.org/10.12998/wjcc.v6.i16.1094


