Copyright
©The Author(s) 2018.
World J Clin Cases. Dec 6, 2018; 6(15): 985-994
Published online Dec 6, 2018. doi: 10.12998/wjcc.v6.i15.985
Published online Dec 6, 2018. doi: 10.12998/wjcc.v6.i15.985
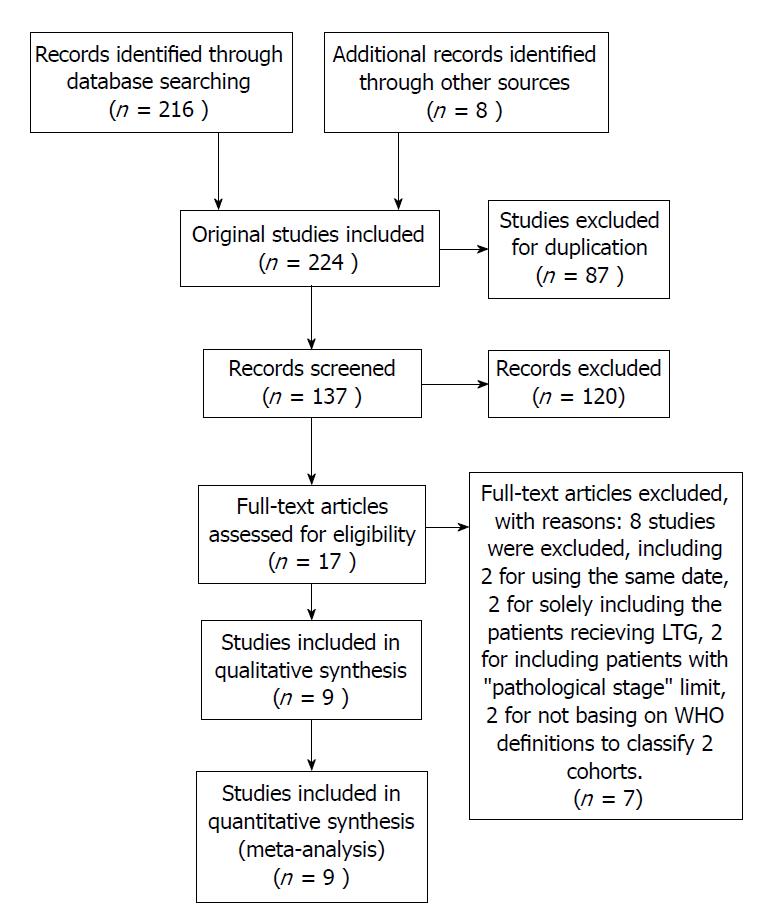
Figure 1 Flowchart of study selection in the meta-analysis.
LTG: Laparoscopic total gastrectomy.
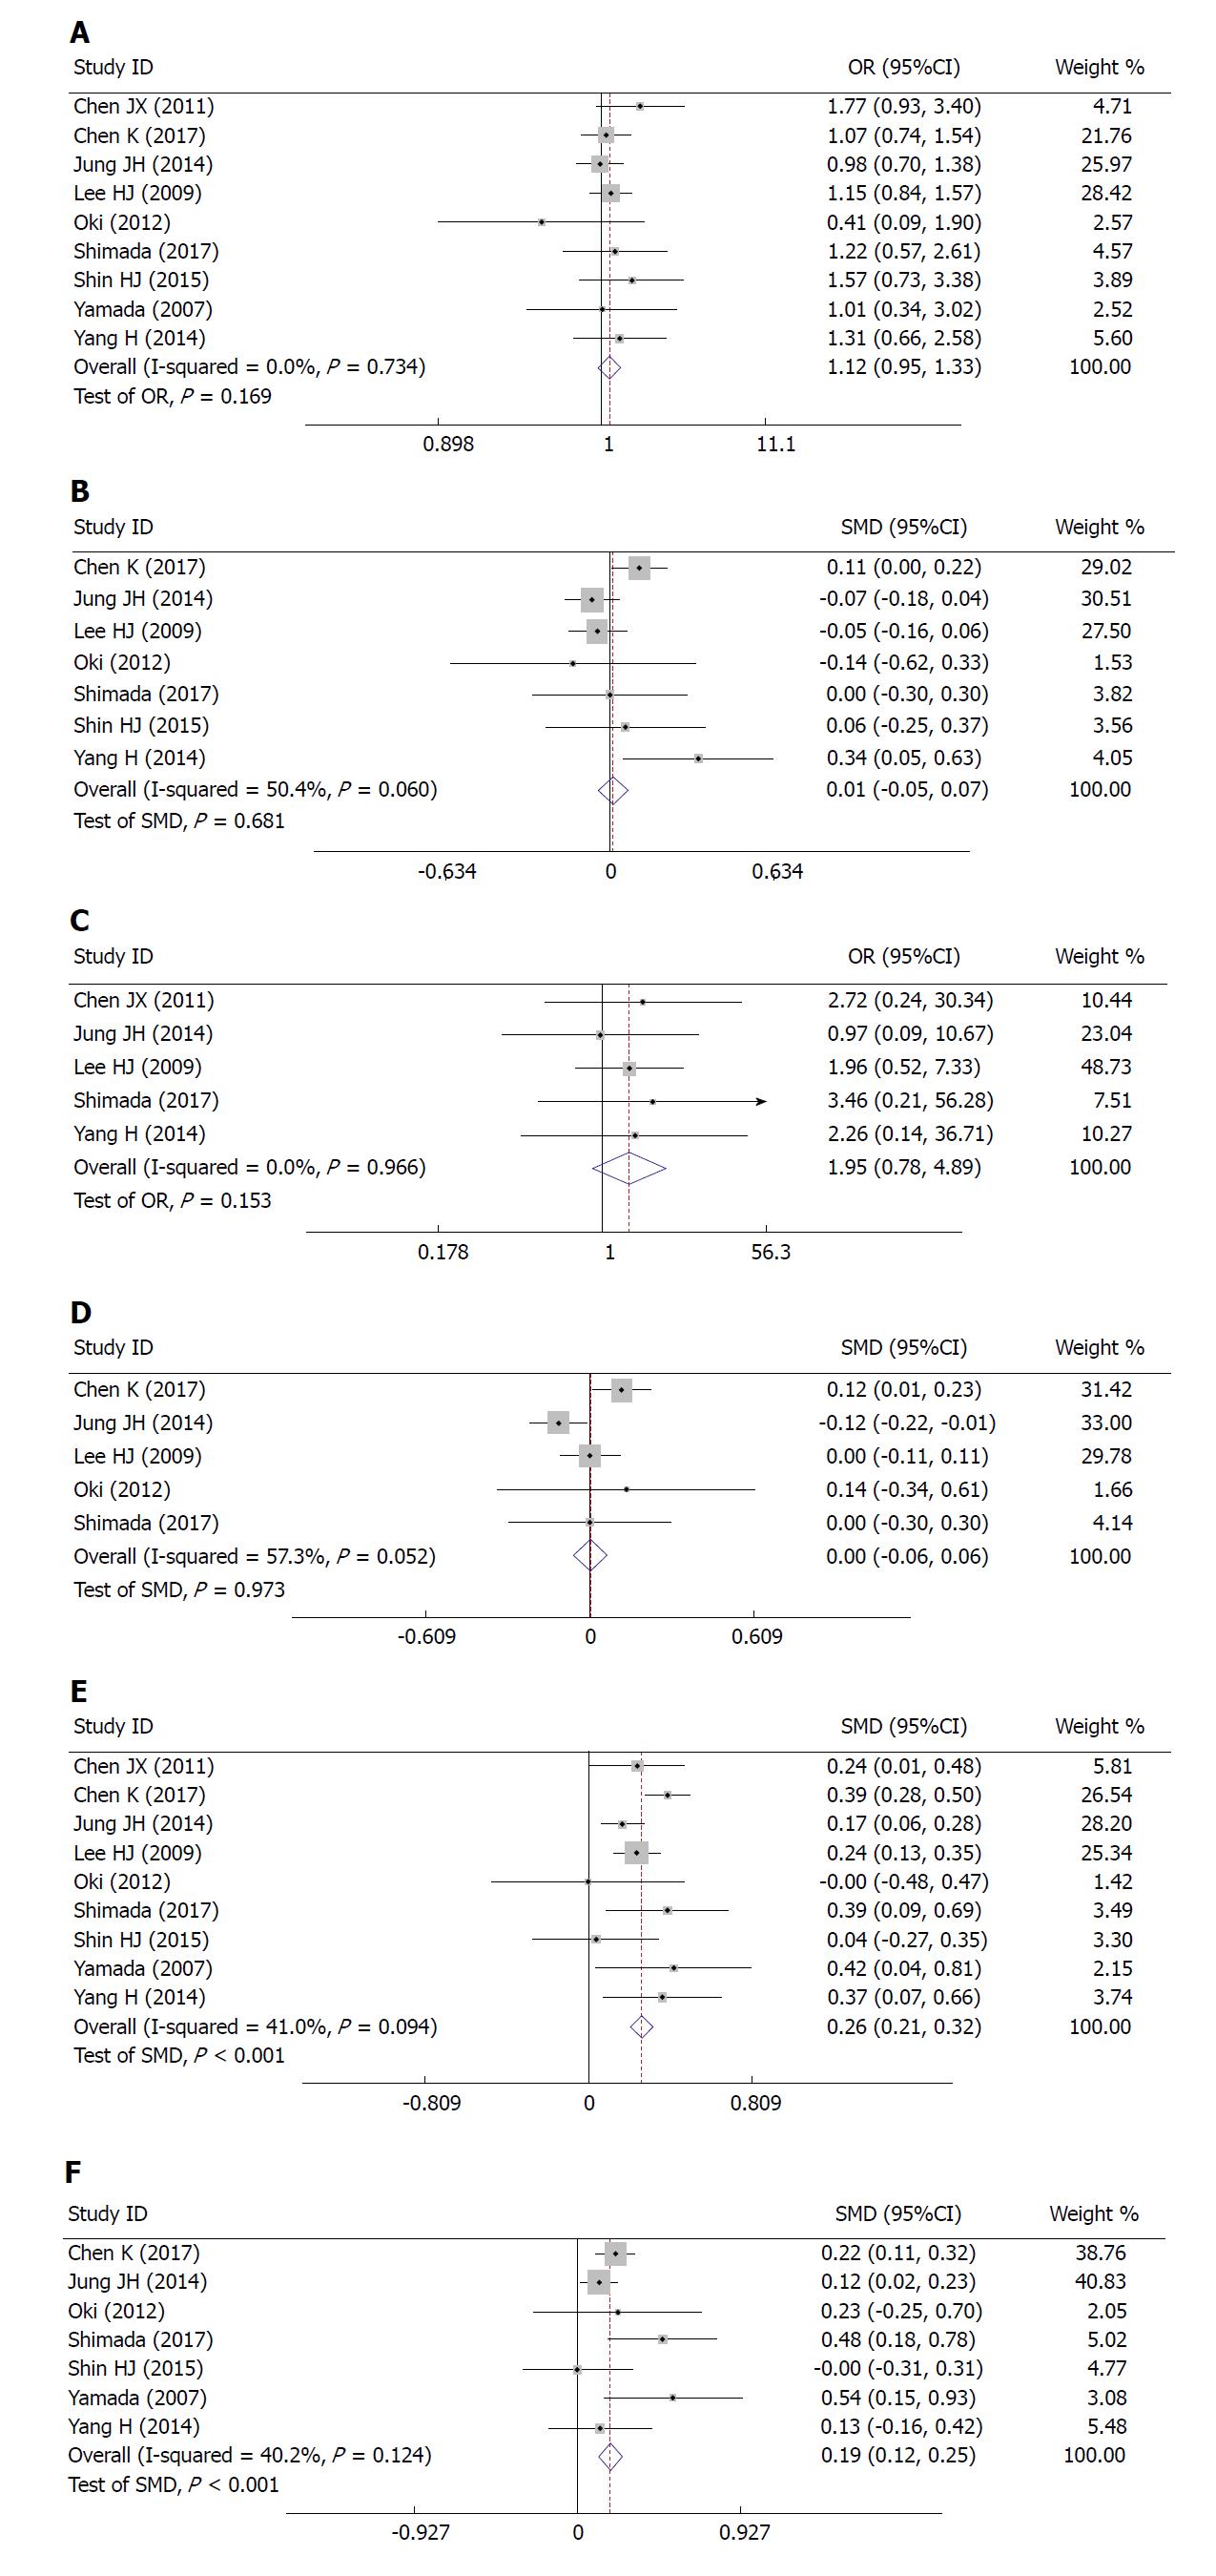
Figure 2 Correlation between body mass index and short-term outcomes/difficulties in laparoscopic gastrectomy.
A: Correlation between body mass index (BMI) and postoperative complications in laparoscopic gastrectomy; B: Correlation between BMI and the duration of the postoperative hospital stay; C: Correlation between BMI and postoperative mortality; D: Correlation between BMI and the time to resuming food intake; E: Correlation between BMI and the operative time; F: Correlation between BMI and blood loss. SMD: Standard mean difference.
Figure 3 Sensitive analysis of association of postoperative complications and operative time with body mass index.
A: Sensitive analysis of correlation between body mass index (BMI) and postoperative complications in laparoscopic gastrectomy; B: Sensitive analysis of correlation between BMI and the operative time.
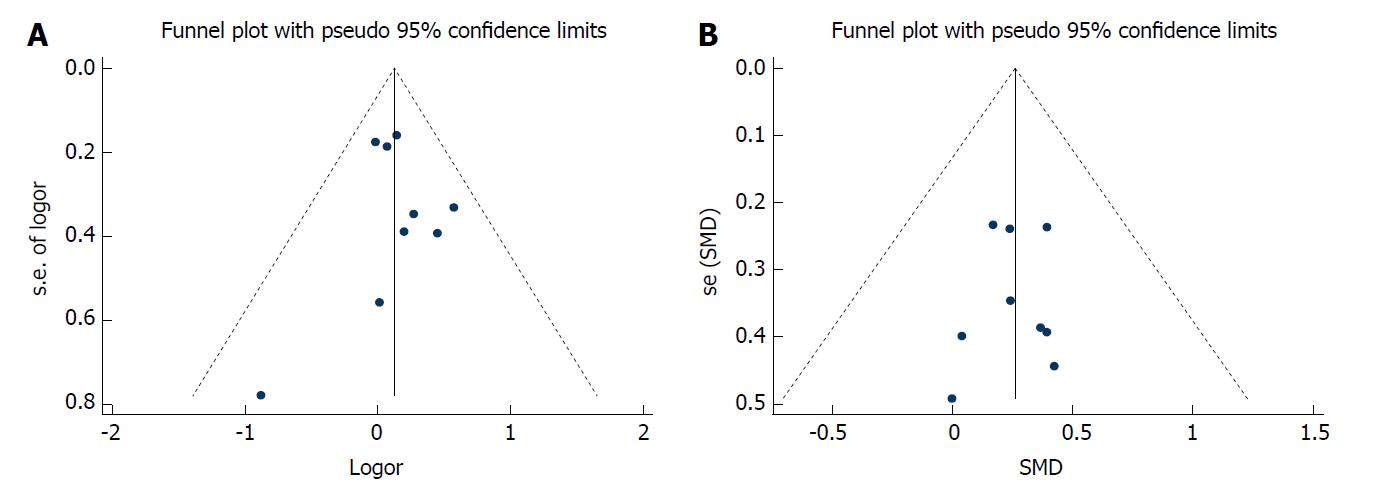
Figure 4 Funnel plot analysis of association of postoperative complications and operative time with body mass index.
A: Funnel plot analysis of correlation between body mass index (BMI) and postoperative complications in laparoscopic gastrectomy; B: Funnel plot analysis of correlation between BMI and the operative time. SMD: Standard mean difference.
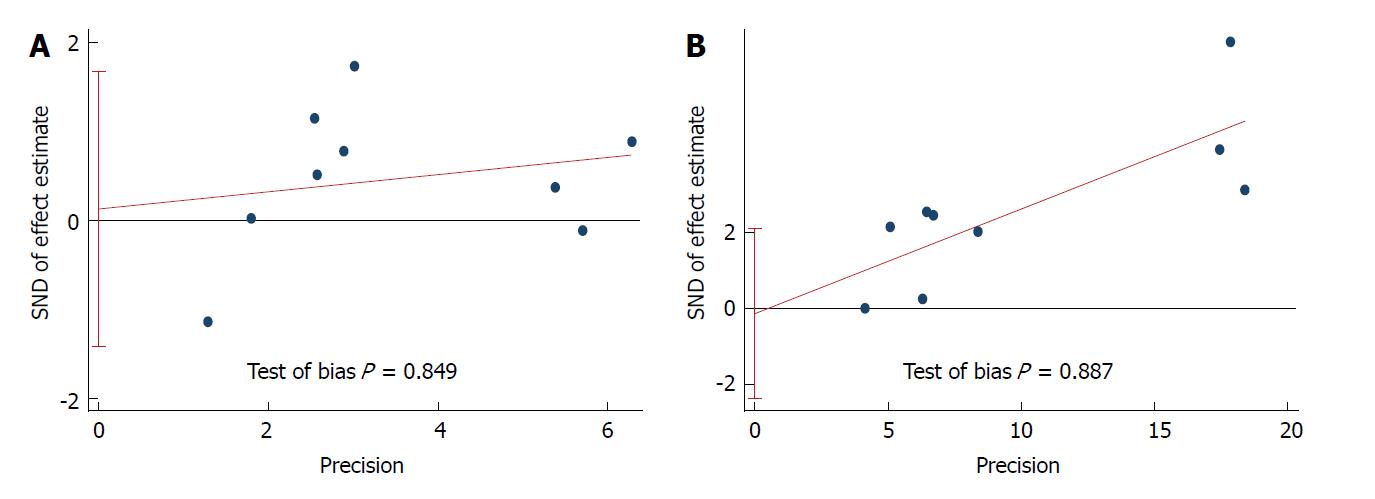
Figure 5 Egger’s test of association of postoperative complications and operative time with body mass index.
A: Egger’s test of correlation between body mass index (BMI) and postoperative complications in laparoscopic gastrectomy; B: Egger’s test of correlation between BMI and the operative time.
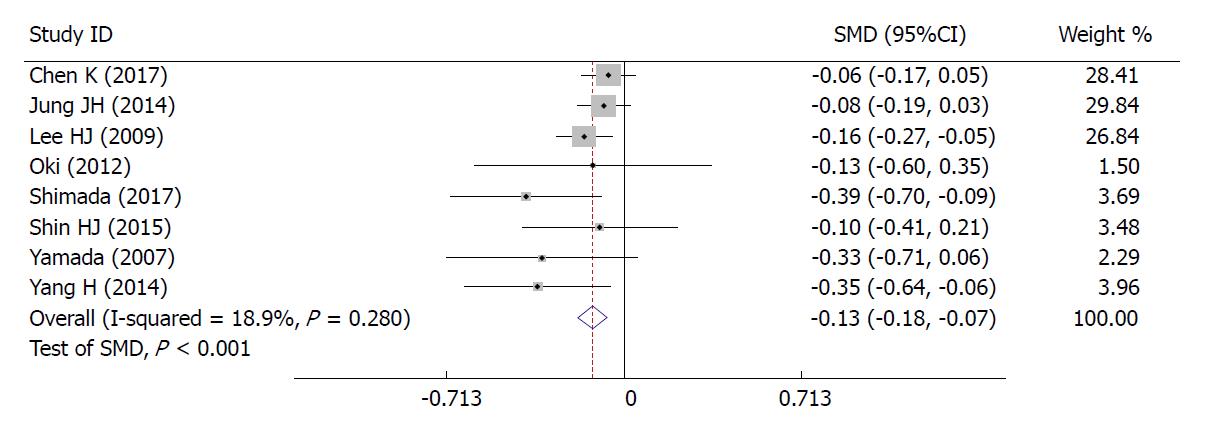
Figure 6 Correlation between body mass index and the number of retrieved lymph node.
SMD: Standard mean difference.
- Citation: Chen HK, Zhu GW, Huang YJ, Zheng W, Yang SG, Ye JX. Impact of body mass index on short-term outcomes of laparoscopic gastrectomy in Asian patients: A meta-analysis. World J Clin Cases 2018; 6(15): 985-994
- URL: https://www.wjgnet.com/2307-8960/full/v6/i15/985.htm
- DOI: https://dx.doi.org/10.12998/wjcc.v6.i15.985


