Copyright
©The Author(s) 2015.
World J Clin Cases. Jul 16, 2015; 3(7): 640-649
Published online Jul 16, 2015. doi: 10.12998/wjcc.v3.i7.640
Published online Jul 16, 2015. doi: 10.12998/wjcc.v3.i7.640
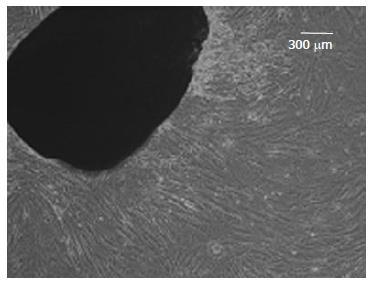
Figure 1 The Wharton’s Jelly mesenchymal stromal cells were grown from the edge of tissue explants (× 100).
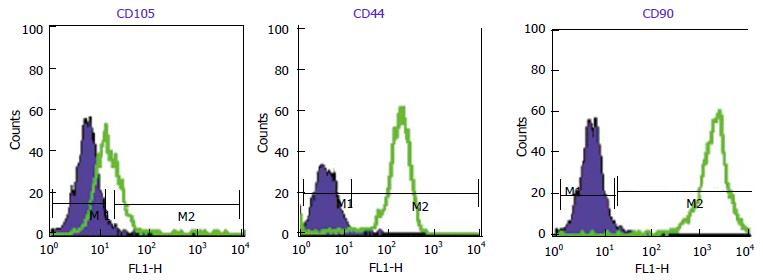
Figure 2 Flow cytometry histogram of Wharton’s jelly derived mesenchymal stromal cells (CD90, CD105, CD44).
WJ-MSCs are positive for these markers. Dark Blue lines indicate background fluorescence obtained with isotype control. WJ-MSCs: Wharton’s jelly derived mesenchymal stromal cells.
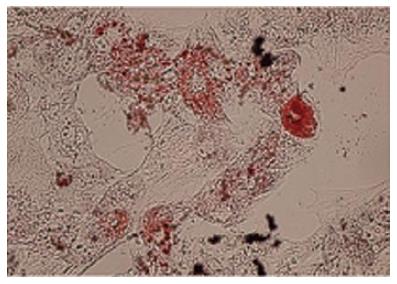
Figure 3 Fat droplets confirmed the adipogenic potential of Wharton’s
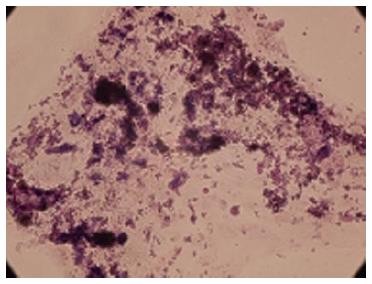
Figure 4 Calcium deposition confirmed the osteogenic potential of Wharton’s jelly derived mesenchymal stromal cells (Alizarin Red staining × 100).
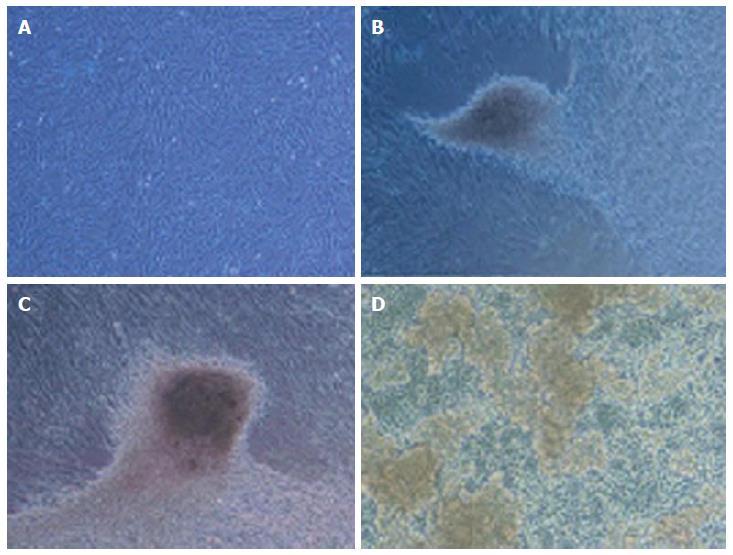
Figure 5 Morphological differentiation of insulin producing clusters from Wharton’s jelly derived mesenchymal stromal cells in different stages (A-D × 100).
A: WJ-MSCs were typically an adherent spindle shape; B and C: The cells gradually formed clusters in the medium 14 d after differentiation; D: At the end of final stage clusters were floated in the medium. WJ-MSCs: Wharton’s jelly derived mesenchymal stromal cells.
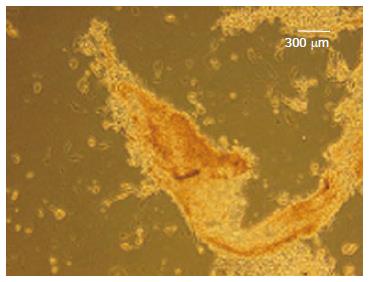
Figure 6 Dithizone staining.
The differentiated cells stained as red color (× 100).
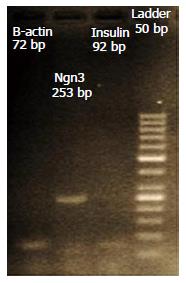
Figure 7 Expression of Ngn3, Insulin, PDX1, Oct4 and Nanog transcription factors were confirmed by electrophoresis.
-
Citation: Nekoei SM, Azarpira N, Sadeghi L, Kamalifar S.
In vitro differentiation of human umbilical cord Wharton’s jelly mesenchymal stromal cells to insulin producing clusters. World J Clin Cases 2015; 3(7): 640-649 - URL: https://www.wjgnet.com/2307-8960/full/v3/i7/640.htm
- DOI: https://dx.doi.org/10.12998/wjcc.v3.i7.640


