Copyright
©The Author(s) 2015.
World J Clin Cases. Jul 16, 2015; 3(7): 625-634
Published online Jul 16, 2015. doi: 10.12998/wjcc.v3.i7.625
Published online Jul 16, 2015. doi: 10.12998/wjcc.v3.i7.625
Math 3 Math(A3).
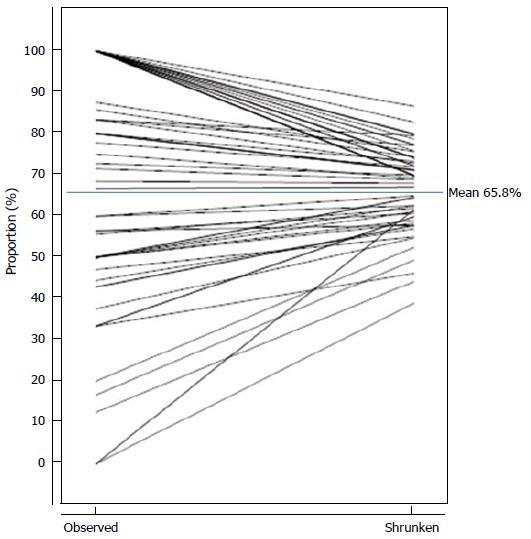
Figure 1 Shrinkage Plot showing Observed and Shrunken Proportions for 62 Healthcare Organisations.
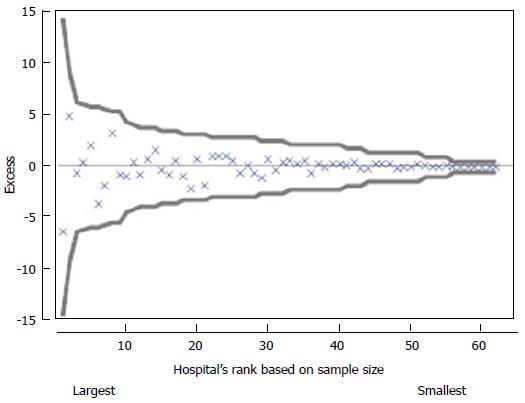
Figure 2 Funnel Plot of Shrunken Estimates of Excess (difference in Observed and Expected) counts for 62 healthcare organisation submissions for clinical indicator 2.
1.
- Citation: Howley PP, Hancock SJ, Gibberd RW, Chuang S, Tuyl FA. Bayesian methods in reporting and managing Australian clinical indicators. World J Clin Cases 2015; 3(7): 625-634
- URL: https://www.wjgnet.com/2307-8960/full/v3/i7/625.htm
- DOI: https://dx.doi.org/10.12998/wjcc.v3.i7.625


