Copyright
©The Author(s) 2025.
World J Clin Cases. Aug 16, 2025; 13(23): 101742
Published online Aug 16, 2025. doi: 10.12998/wjcc.v13.i23.101742
Published online Aug 16, 2025. doi: 10.12998/wjcc.v13.i23.101742
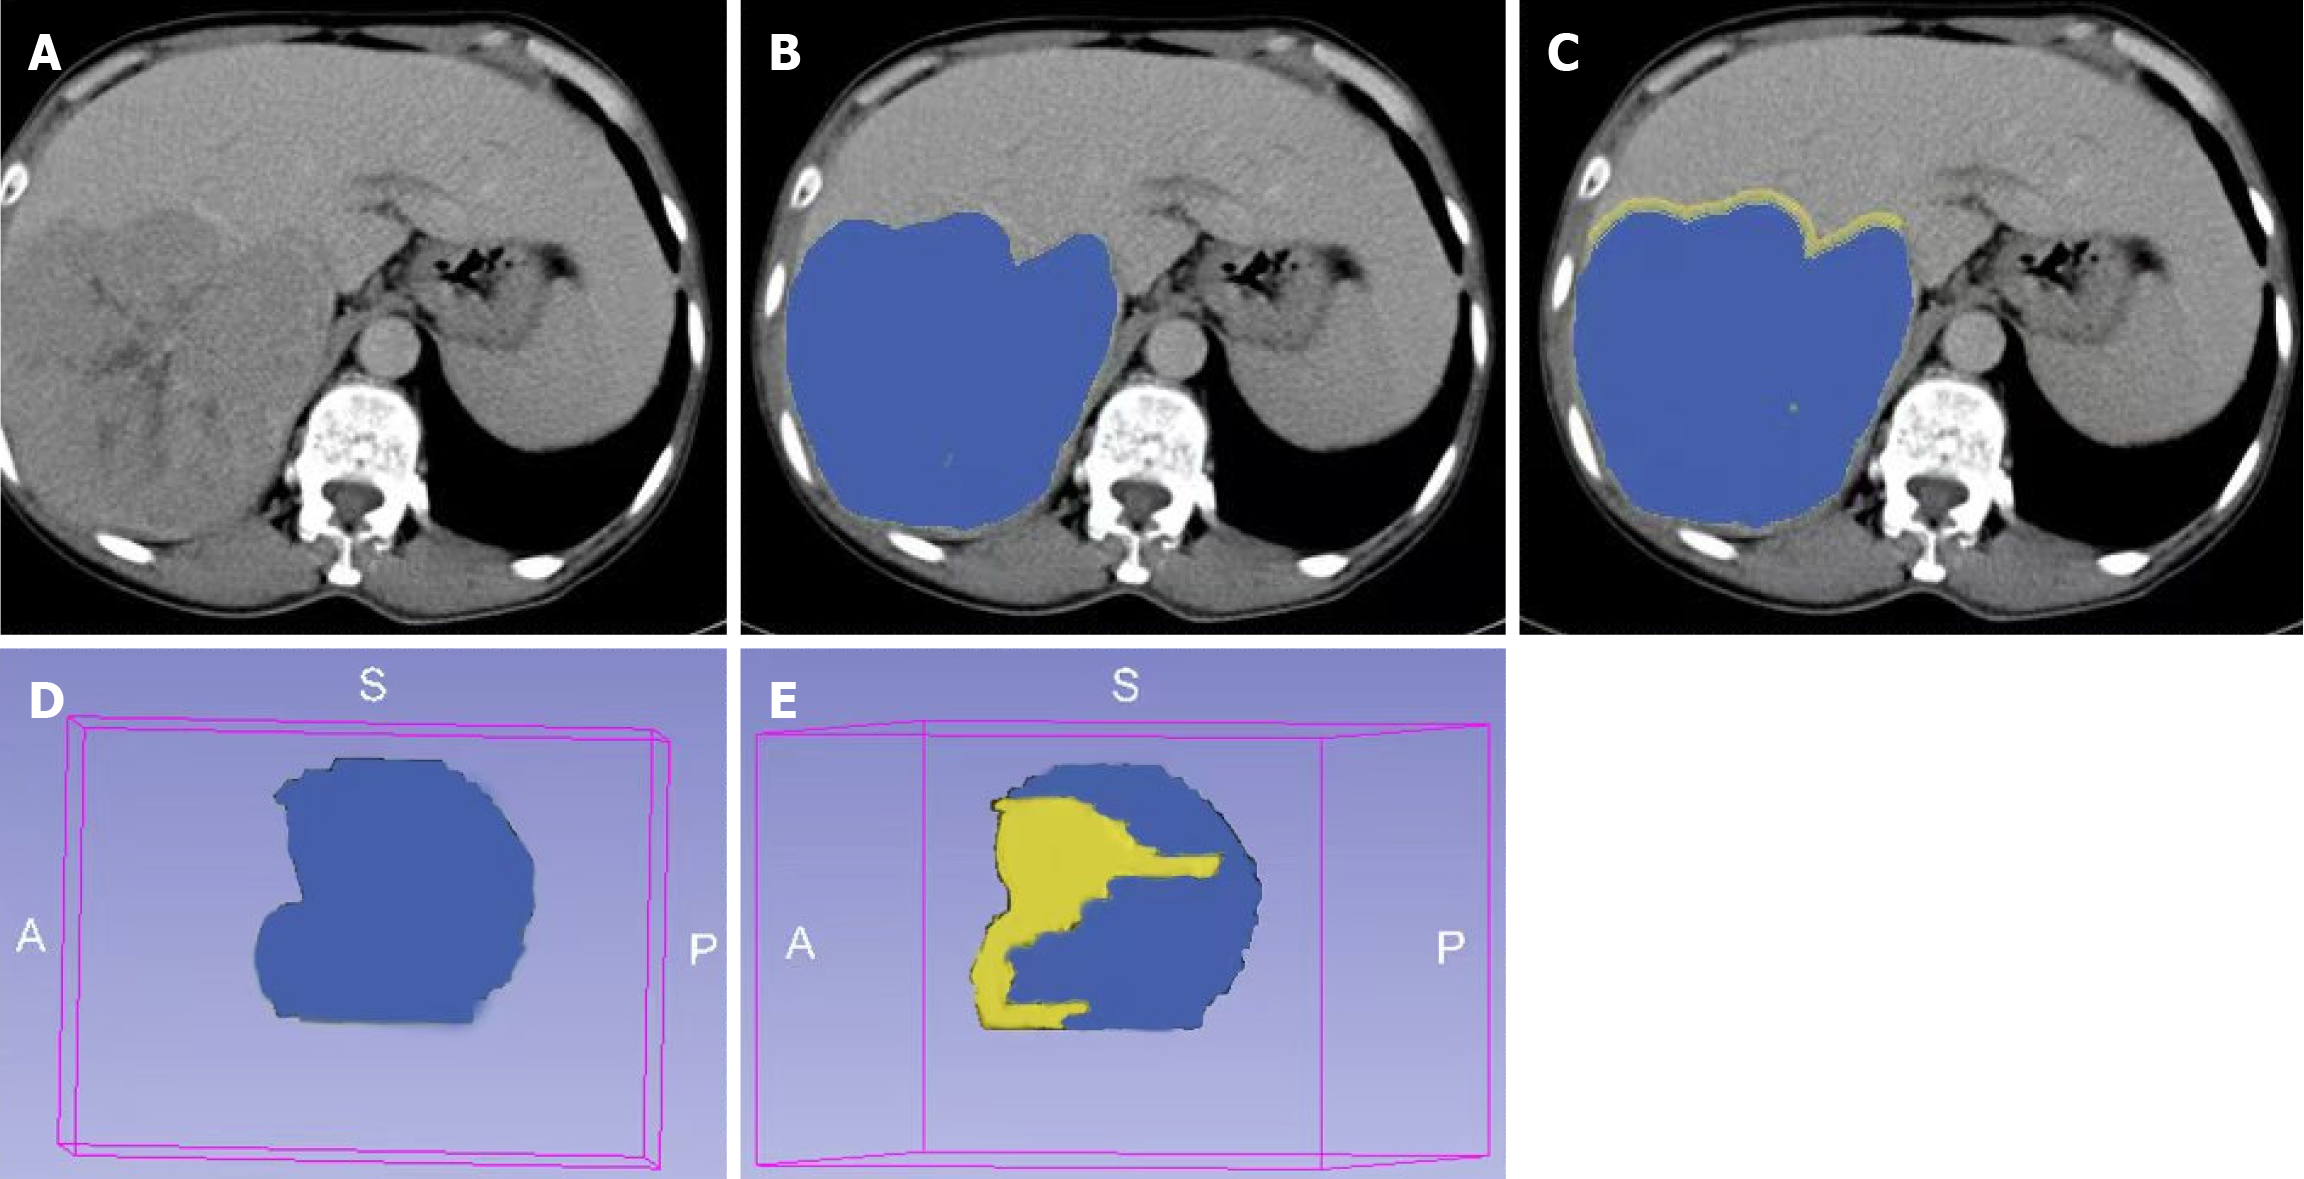
Figure 1 Schematic of the segmentation of the tumor region of interest.
A: Original tumor image; B: Tumor regions of interest (ROI); C: Peritumoral 10-mm ROI; D: 3D simulation of the tumor; E: 3D simulation of the tumor and tumor peritumoral regions.
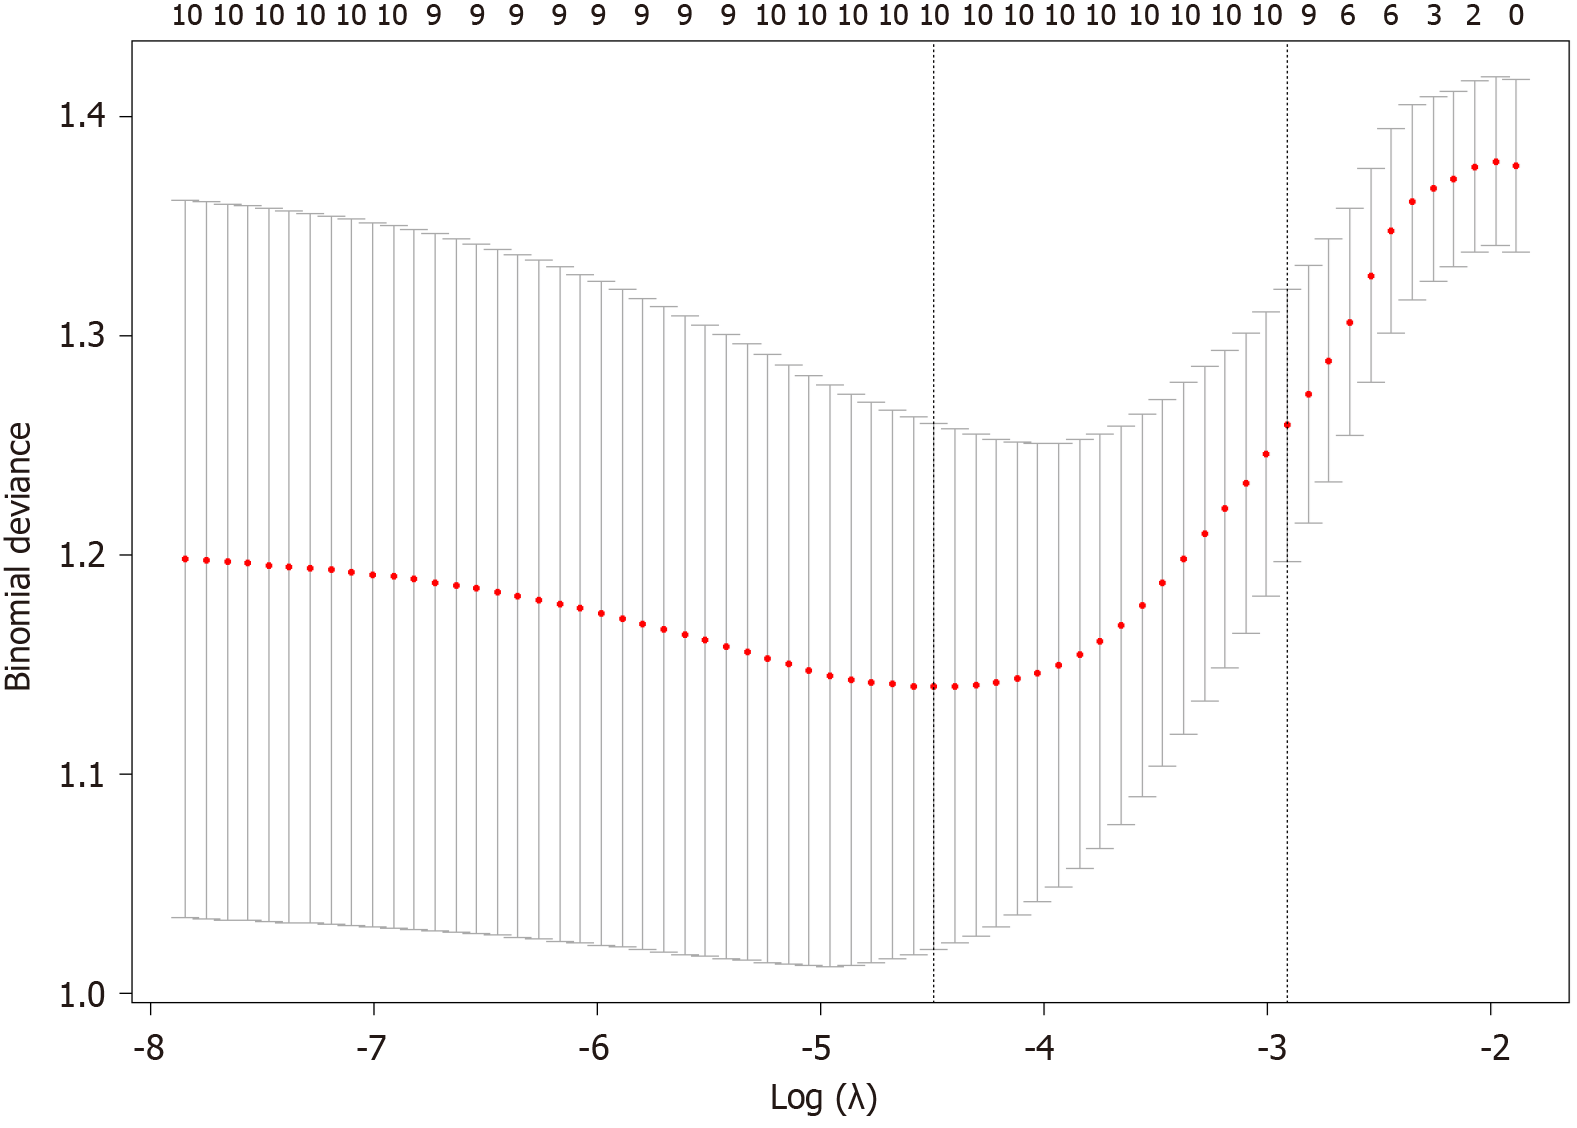
Figure 2
Schematic diagram of Lasso screening.
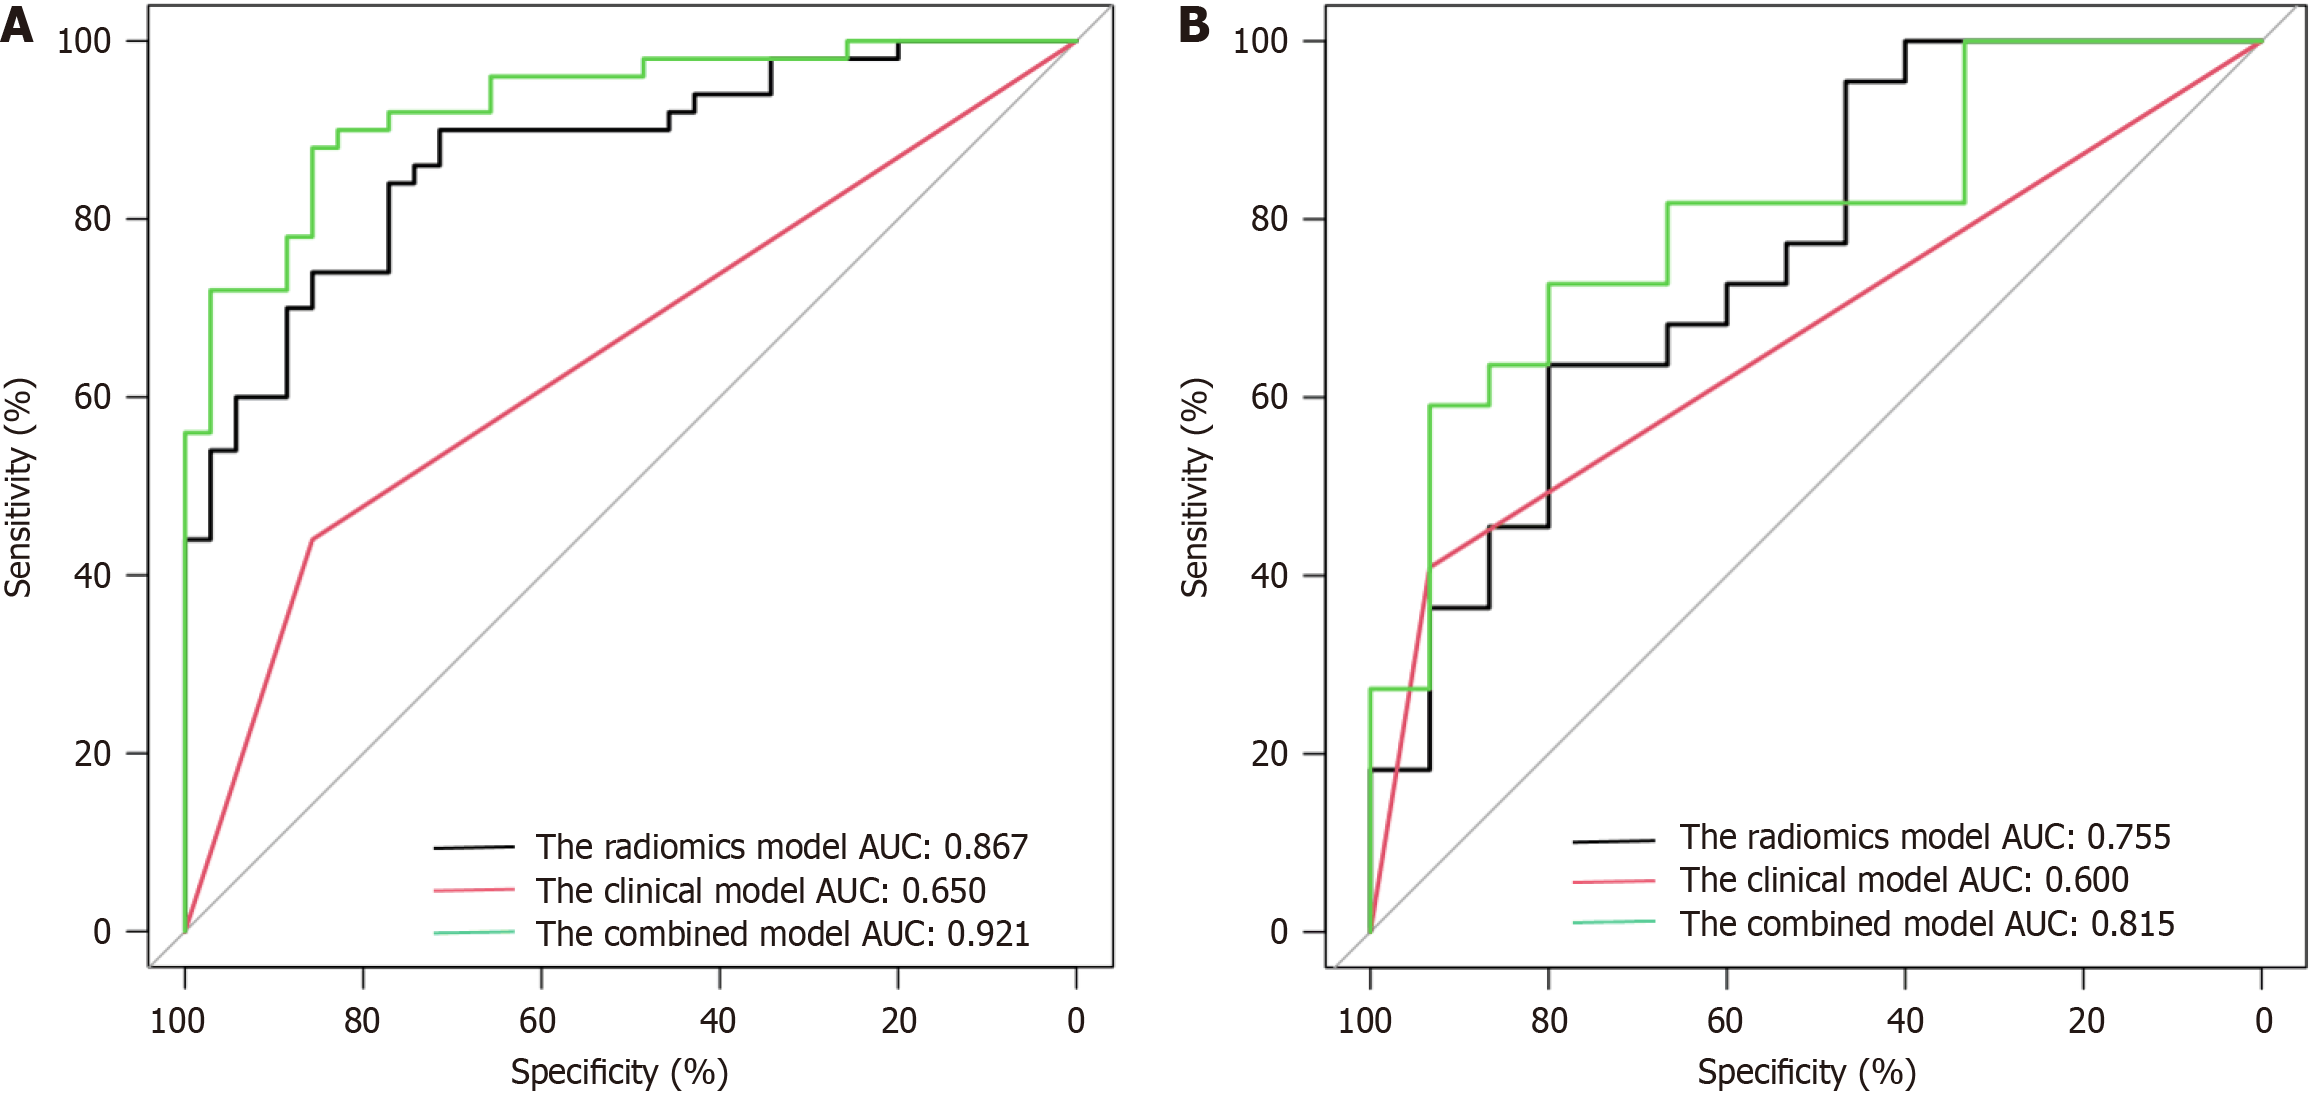
Figure 3 Receiver operating characteristic curves.
A: Receiver operating characteristic (ROC) curves of different models in the training cohorts; B: ROC curves of different models in the validation cohorts.
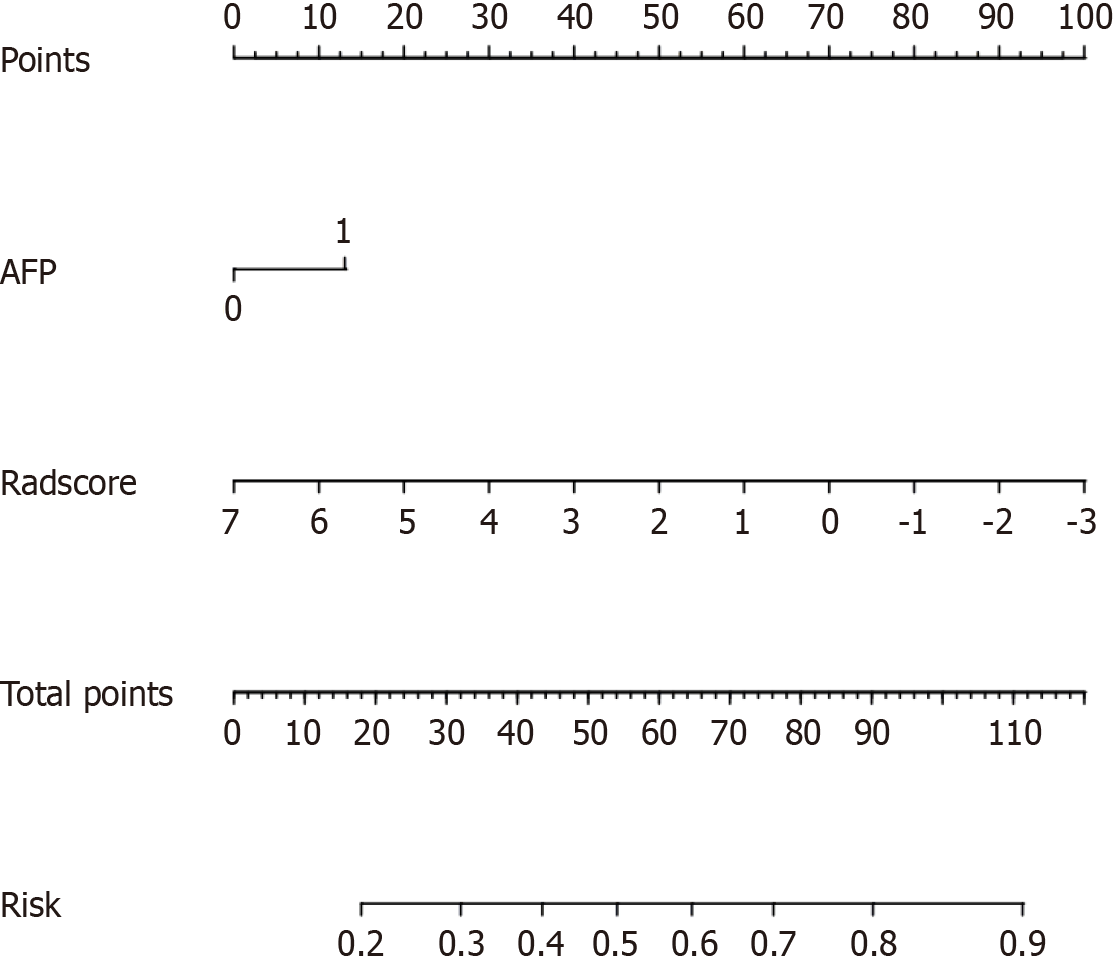
Figure 4 Nomogram.
A nomogram prediction model of first-line treatment efficacy in patients with hepatocellular carcinoma consisting of two predictors, the alpha-fetoprotein level and the Rad-score, was developed.
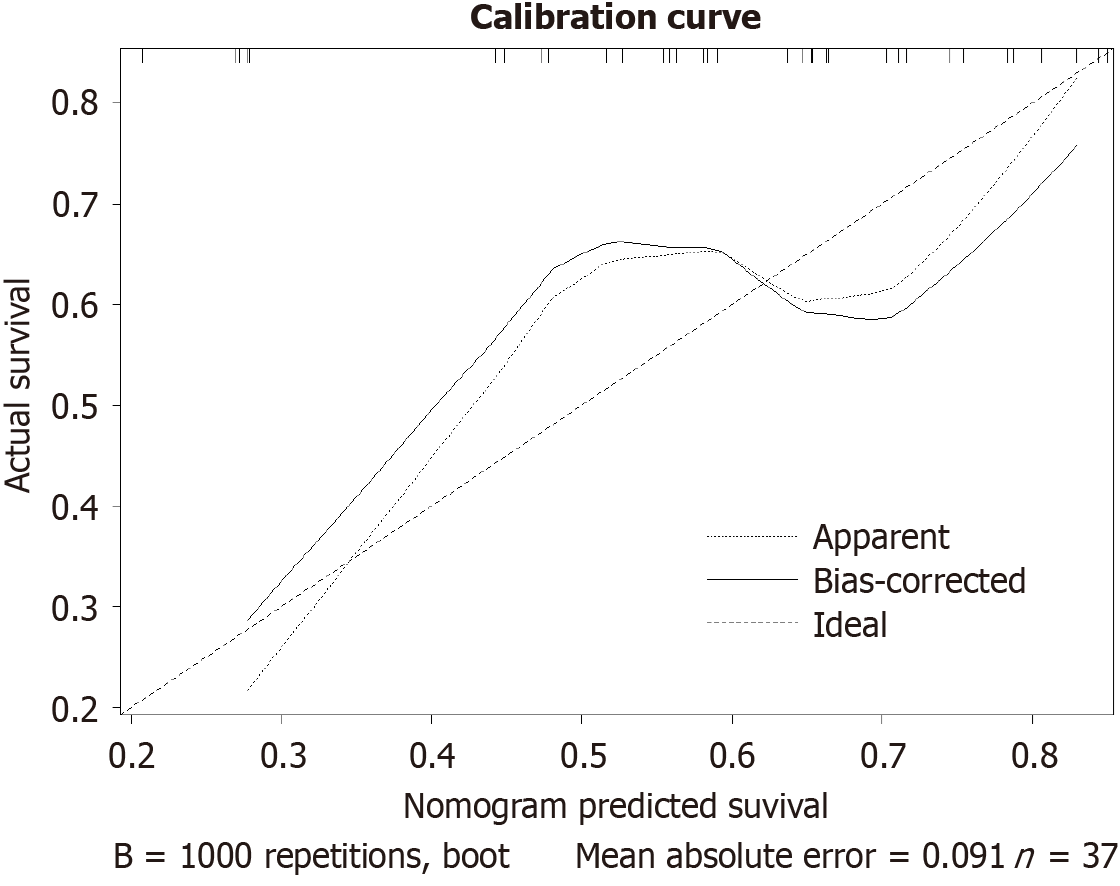
Figure 5
Nomogram calibration curve.
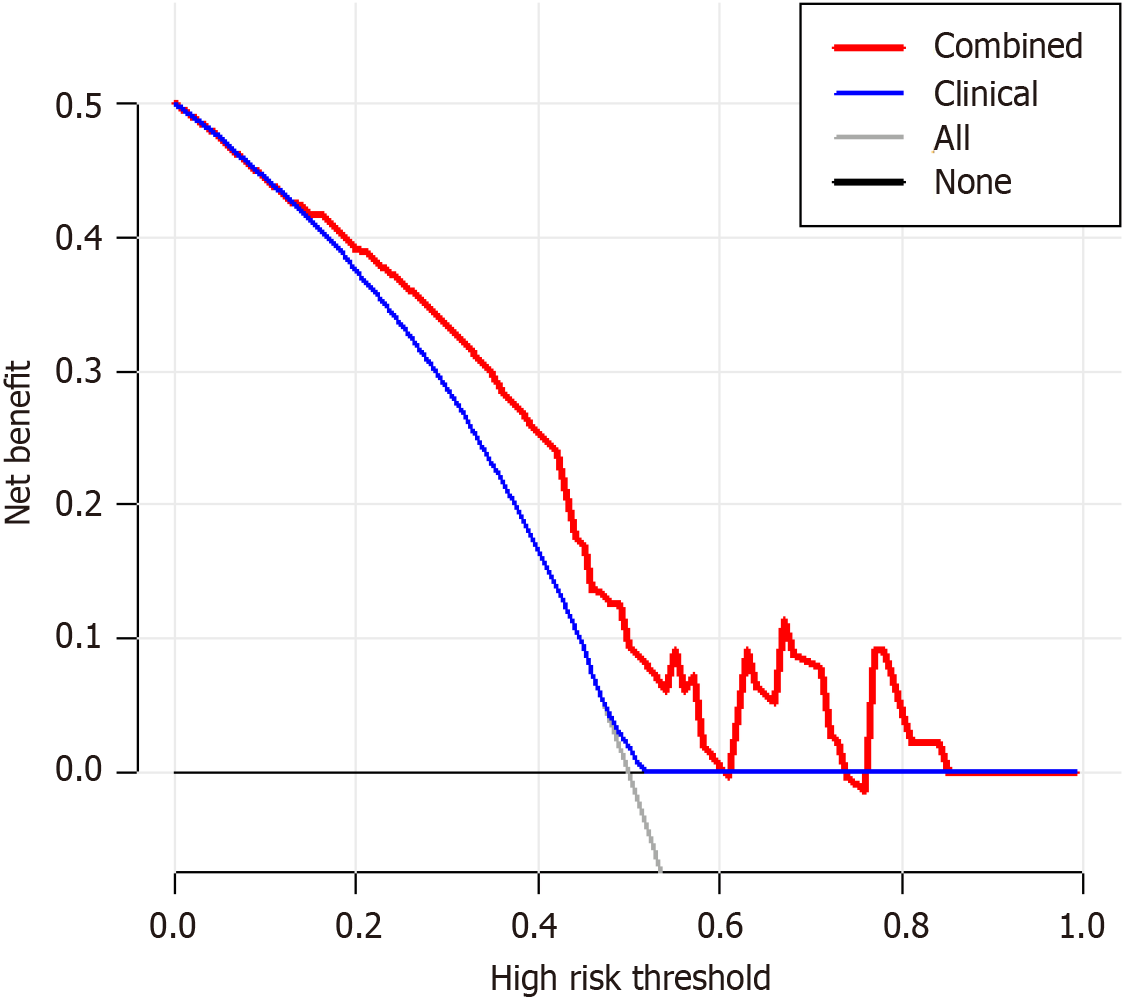
Figure 6 Decision curve analysis.
The results of the decision curve analysis revealed that the net clinical benefit of the combined model was greater than that of the clinical model at all threshold probabilities between 0.16 and 0.76.
- Citation: Zhao KF, Xie CB, Wu Y. Prediction of the efficacy of first transarterial chemoembolization for advanced hepatocellular carcinoma via a clinical-radiomics model. World J Clin Cases 2025; 13(23): 101742
- URL: https://www.wjgnet.com/2307-8960/full/v13/i23/101742.htm
- DOI: https://dx.doi.org/10.12998/wjcc.v13.i23.101742


