Copyright
©The Author(s) 2024.
World J Clin Cases. May 6, 2024; 12(13): 2160-2172
Published online May 6, 2024. doi: 10.12998/wjcc.v12.i13.2160
Published online May 6, 2024. doi: 10.12998/wjcc.v12.i13.2160
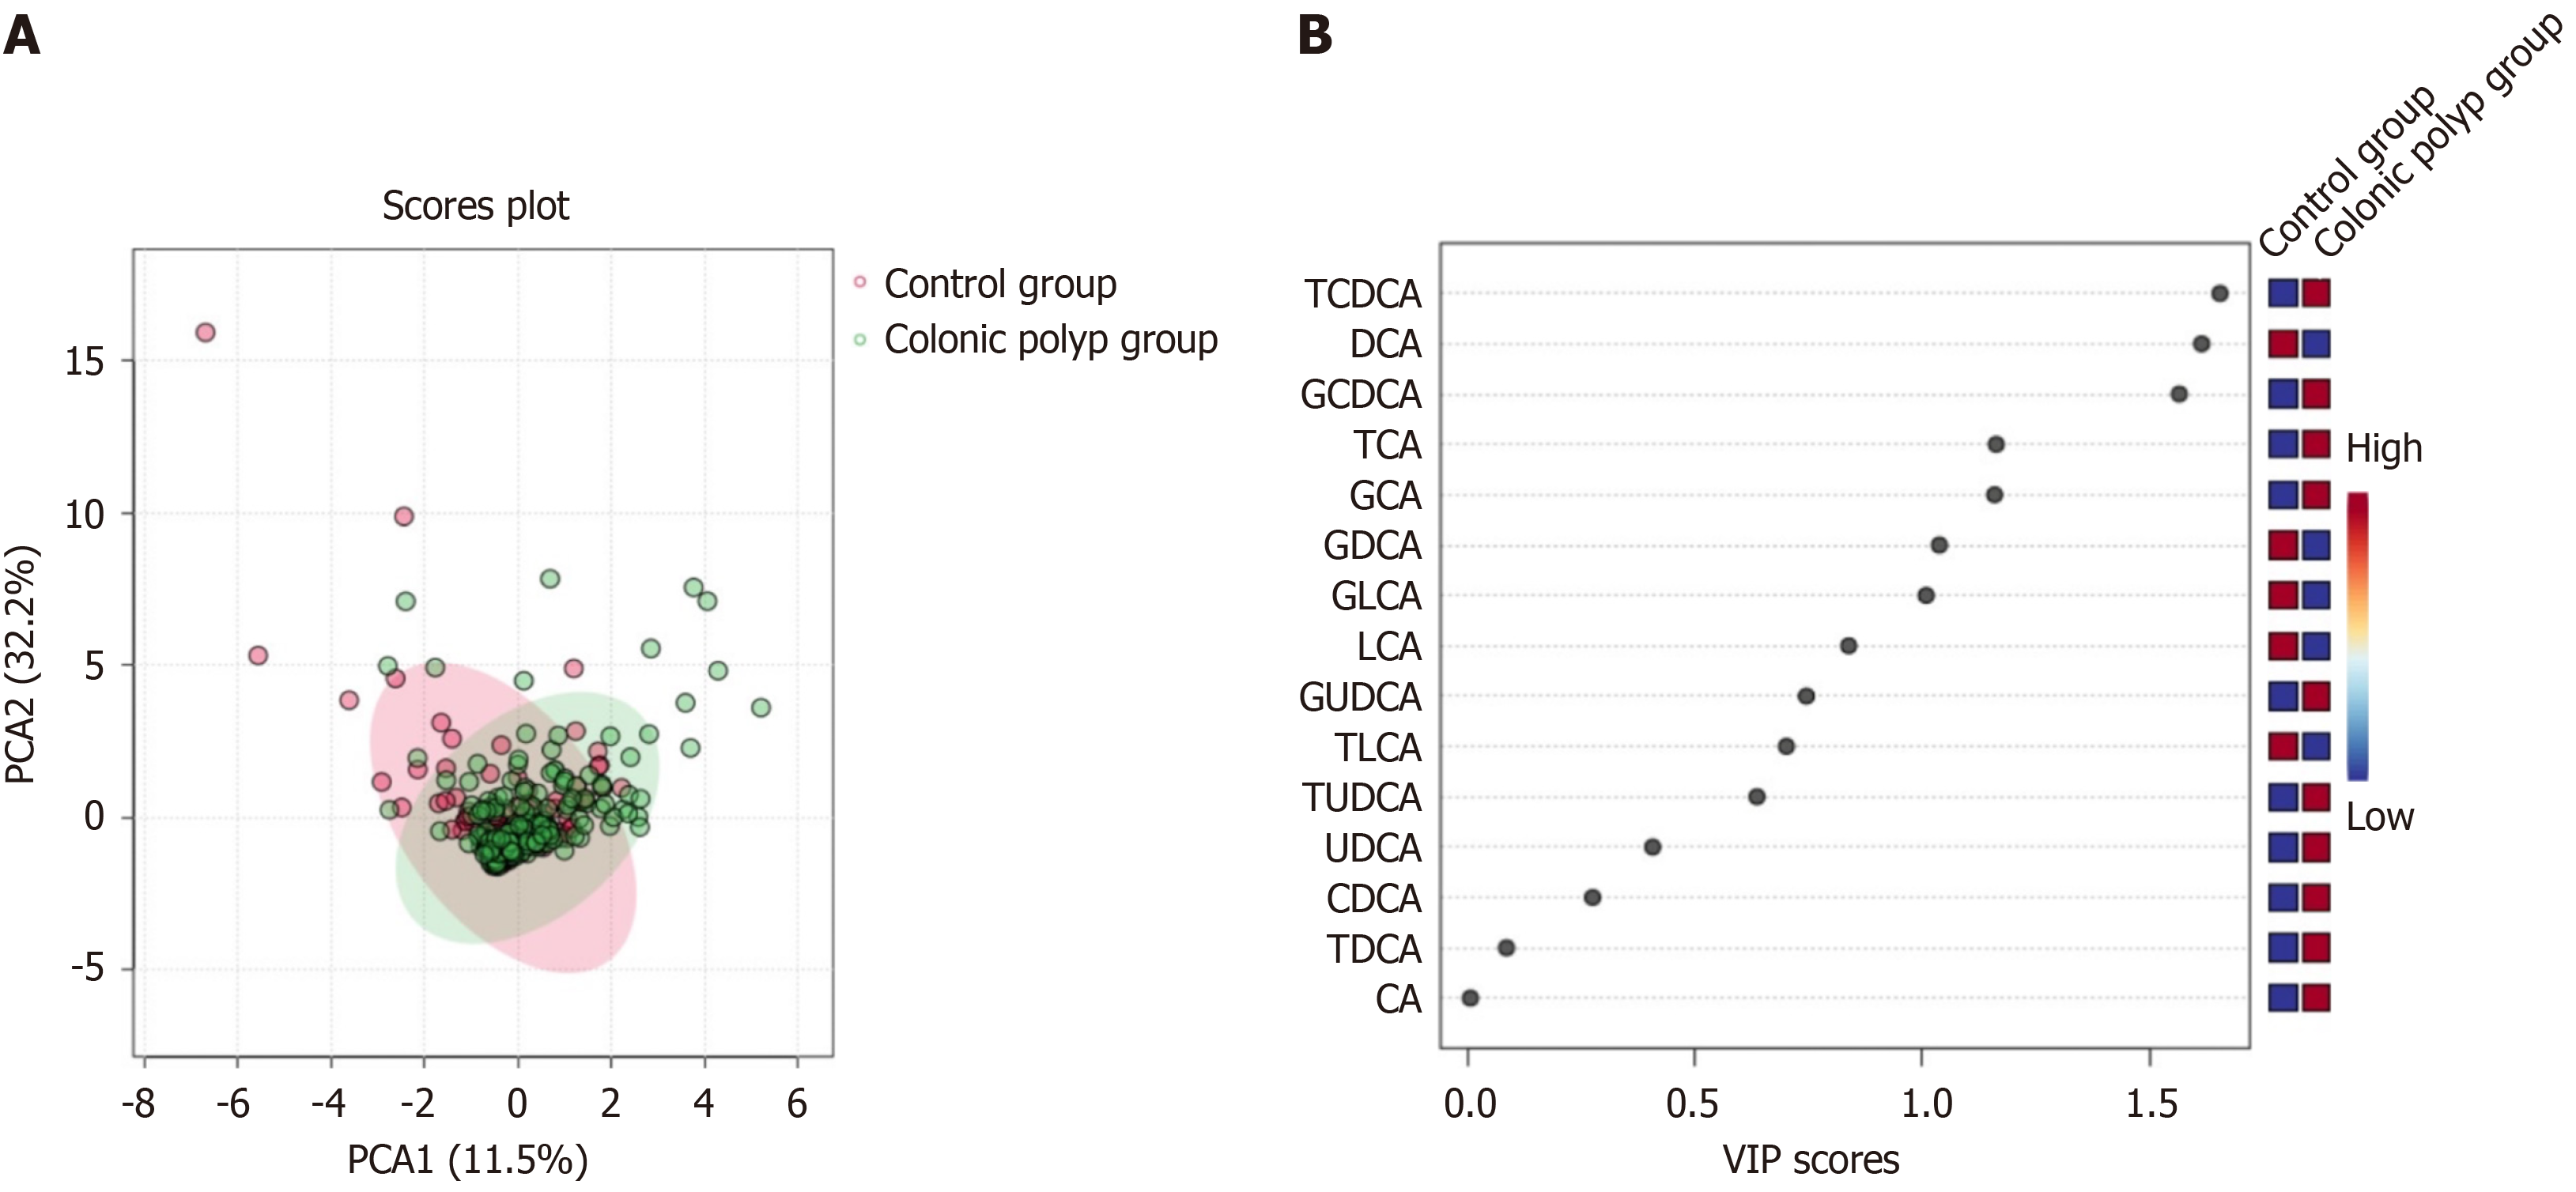
Figure 1 Orthogonal partial least squares discriminant analysis of the control group and colonic polyp group.
A: Score map; B: Variable importance in projection score map. PCA: Principal Component Analysis; CA: Cholic acid; CDCA: Chenodeoxycholic acid; TCA: Taurocholic acid; GCA: Glycocholic acid; TCDCA: Taurochenodeoxycholic acid; GCDCA: Glycochenodeoxycholic acid; DCA: Deoxycholic acid; UDCA: Ursodeoxycholic acid; LCA: Lithocholic acid; TDCA: Tauroursodeoxycholic acid; GDCA: Glycodeoxycholic acid; TUDCA: Tauroursodeoxycholic acid; GUDCA: Glycoursodeoxycholic acid; TLCA: Taurolithocholic acid; GLCA: Glycolithocholic acid.
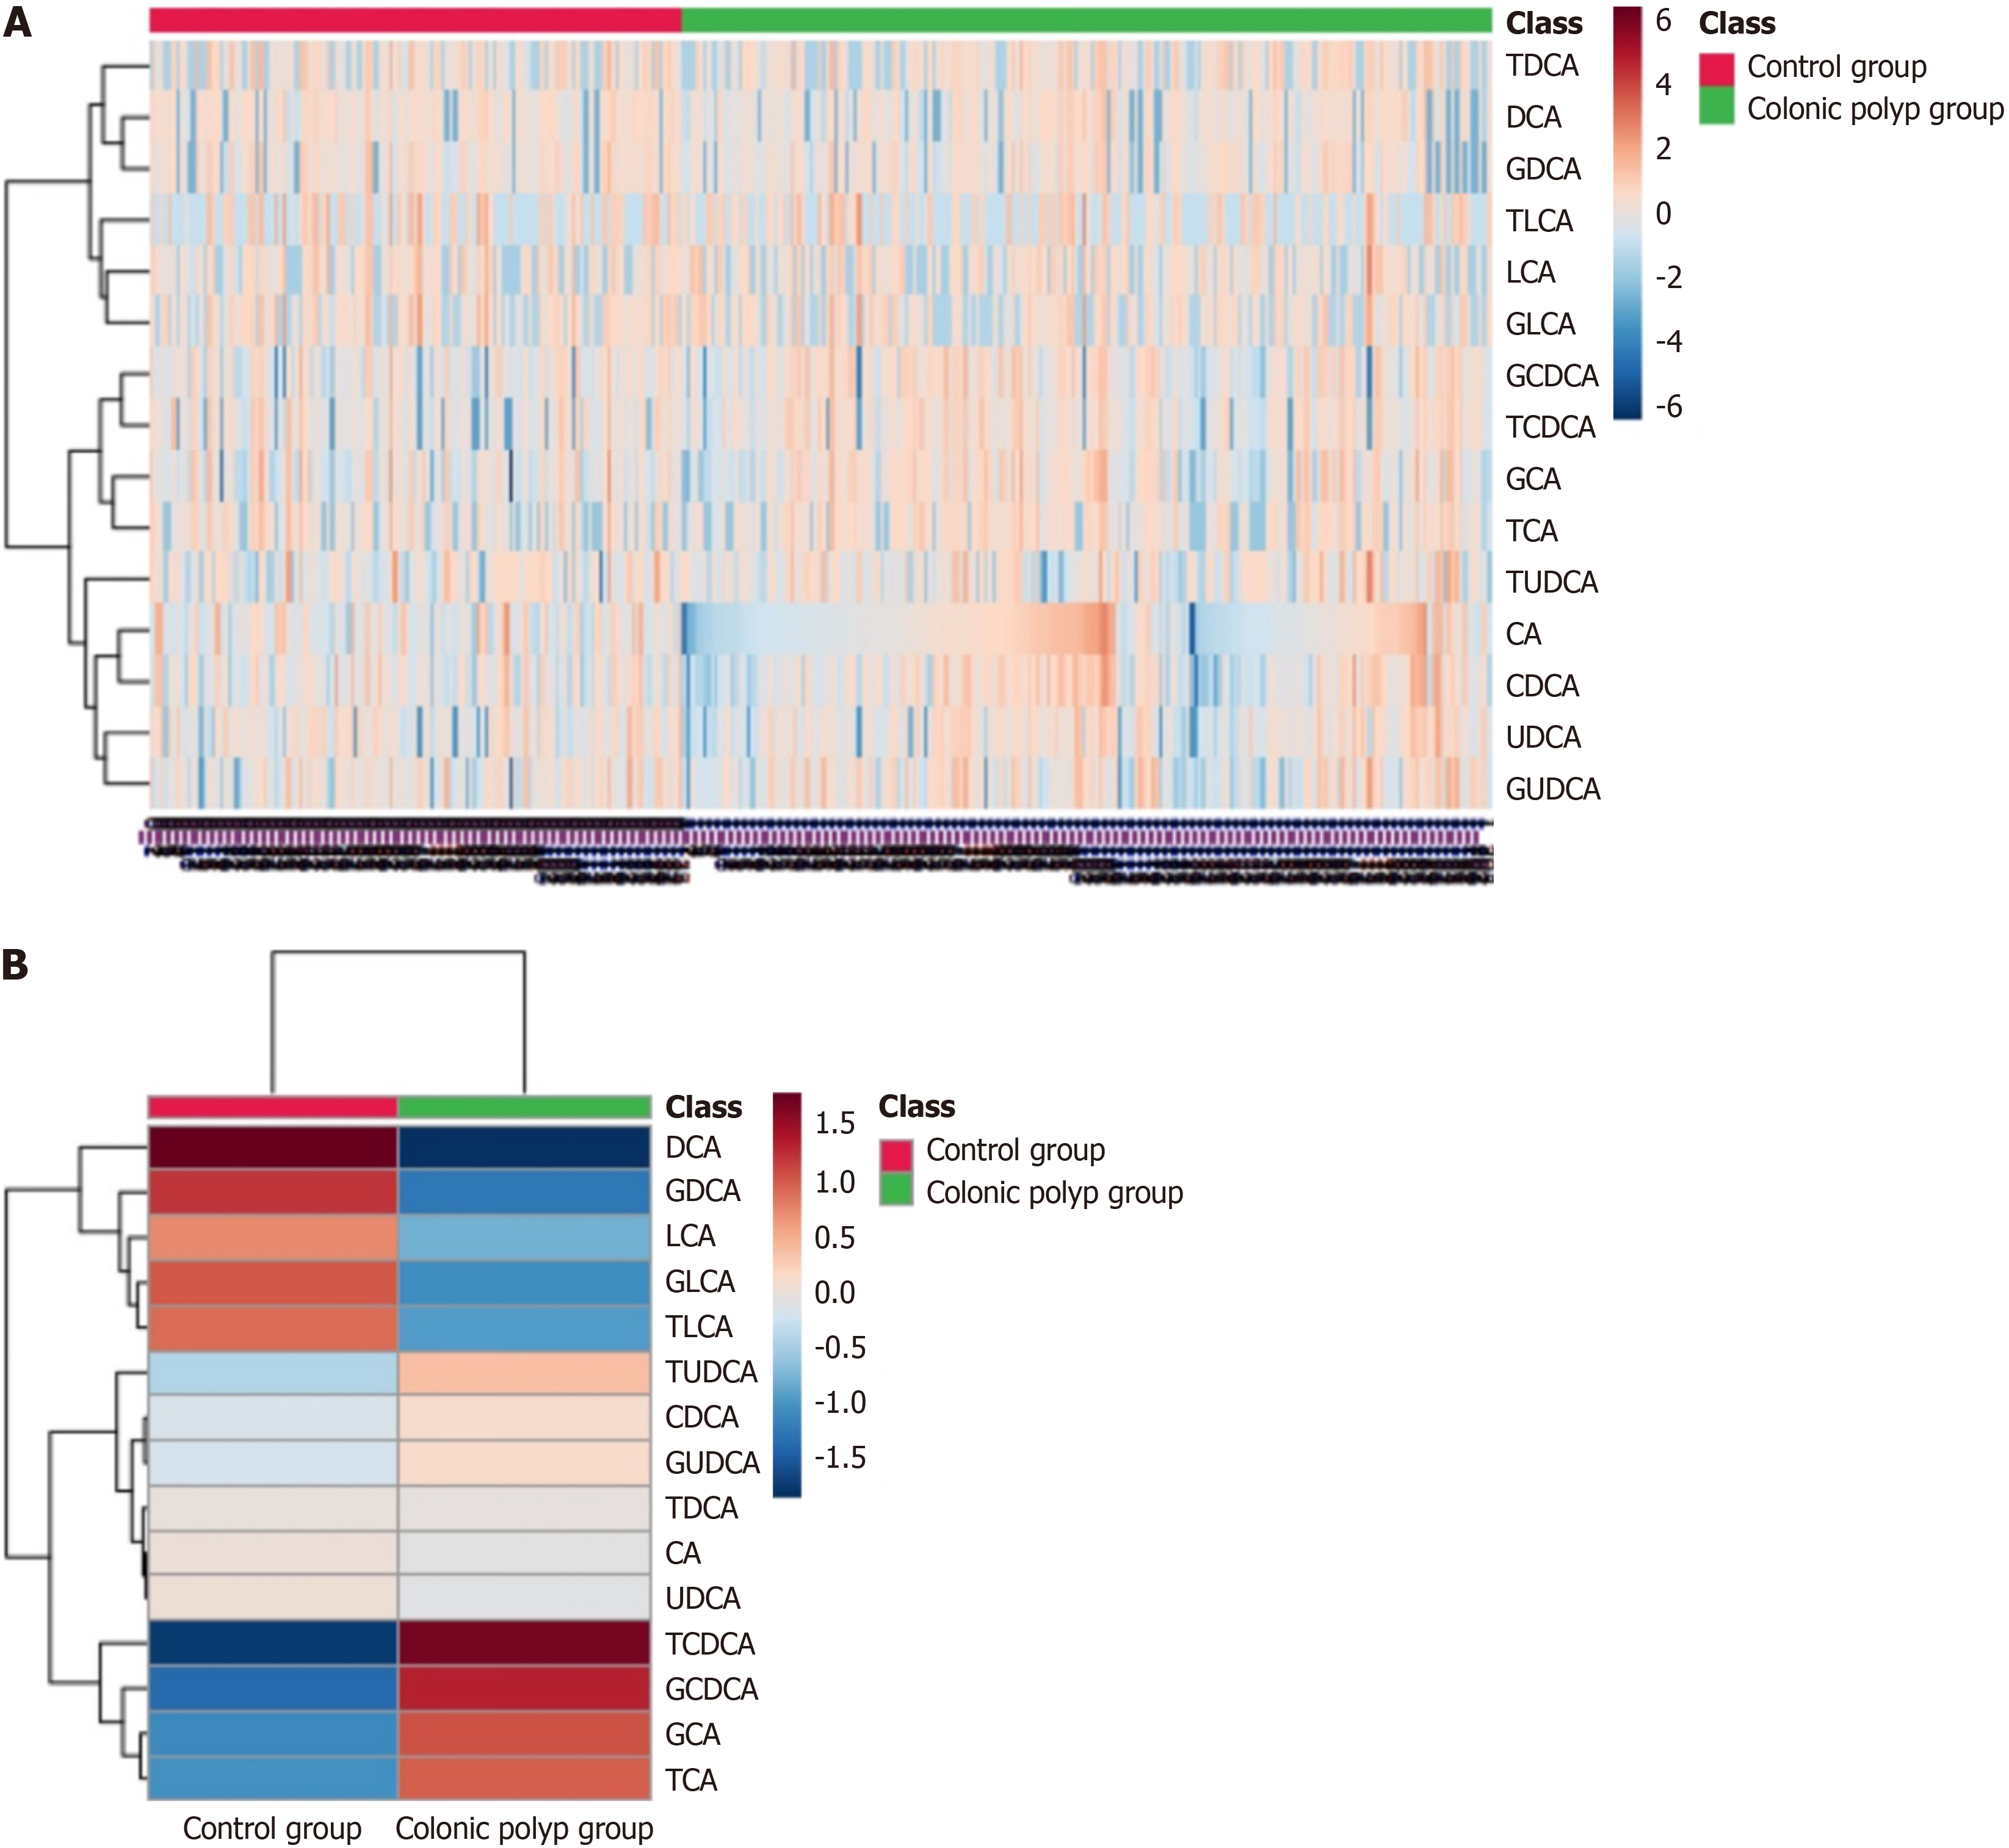
Figure 2 Heat map analysis of the serum bile acid profile of the subjects.
A: The values of each sample; B: The average values of each group. The abscissa represents the sample size, and the ordinate represents the bile acid (BA) profile. The main part represents the expression of BA profile in the sample, and the color in the heat map reflects the changes in the content of BA profile. Figure 2A shows the values of each sample, while Figure 2B shows the average values of each group. CA: Cholic acid; CDCA: Chenodeoxycholic acid; TCA: Taurocholic acid; GCA: Glycocholic acid; TCDCA: Taurochenodeoxycholic acid; GCDCA: Glycochenodeoxycholic acid; DCA: Deoxycholic acid; UDCA: Ursodeoxycholic acid; LCA: Lithocholic acid; TDCA: Tauroursodeoxycholic acid; GDCA: Glycodeoxycholic acid; TUDCA: Tauroursodeoxycholic acid; GUDCA: Glycoursodeoxycholic acid; TLCA: Taurolithocholic acid; GLCA: Glycolithocholic acid.
- Citation: Ji X, Chen H. Detection and analysis of serum bile acid profile in patients with colonic polyps. World J Clin Cases 2024; 12(13): 2160-2172
- URL: https://www.wjgnet.com/2307-8960/full/v12/i13/2160.htm
- DOI: https://dx.doi.org/10.12998/wjcc.v12.i13.2160


