Copyright
©The Author(s) 2023.
World J Clin Cases. Aug 6, 2023; 11(22): 5329-5337
Published online Aug 6, 2023. doi: 10.12998/wjcc.v11.i22.5329
Published online Aug 6, 2023. doi: 10.12998/wjcc.v11.i22.5329
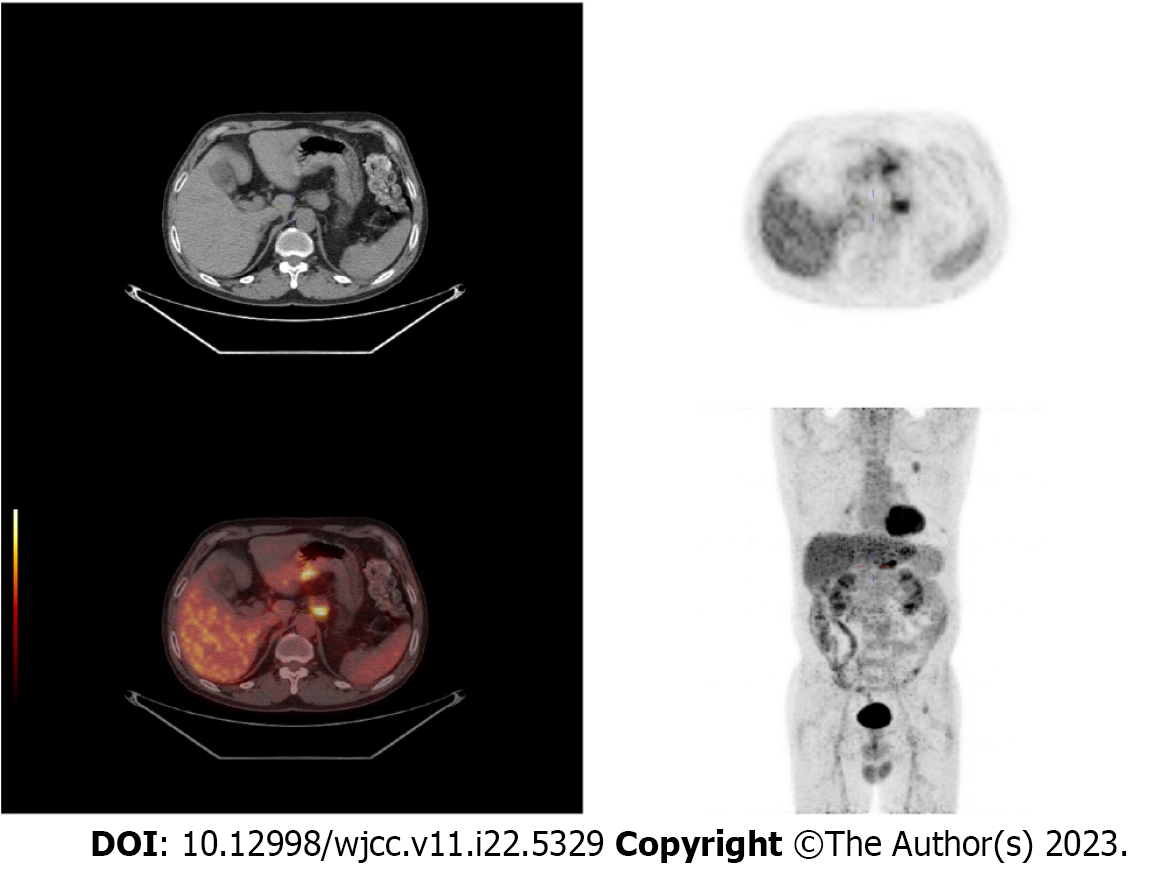
Figure 1 Positron emission tomography/computed tomography images: Thickening of the gastric lesser curvature with metabolic hyperplasia.
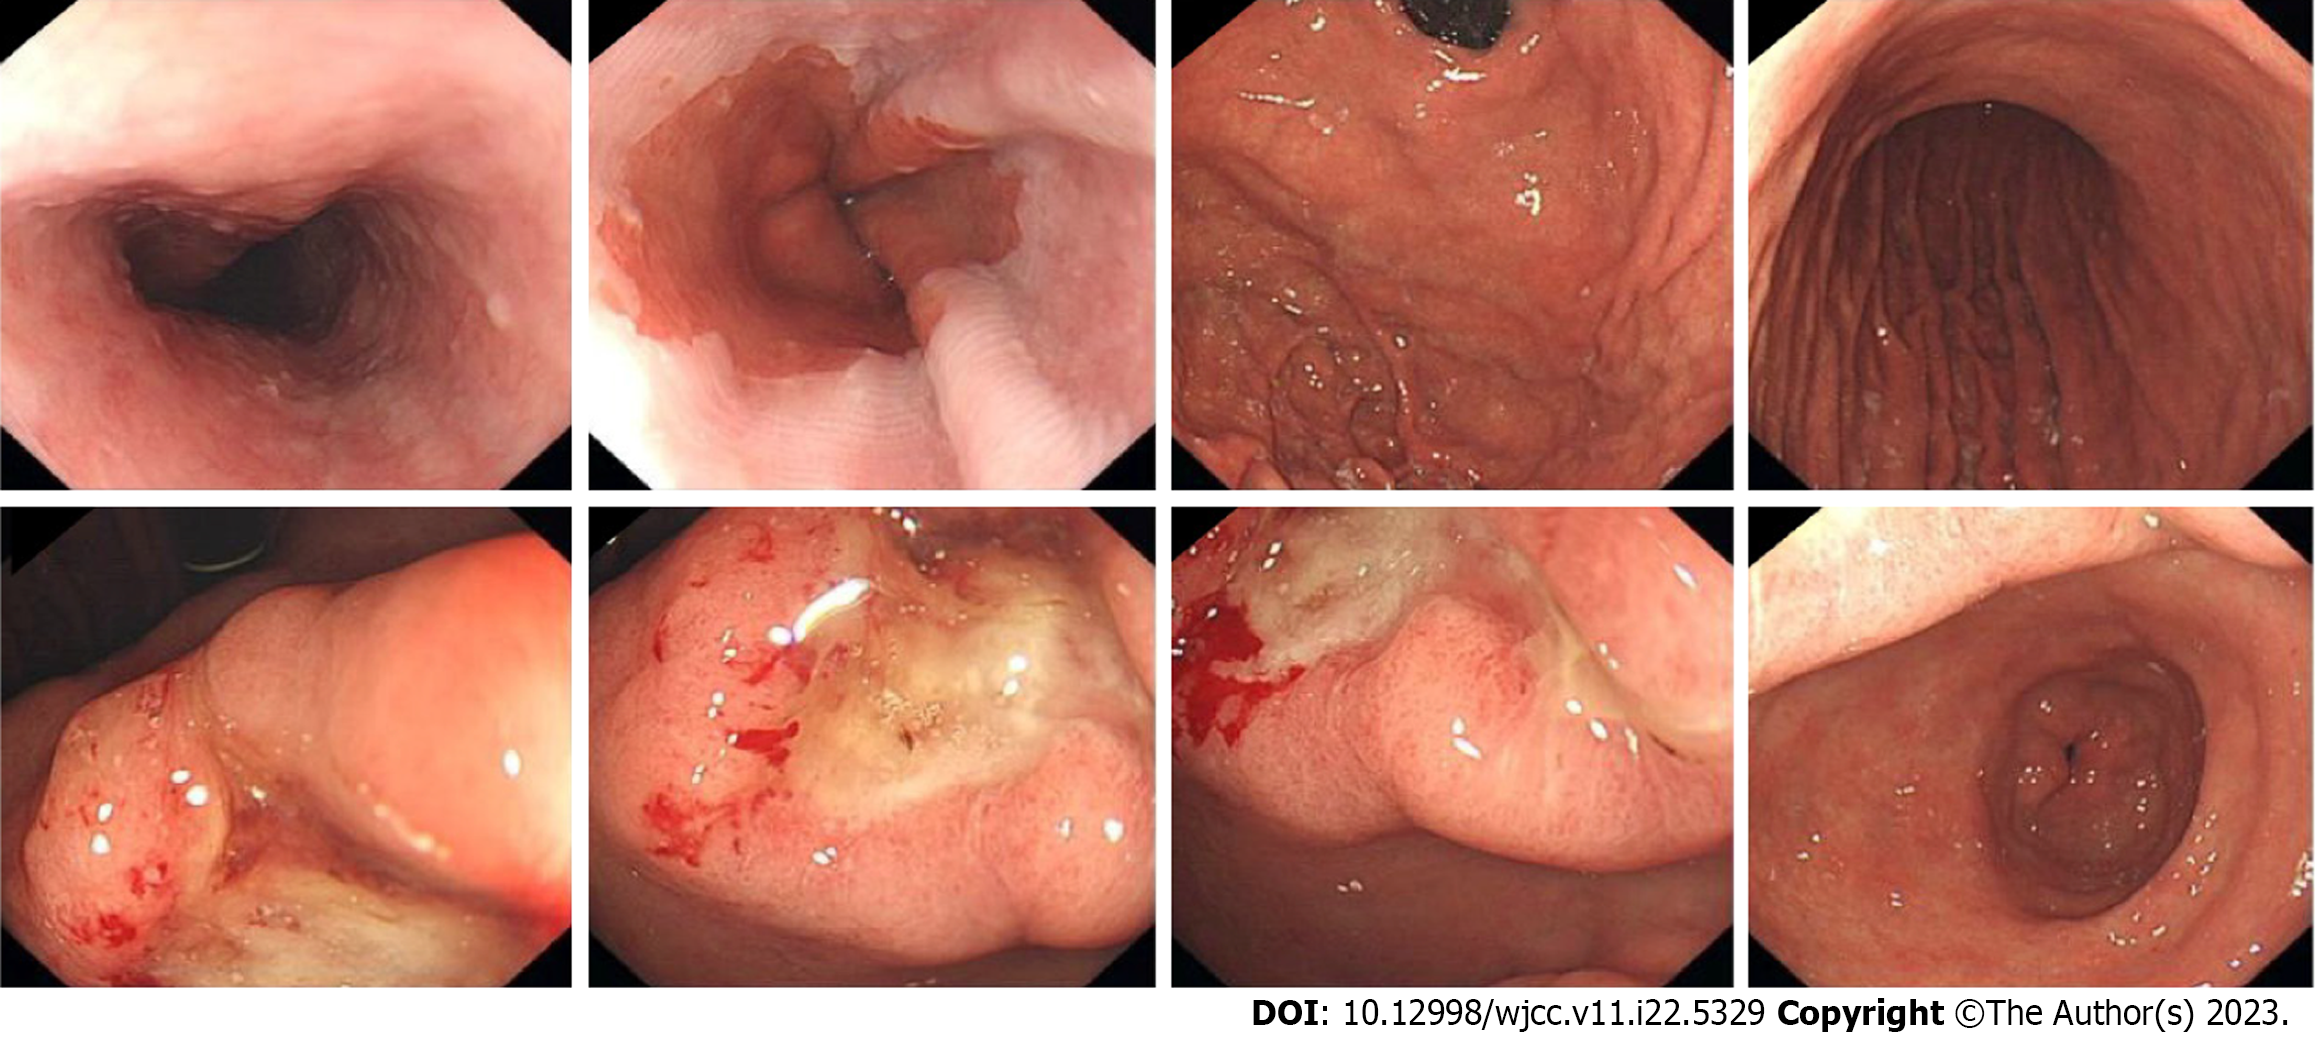
Figure 2 Endoscopic images: Localized ulcerative lesion extending from the angle to the antrum of the stomach.
Figure 3 Histological findings of the primary lesion.
A: A low-power histological view, hepatoid adenocarcinoma of the stomach [hematoxylin-eosin (HE), × 40]; B-D: High-power view shows that the characteristics and arrangement of the cancer cells are similar to those of liver cancer cells, with abundant and eosinophilic cytoplasm. Some of the tumor cells have clear cytoplasm with large and prominent nucleoli located in the center of the cell (B: HE, × 100); (C: HE, × 200); (D: HE, × 400).
Figure 4 Histological findings of metastatic lymph nodes.
A: A low-power histological view and metastatic lymph nodes show hepatoid adenocarcinoma cells [hematoxylin-eosin (HE), × 40]; B-D: A high-power view shows that the tumor cells are similar to those of the primary lesion; (B: HE, × 100); (C: HE, × 200); (D: HE, × 400).
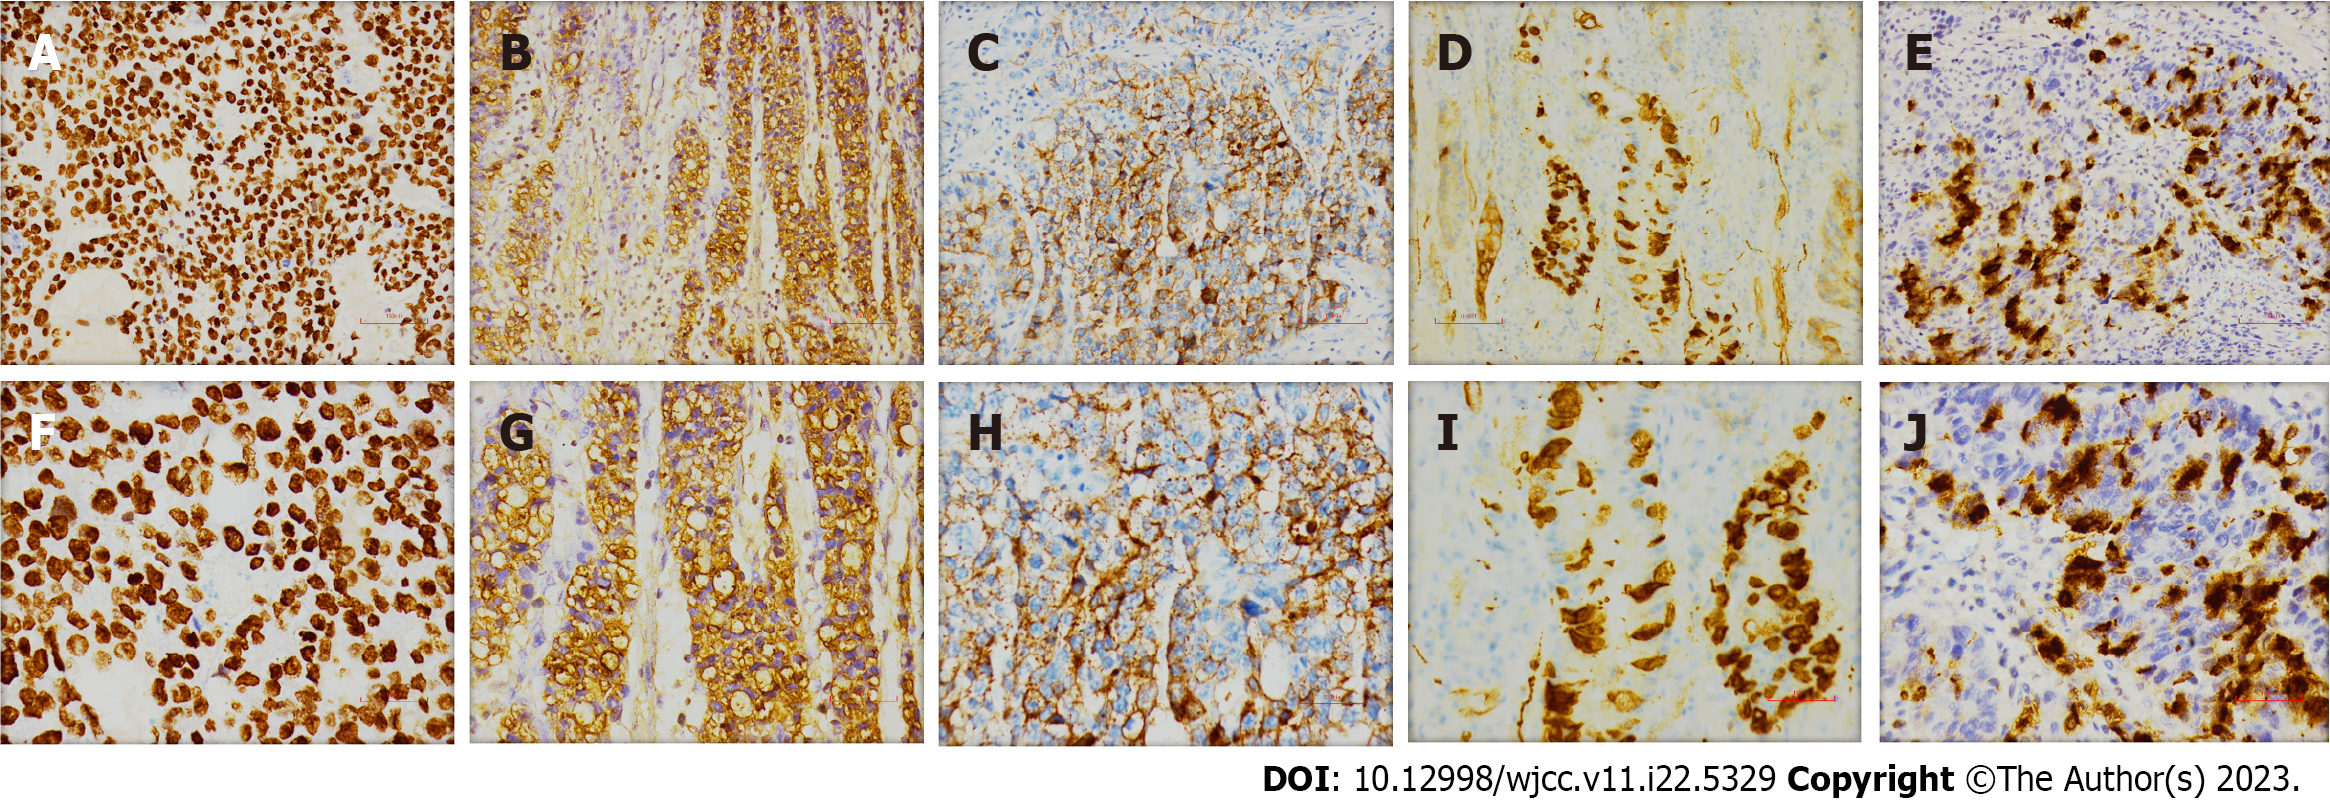
Figure 5 Presentations of immunohistochemical stains.
A: SALL4 (+, × 200); B: Alpha-fetoprotein (AFP) (+, × 200); C: Glypican-3 (GPC-3) (+, × 200); D: Synaptophysin (Syn) (+, × 200); E: Chromogranin A (CgA) (+, × 200); F: SALL4 (+, × 400); G: AFP (+, × 400); H: GPC-3 (+, × 400); I: Syn (+, × 400); J: CgA (+, × 400).
- Citation: Fei H, Li ZF, Chen YT, Zhao DB. Hepatoid adenocarcinoma of the stomach with neuroendocrine differentiation: A case report and review of literature. World J Clin Cases 2023; 11(22): 5329-5337
- URL: https://www.wjgnet.com/2307-8960/full/v11/i22/5329.htm
- DOI: https://dx.doi.org/10.12998/wjcc.v11.i22.5329


