Copyright
©The Author(s) 2023.
World J Clin Cases. Jan 16, 2023; 11(2): 441-448
Published online Jan 16, 2023. doi: 10.12998/wjcc.v11.i2.441
Published online Jan 16, 2023. doi: 10.12998/wjcc.v11.i2.441
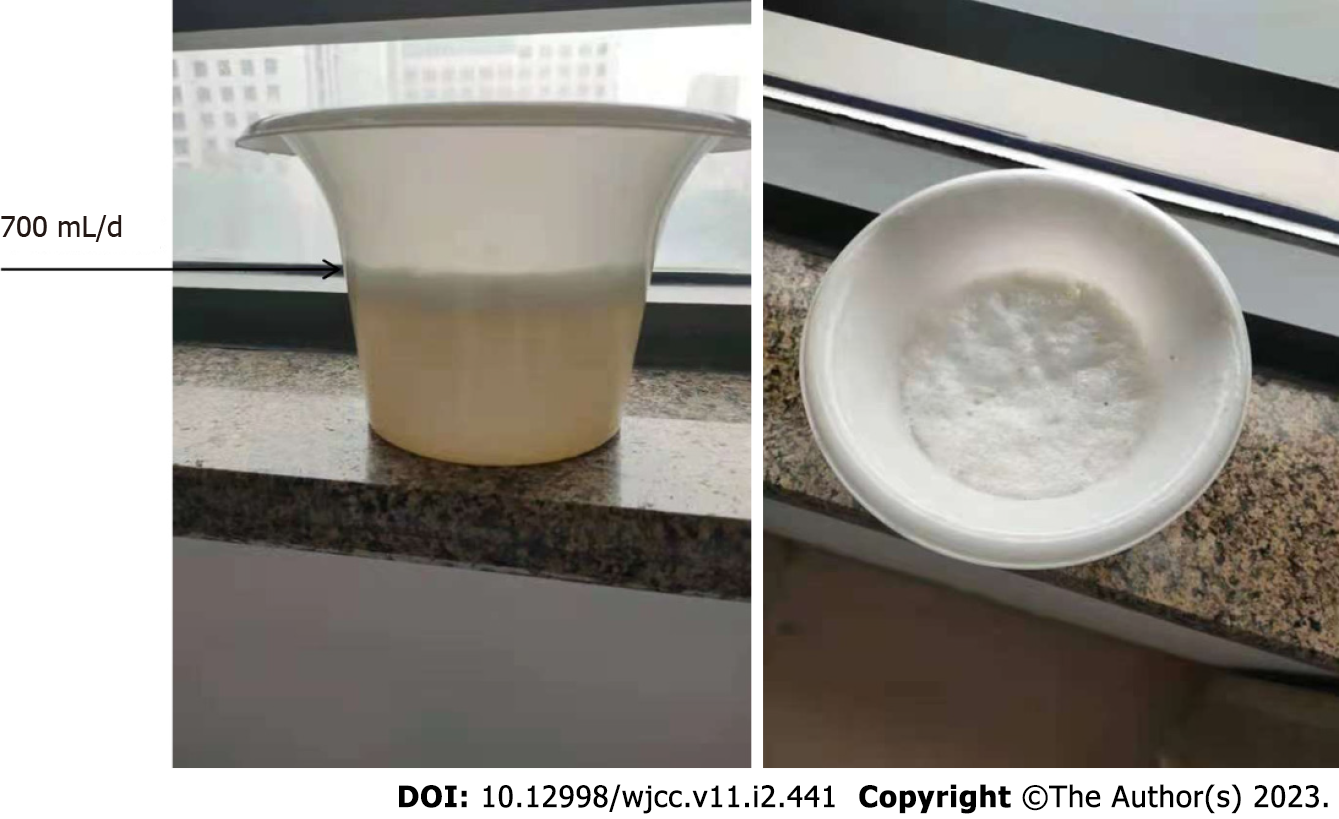
Figure 1
Image shows 700 mL/d watery sputum produced by the patient.
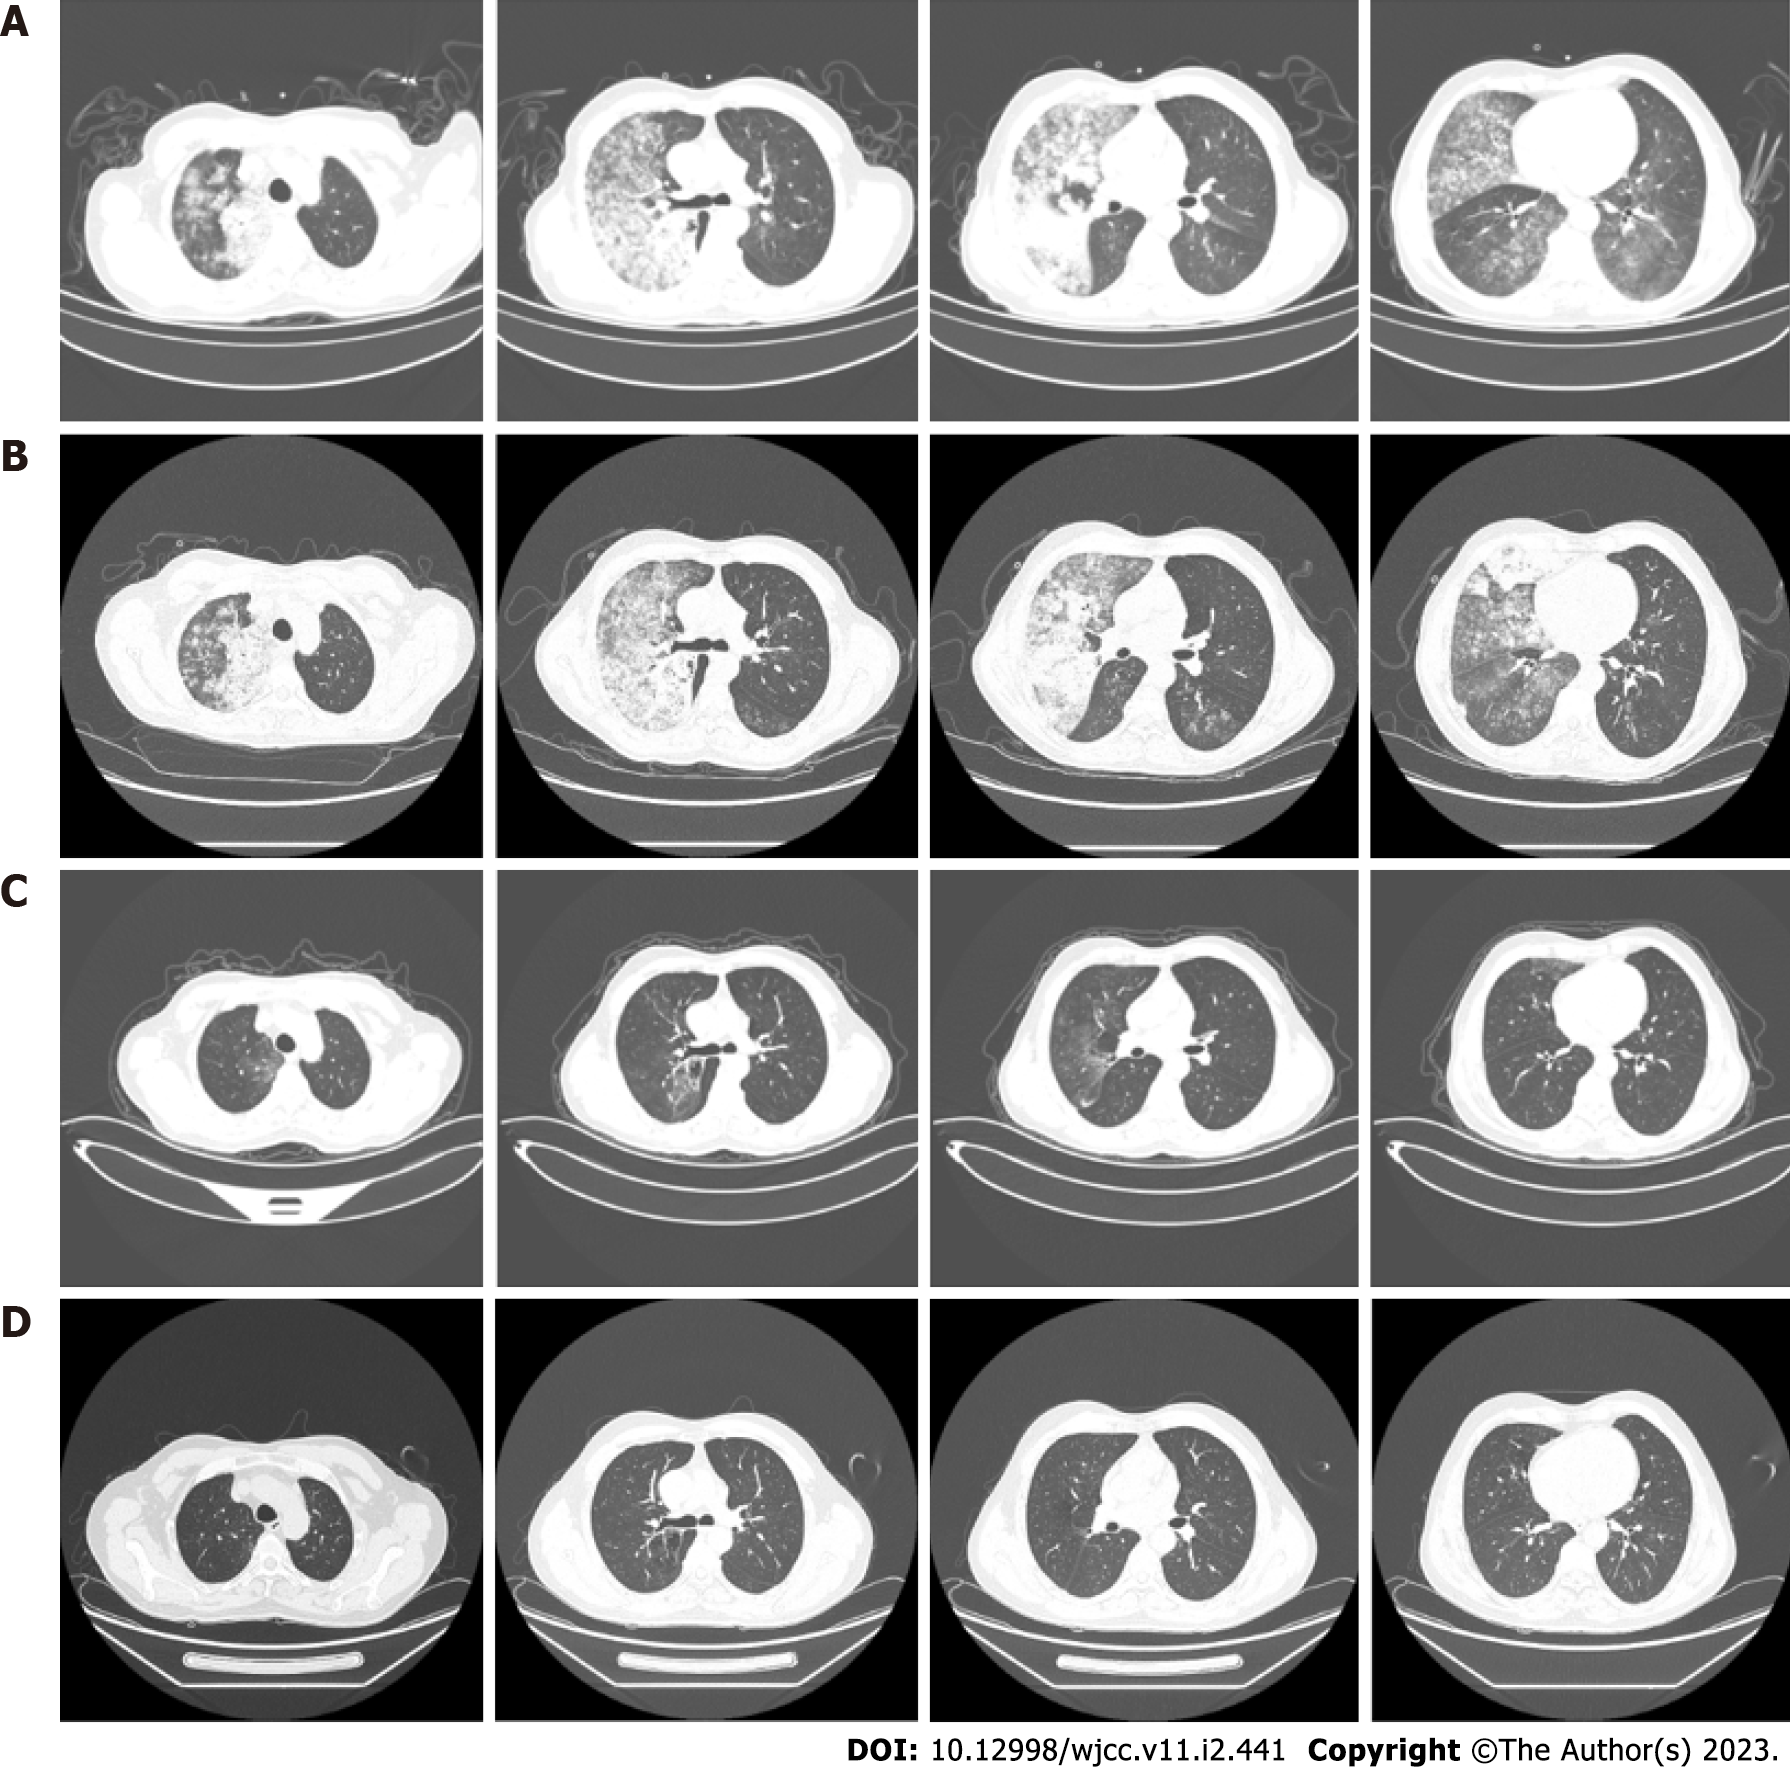
Figure 2 Chest computed tomography findings.
A: At the beginning of treatment; B: Anti-infection treatment lasted for 1 wk; C: Gefitinib was treated for 1 mo; D: Gefitinib was treated for 11 mo. Chest high-resolution computed tomography scan shows large flaky hyperintense shadows in both lungs, especially in the right lung. A-D show the chest computed tomography images at the first diagnosis, after anti-infection treatment for 1 wk, after treatment with gefitinib for 1 mo, and after treatment with gefitinib for 11 mo, respectively.
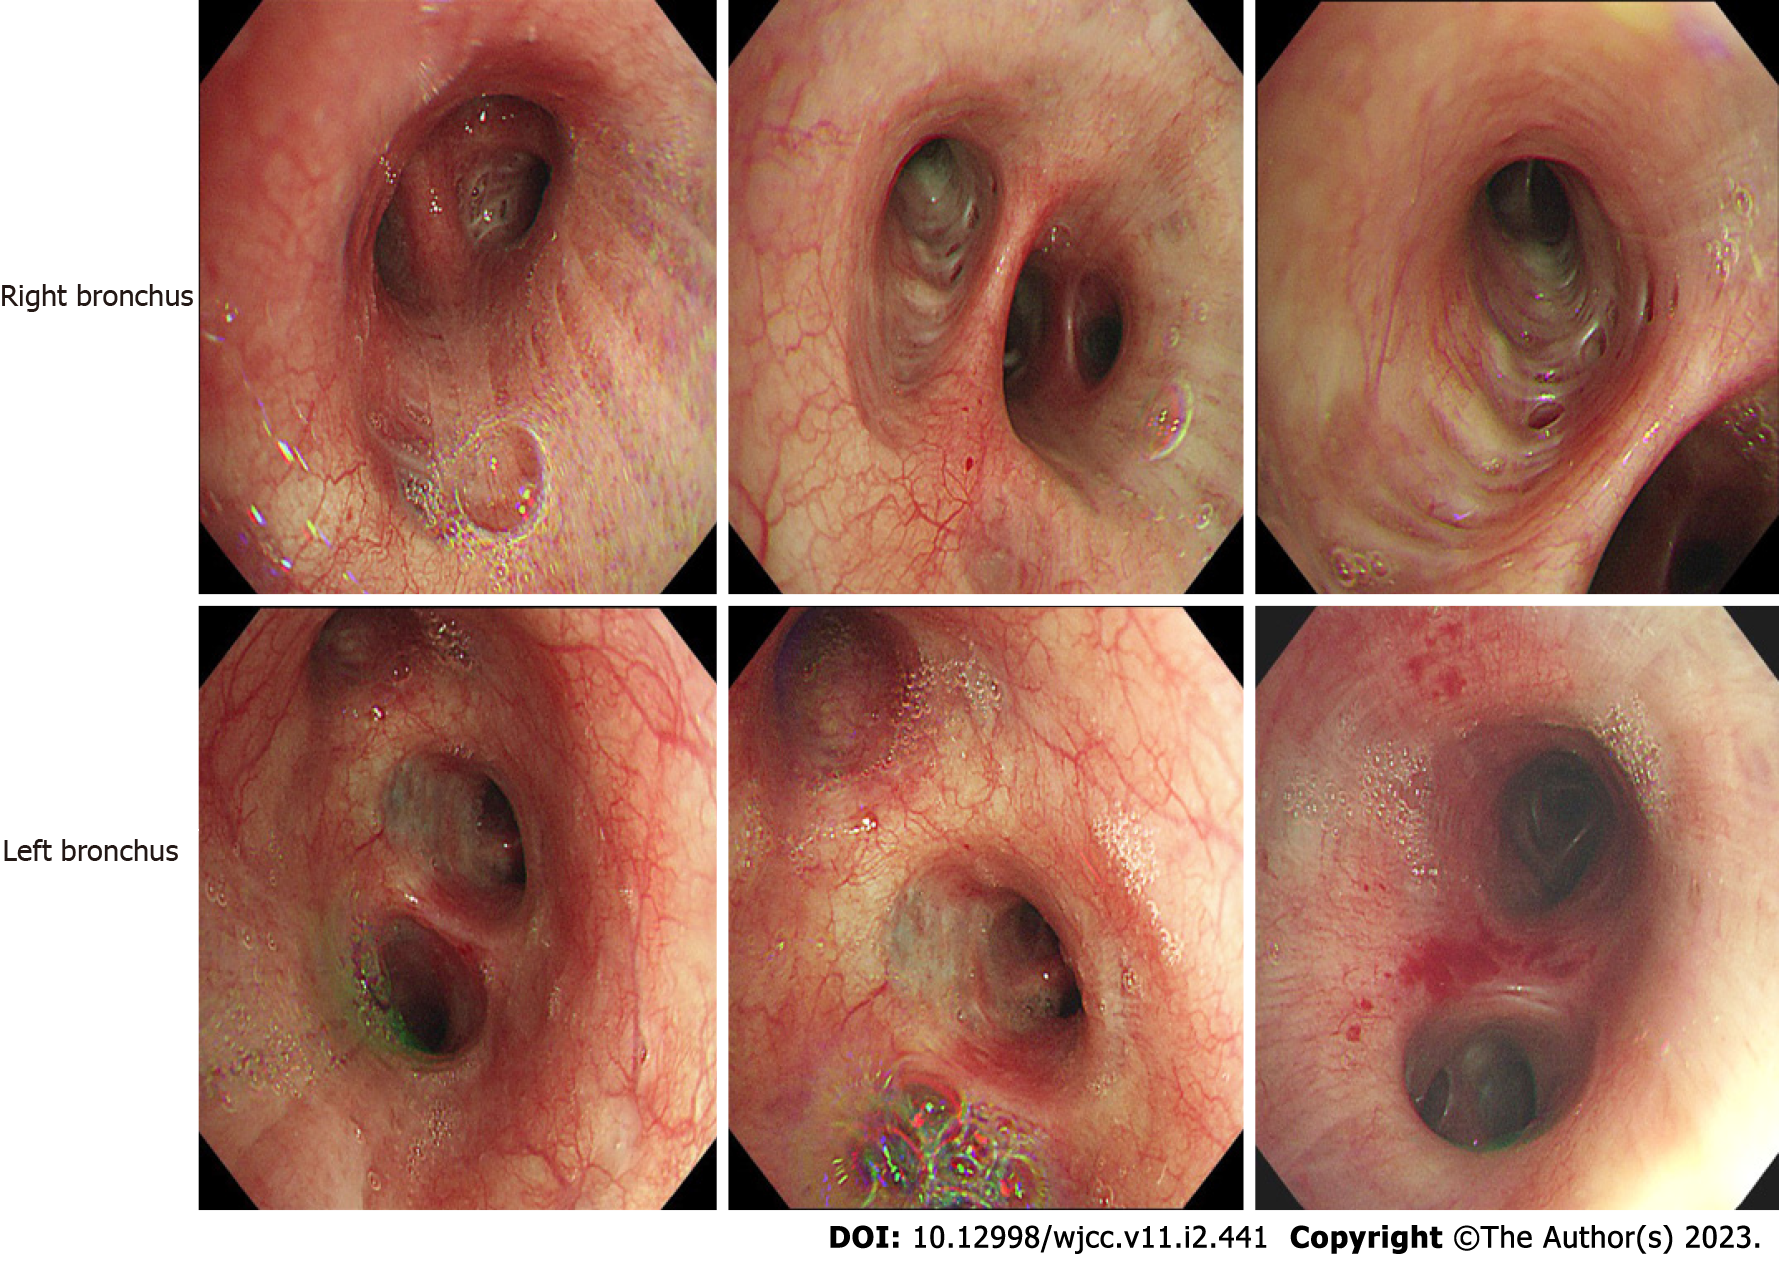
Figure 3 Bronchoscopy findings of the case.
There are a lot of white secretions in the trachea.
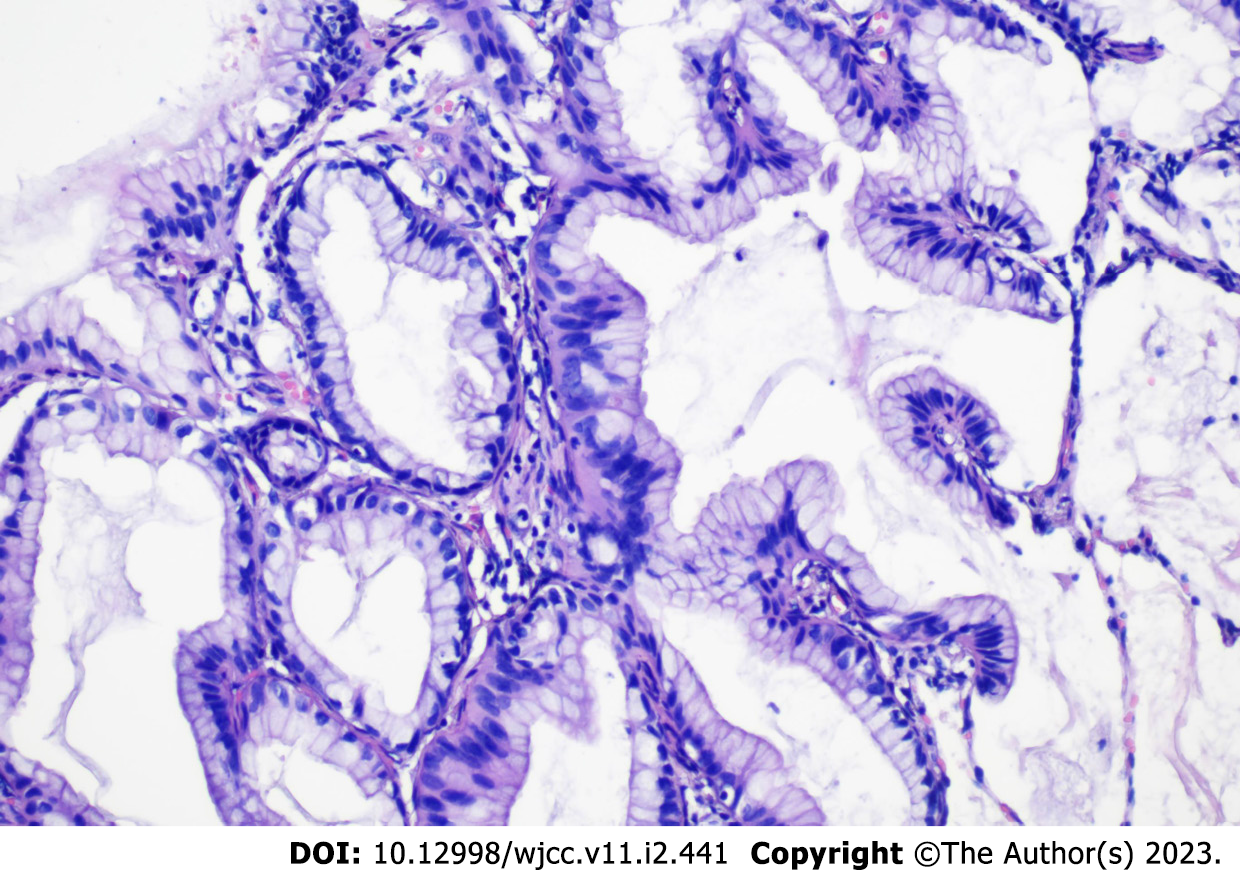
Figure 4
Histopathological section of computed tomography -guided percutaneous lung biopsy specimen showing lung invasive mucinous adenocarcinoma (H&E stain, 200×).
- Citation: Ou GC, Luo W, Zhang WS, Wang SH, Zhao J, Zhao HM, Qiu R. Gefitinib improves severe bronchorrhea and prolongs the survival of a patient with lung invasive mucinous adenocarcinoma: A case report. World J Clin Cases 2023; 11(2): 441-448
- URL: https://www.wjgnet.com/2307-8960/full/v11/i2/441.htm
- DOI: https://dx.doi.org/10.12998/wjcc.v11.i2.441


