Copyright
©The Author(s) 2022.
World J Clin Cases. Dec 16, 2022; 10(35): 13099-13107
Published online Dec 16, 2022. doi: 10.12998/wjcc.v10.i35.13099
Published online Dec 16, 2022. doi: 10.12998/wjcc.v10.i35.13099
Figure 1 Trends of blood inflammatory indicators including percentage of neutrophils, erythrocyte sedimentation rate, and C-reactive protein after admission.
The red line represents the date of surgery. CRP: C-reactive protein; ESR: Erythrocyte sedimentation rate; NEUT: Neutrophil.
Figure 2 Preoperative computed tomography, magnetic resonance imaging and contrast-enhanced magnetic resonance imaging examination.
A-D: Preoperative computed tomography examination; the arrow indicates the pathologically fractured vertebrae in the cross-section (A); the arrow indicates the pathologically fractured vertebrae in the sagittal plane (B); the arrow indicates the pathologically fractured vertebrae in the coronal plane (C); computed tomography 3D reconstruction (D); E-H: Preoperative magnetic resonance imaging (MRI) examination; the arrow indicates the pathologically fractured vertebrae in the T1 cross-section sequence (E); the arrow indicates the pathologically fractured vertebrae in the T1 sagittal sequence (F); the arrow indicates the pathologically fractured vertebrae in the T2 sagittal sequence (G); the arrow indicates the pathologically fractured vertebrae in the T2 fat-suppressed sequence (H); I-L: Preoperative contrast-enhanced MRI examination; the arrow indicates the pathologically fractured vertebrae in the contrast-enhanced MRI T1 cross-section sequence (I); the arrow indicates the pathologically fractured vertebrae in the contrast-enhanced MRI T1 sagittal sequence (J); the arrow indicates the pathologically fractured vertebrae in the contrast-enhanced MRI T2 sagittal sequence (K); the arrow indicates the pathologically fractured vertebrae in the contrast-enhanced MRI T2 fat-suppressed sequence (L).
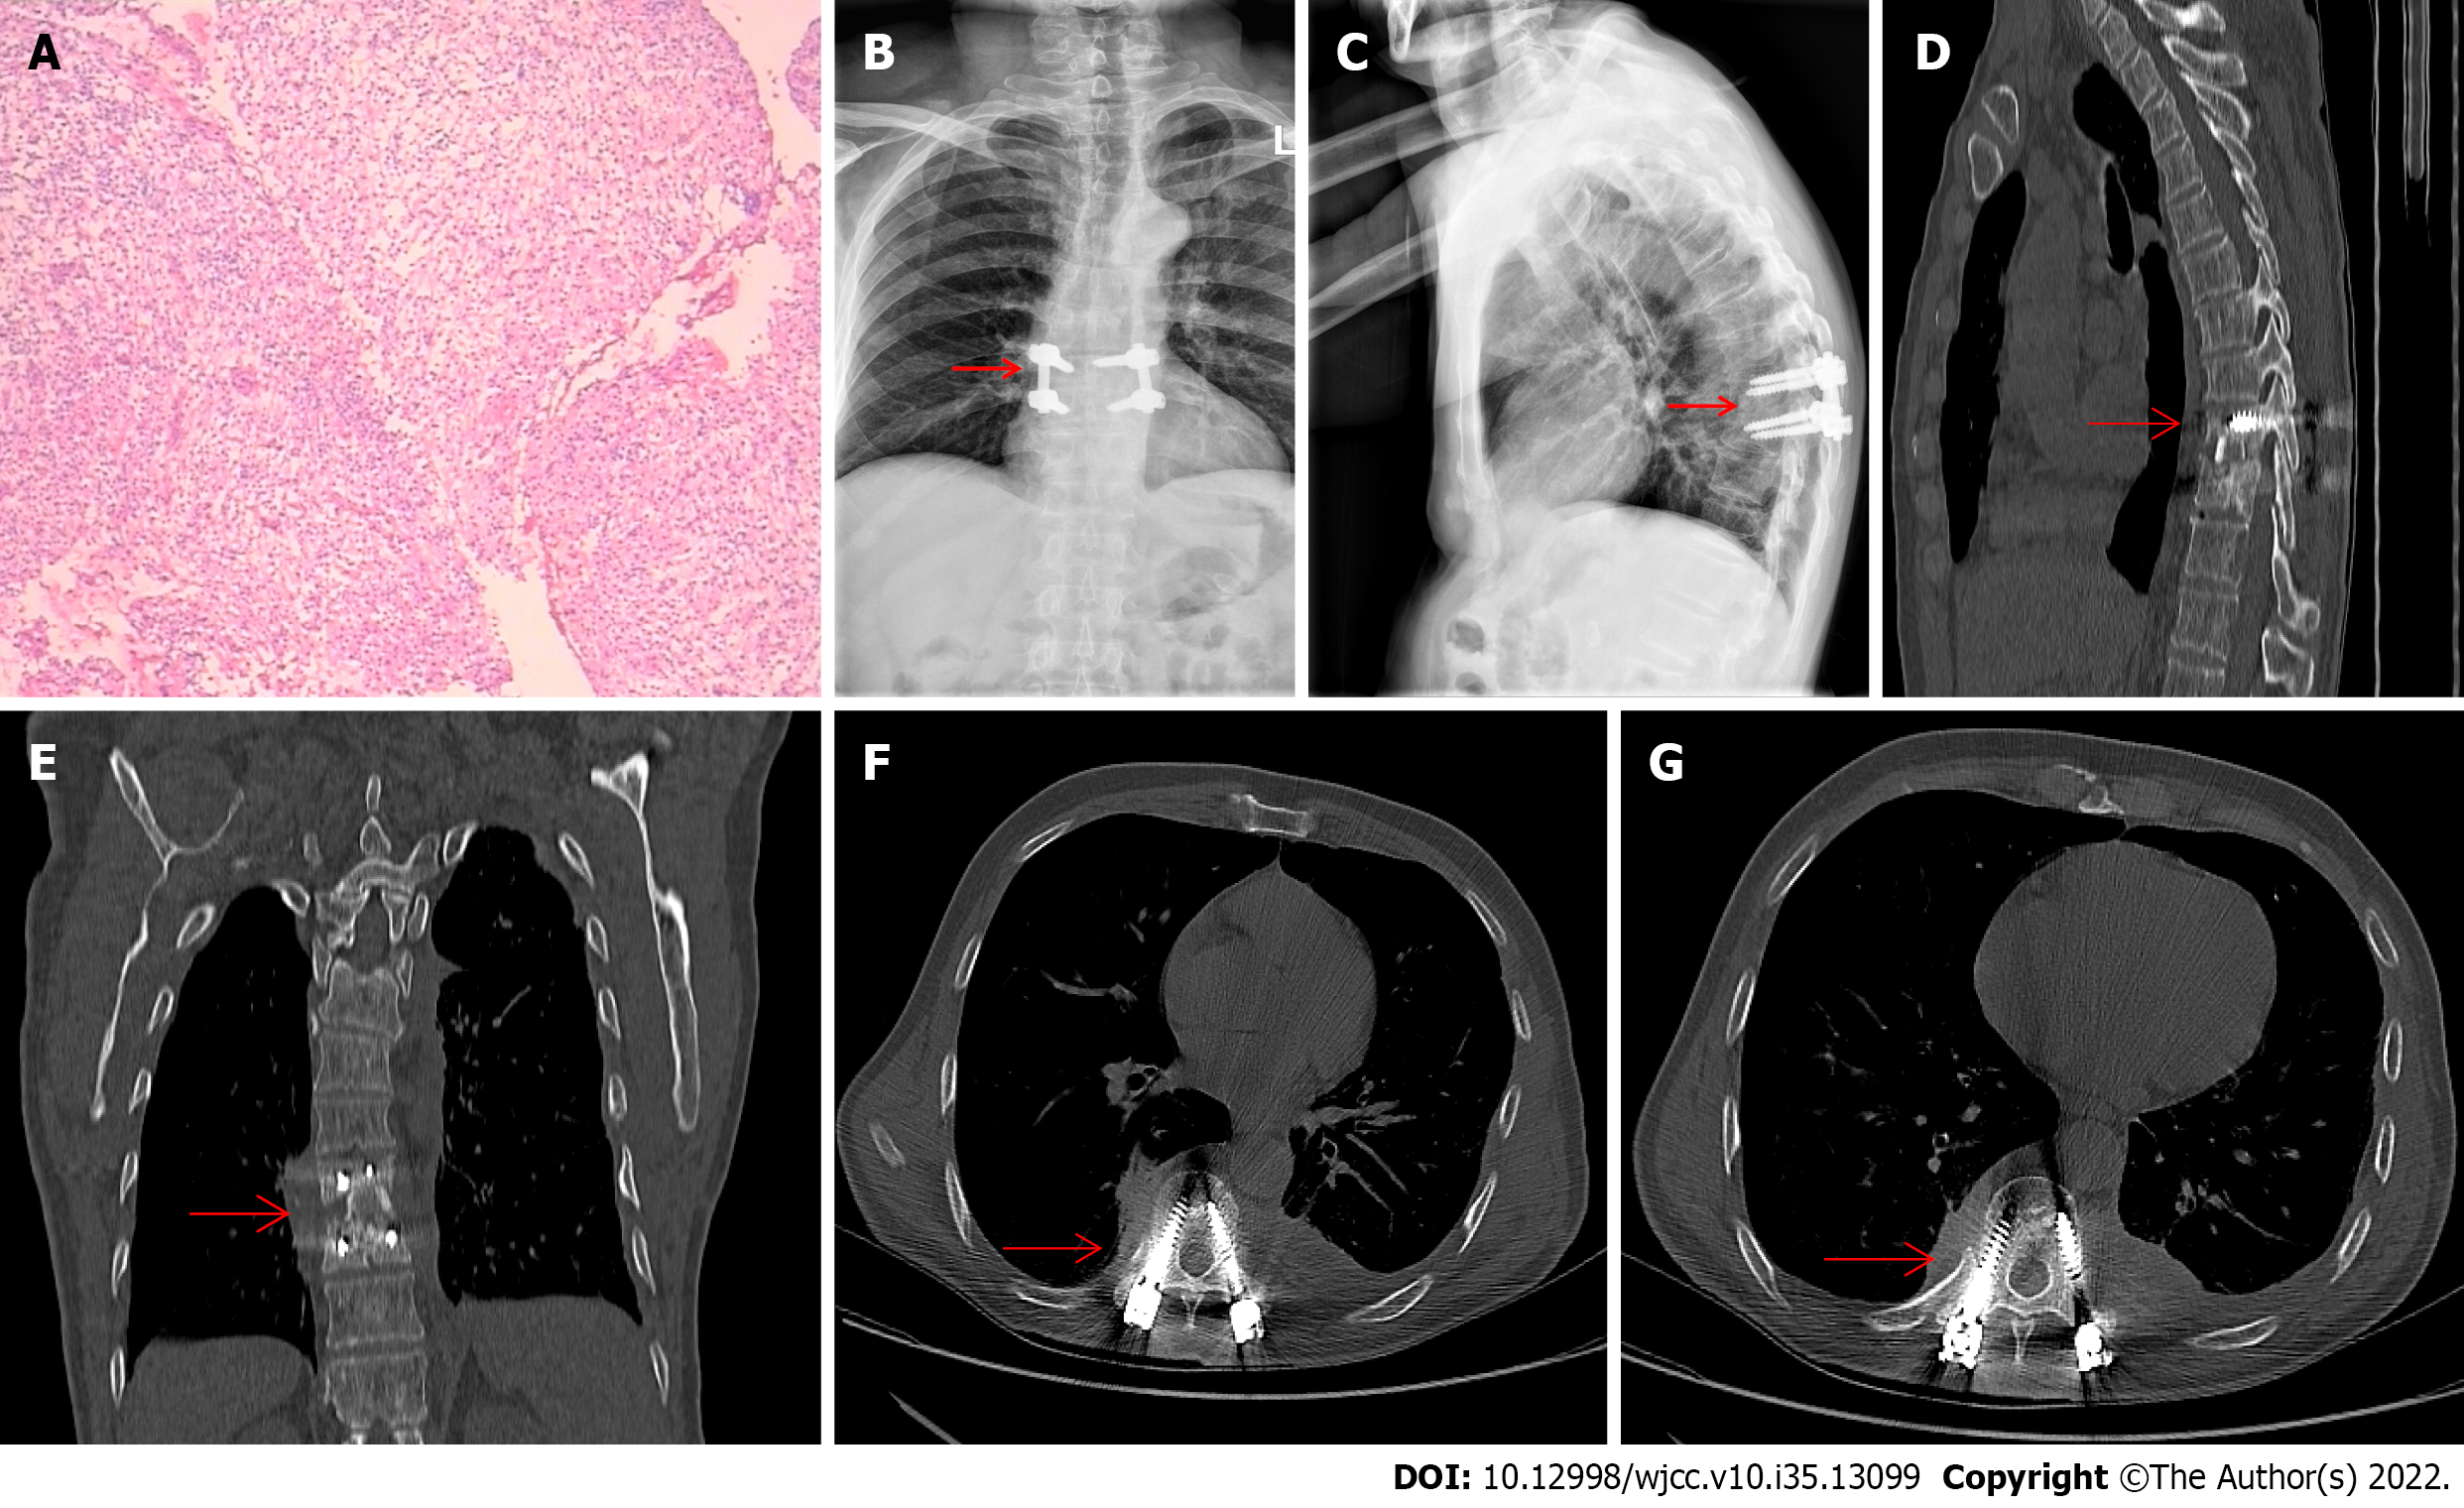
Figure 3 Postoperative X-rays, computed tomography, and pathological examination.
A: Intraoperative collection of pathological findings from diseased vertebrae; B and C: Postoperative X-ray examination; the arrow indicates the morphology of postoperative vertebrae in the coronal plane (B); the arrow indicates the morphology of postoperative vertebrae in the sagittal plane (C); D-G: Postoperative computed tomography examination; the arrow indicates the morphology of postoperative vertebrae in the sagittal plane (D); the arrow indicates the morphology of postoperative vertebrae in the coronal plane (E); and the arrow indicates the morphology of postoperative vertebrae in the cross-section (F and G).
- Citation: Mo YF, Mu ZS, Zhou K, Pan D, Zhan HT, Tang YH. Surgery combined with antibiotics for thoracic vertebral Escherichia coli infection after acupuncture: A case report. World J Clin Cases 2022; 10(35): 13099-13107
- URL: https://www.wjgnet.com/2307-8960/full/v10/i35/13099.htm
- DOI: https://dx.doi.org/10.12998/wjcc.v10.i35.13099


