Copyright
©The Author(s) 2022.
World J Clin Cases. Oct 26, 2022; 10(30): 11074-11081
Published online Oct 26, 2022. doi: 10.12998/wjcc.v10.i30.11074
Published online Oct 26, 2022. doi: 10.12998/wjcc.v10.i30.11074
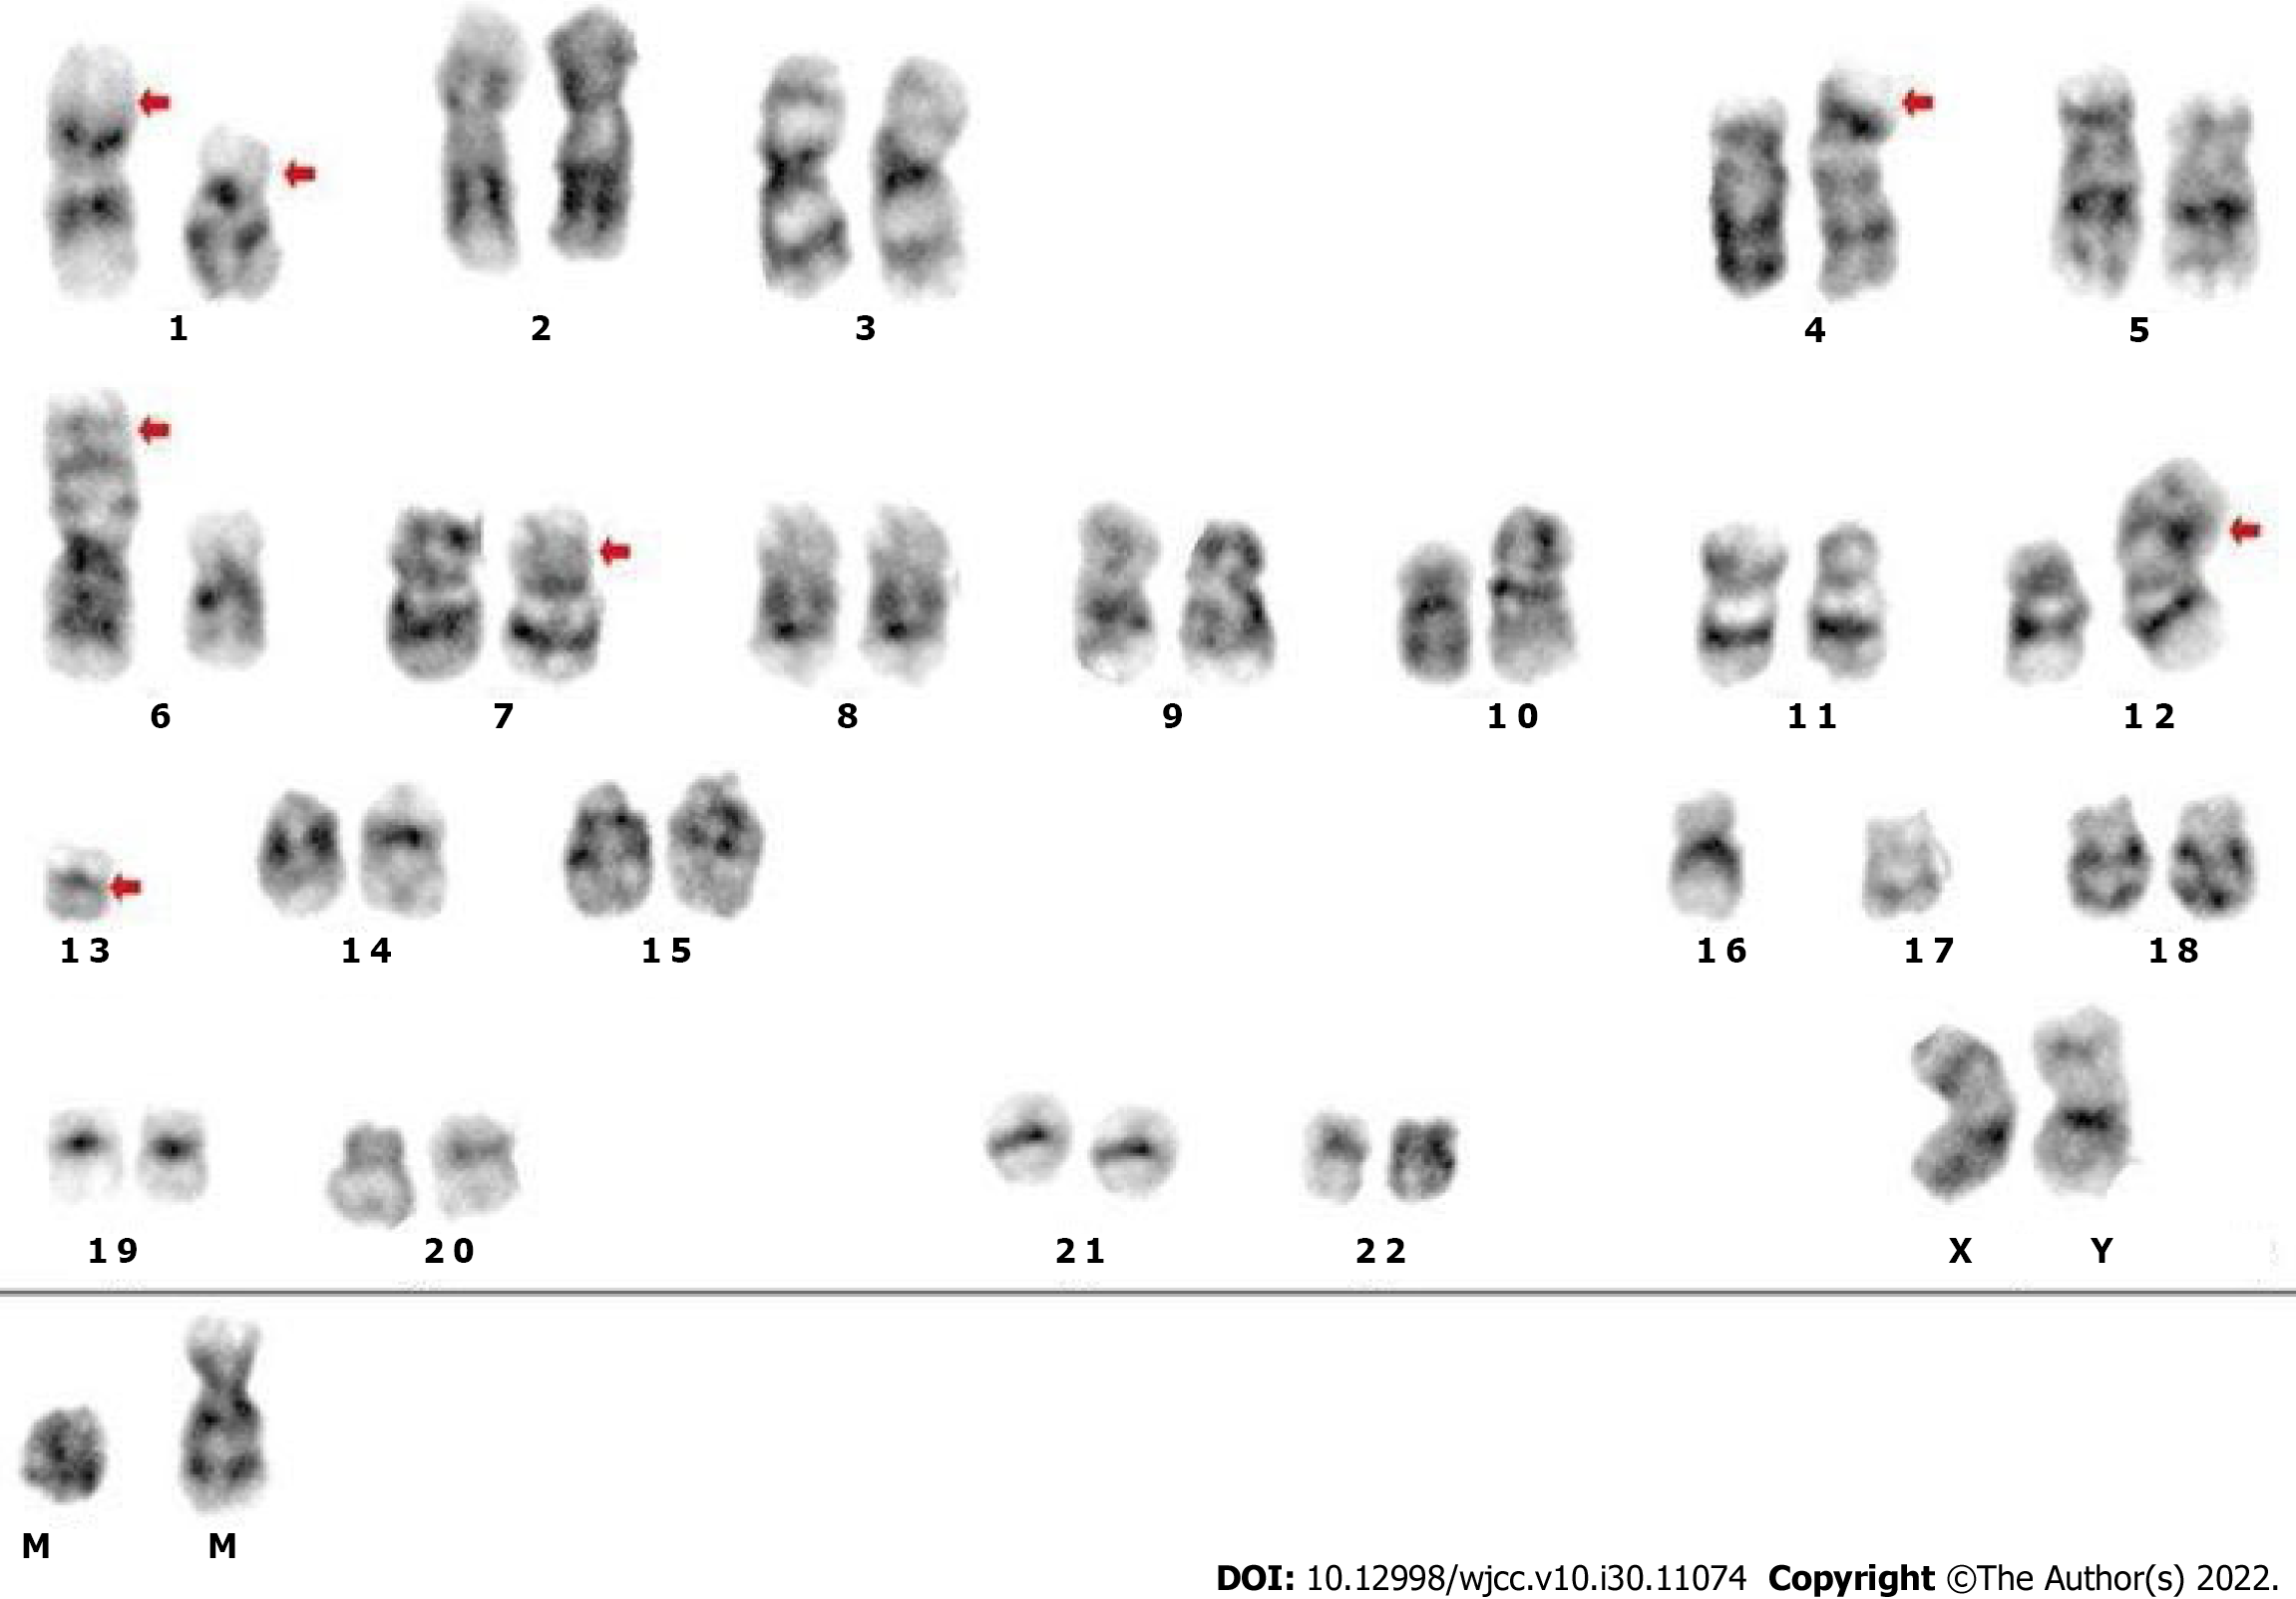
Figure 1 Chromosomal karyotype analysis of bone marrow.
Cytogenetic analysis using both the G-banding and R-banding technique demonstrated a karyotype of 45, XX, del (1) (p13p36.1), i (1) (p10), dup (4) (p15p16), add (6) (p23), der (6) del (6) (p21) del (6) (q23q25), der (7) t (7;11) (p10; q10), add (11) (p11.2), der (12) t (4;12) (q21; p11.2), -13, del (13) (q14), -16, -17, + mar1, + mar2 in 19 of 20 metaphases examined.
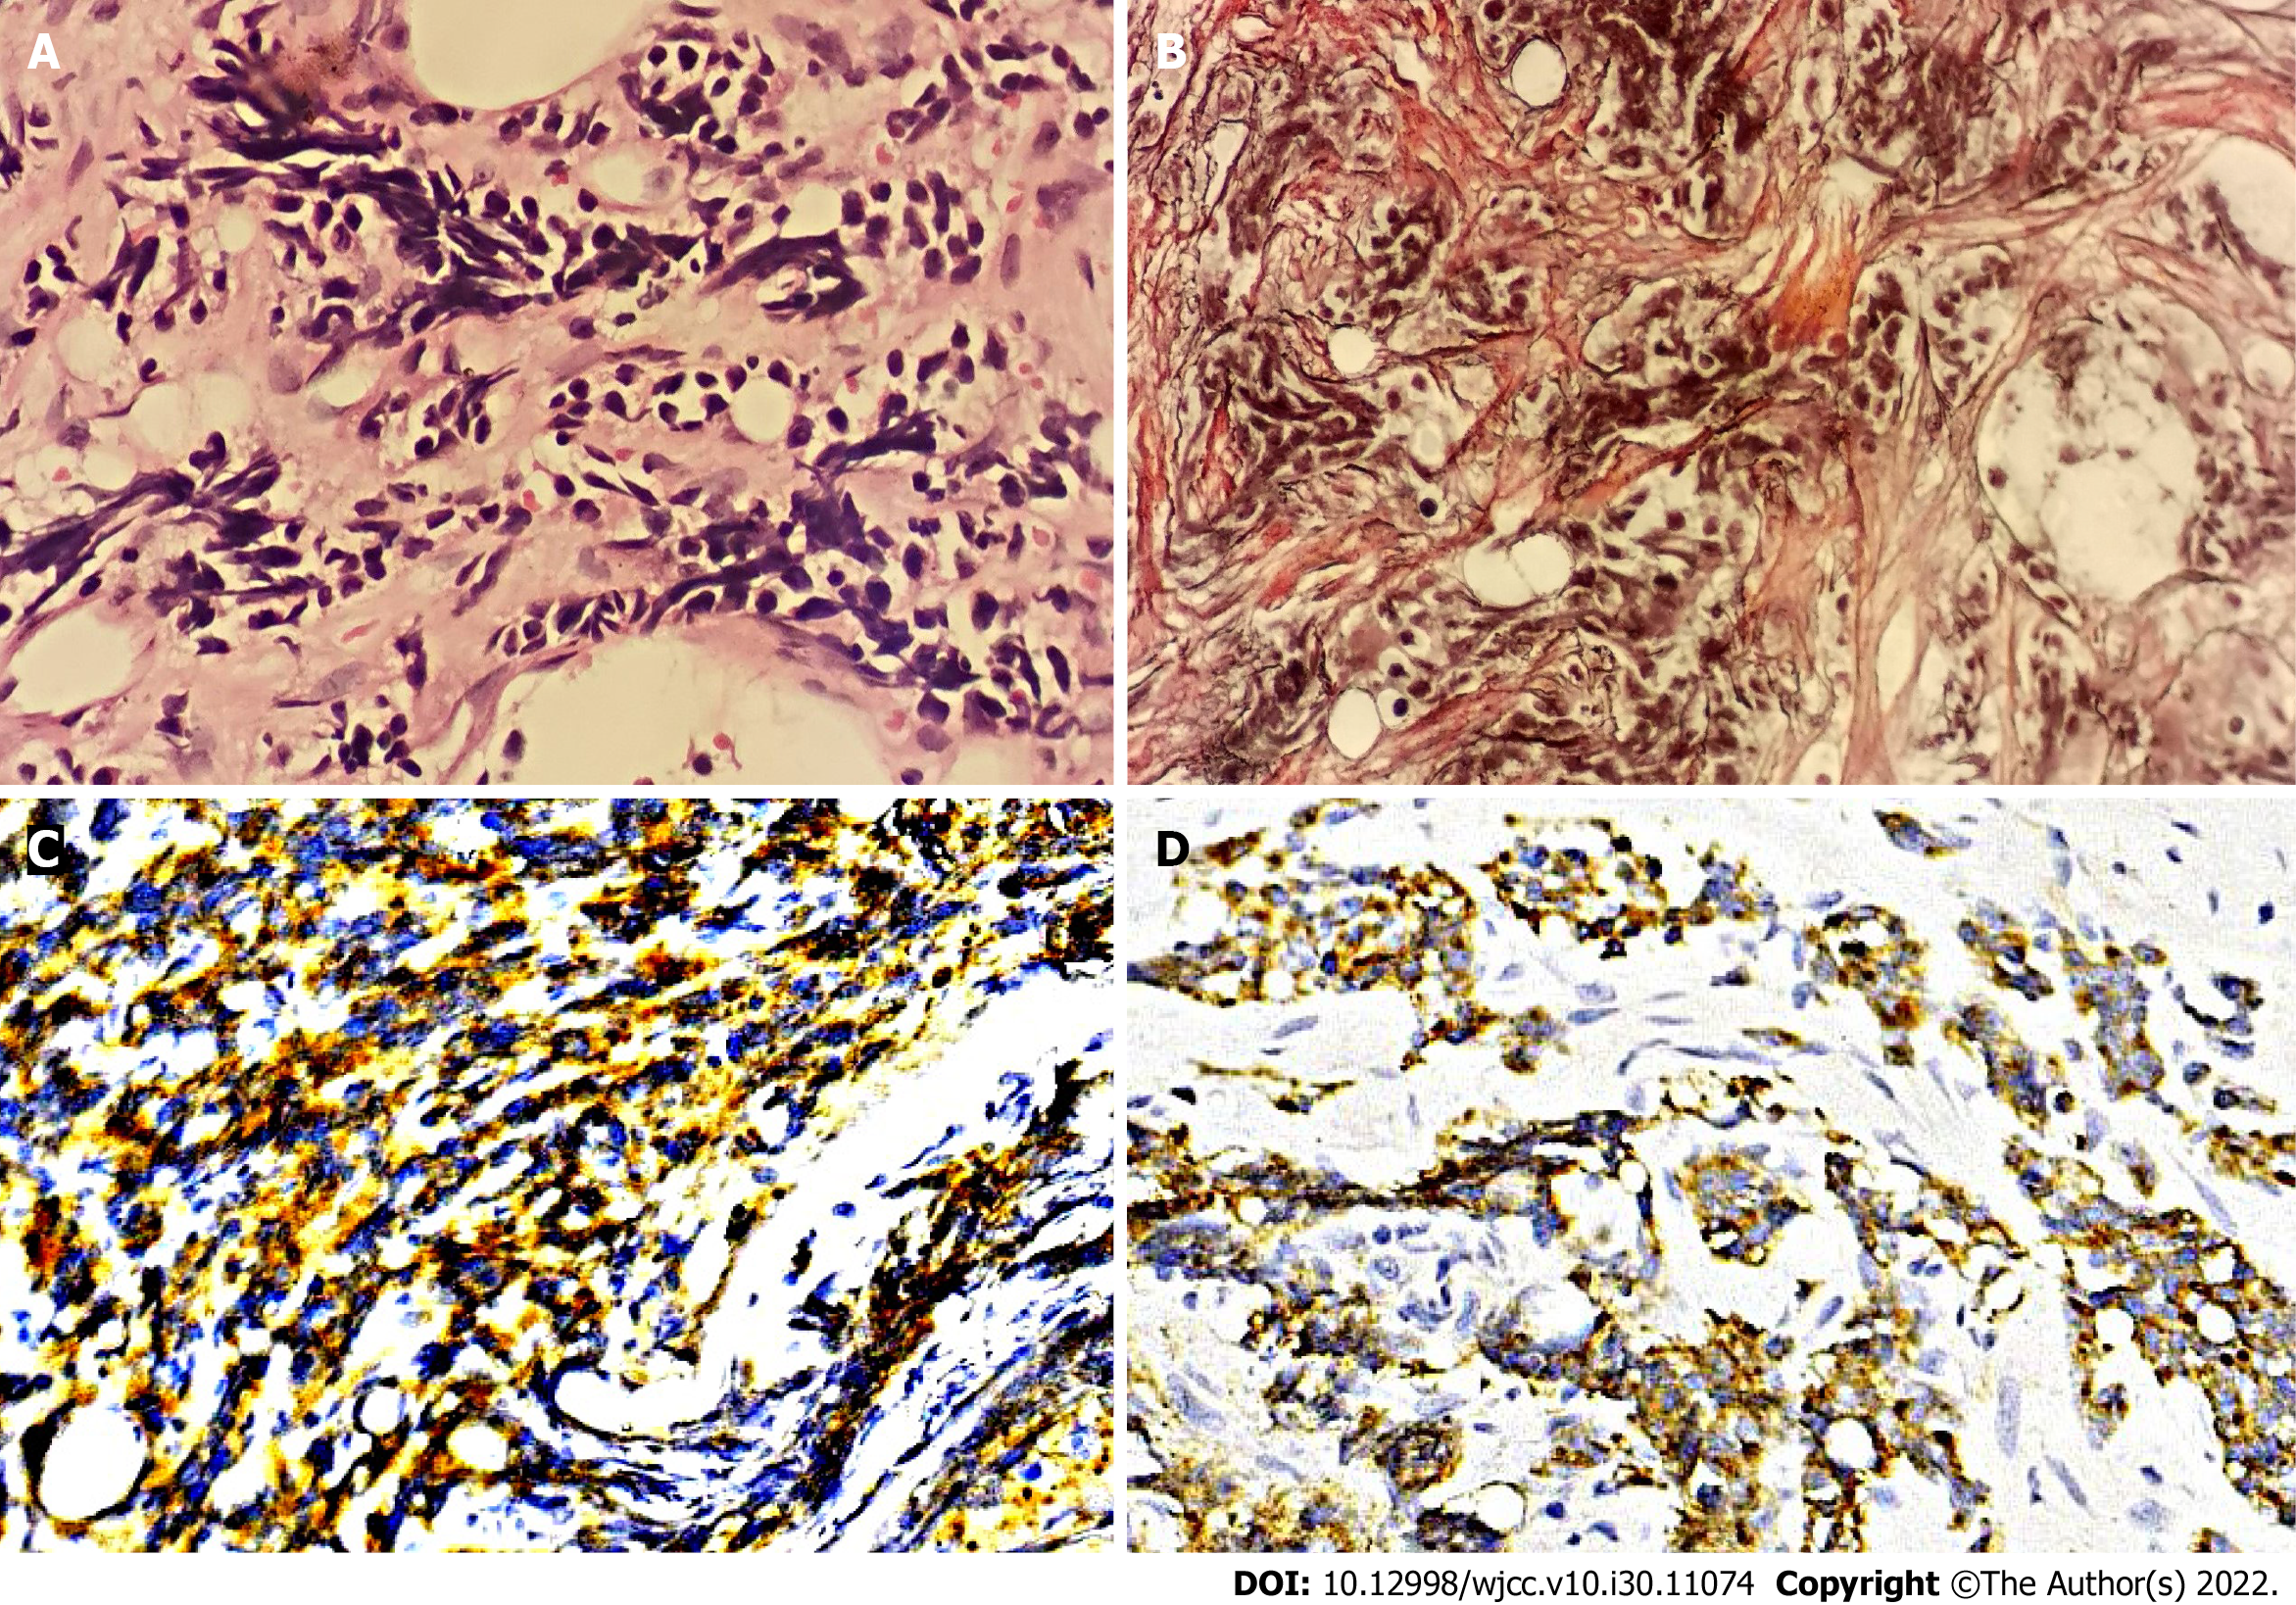
Figure 2 Bone marrow biopsy.
A: Hematoxylin and eosin staining showed nest-like distributions of small cells with less cytoplasm, round or irregular nuclei and dark stained chromatin in the stroma (× 400); B: Reticulin staining was positive (+++) (× 400); C and D: Immunohistochemical staining exhibited that the tumor cells were positive for CD56 (C) (× 400) and synaptophysin (D) (× 400).
Figure 3 18F-Fluorodeoxyglucose positron emission tomography tumor metabolic imaging.
18F-Fluorodeoxyglucose (18F-FDG) positron emission tomography demonstrated intense and diffuse 18F-FDG uptake in the bone marrow of bilateral iliac bones and no abnormal uptake in other sites of the whole body.
- Citation: Shi XB, Deng WX, Jin FX. Bone marrow metastatic neuroendocrine carcinoma with unknown primary site: A case report and review of the literature. World J Clin Cases 2022; 10(30): 11074-11081
- URL: https://www.wjgnet.com/2307-8960/full/v10/i30/11074.htm
- DOI: https://dx.doi.org/10.12998/wjcc.v10.i30.11074


