Copyright
©The Author(s) 2022.
World J Clin Cases. Oct 16, 2022; 10(29): 10575-10582
Published online Oct 16, 2022. doi: 10.12998/wjcc.v10.i29.10575
Published online Oct 16, 2022. doi: 10.12998/wjcc.v10.i29.10575
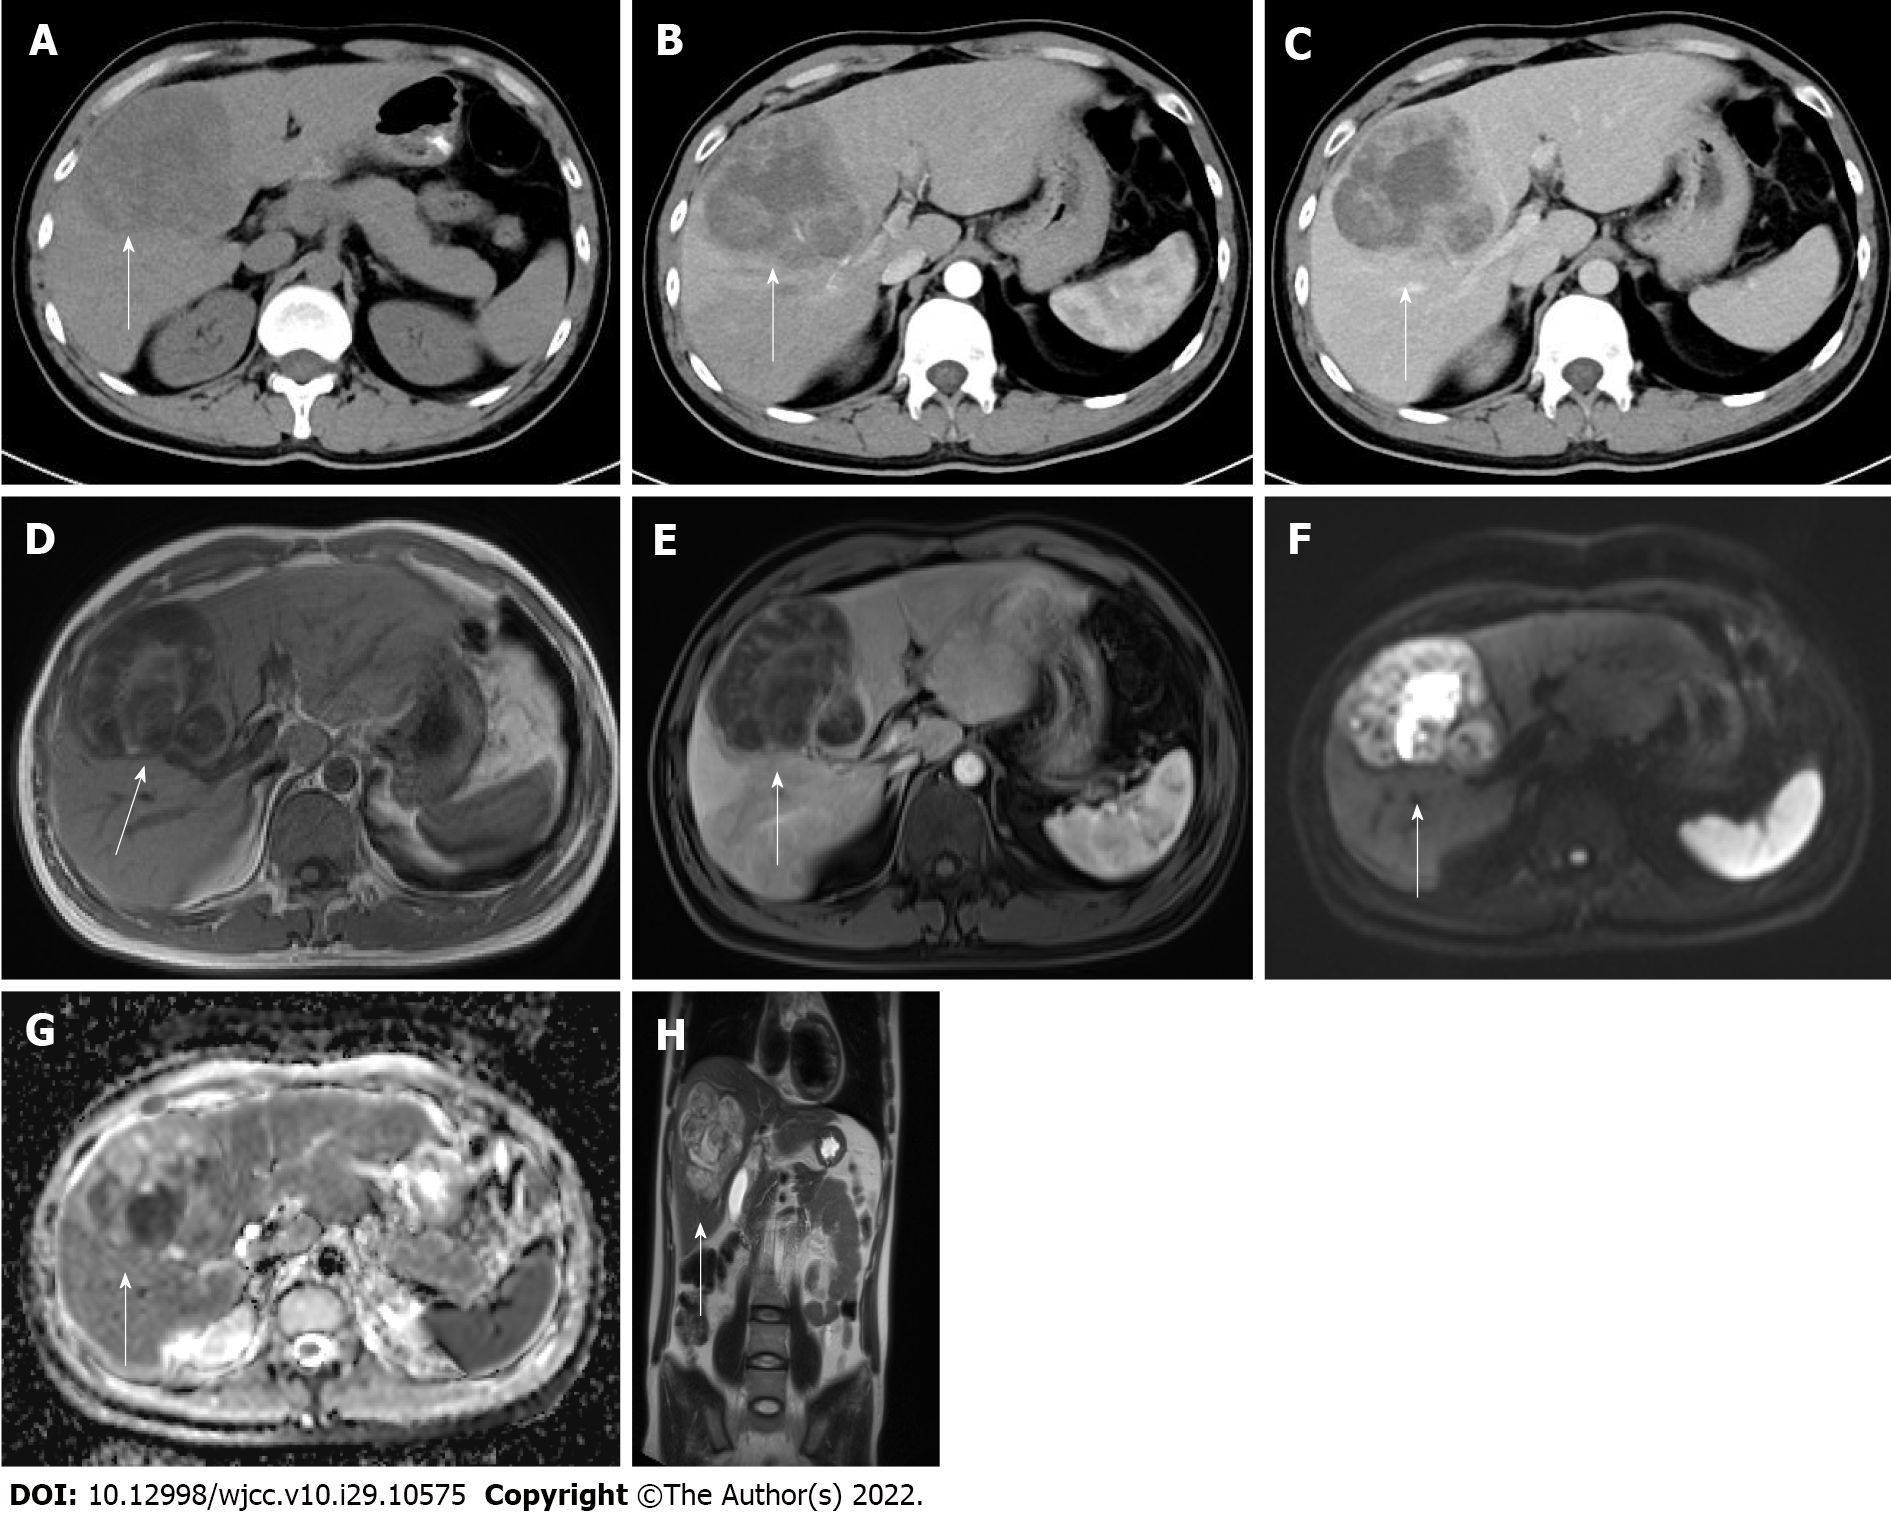
Figure 1 Preoperative computed tomography and magnetic resonance imaging images with white arrows pointing to the lesion.
A: Computed tomography image showing a hypodense mass of approximately 81 mm × 83 mm in size in the liver; B and C: Enhanced scans in the arterial and delayed phases show heterogeneous enhancement of the lesion; D: Magnetic resonance imaging T1-weighted image (T1WI) shows a mixed signal with a predominantly low signal; E: T1WI enhancement with mild heterogeneous enhancement in the arterial phase; F: Diffusion-weighted imaging shows a high heterogeneous signal; G: Apparent diffusion coefficient image shows a low heterogeneous signal; H: Coronal T2WI shows a high signal with multiple iso- and low-signal divisions.
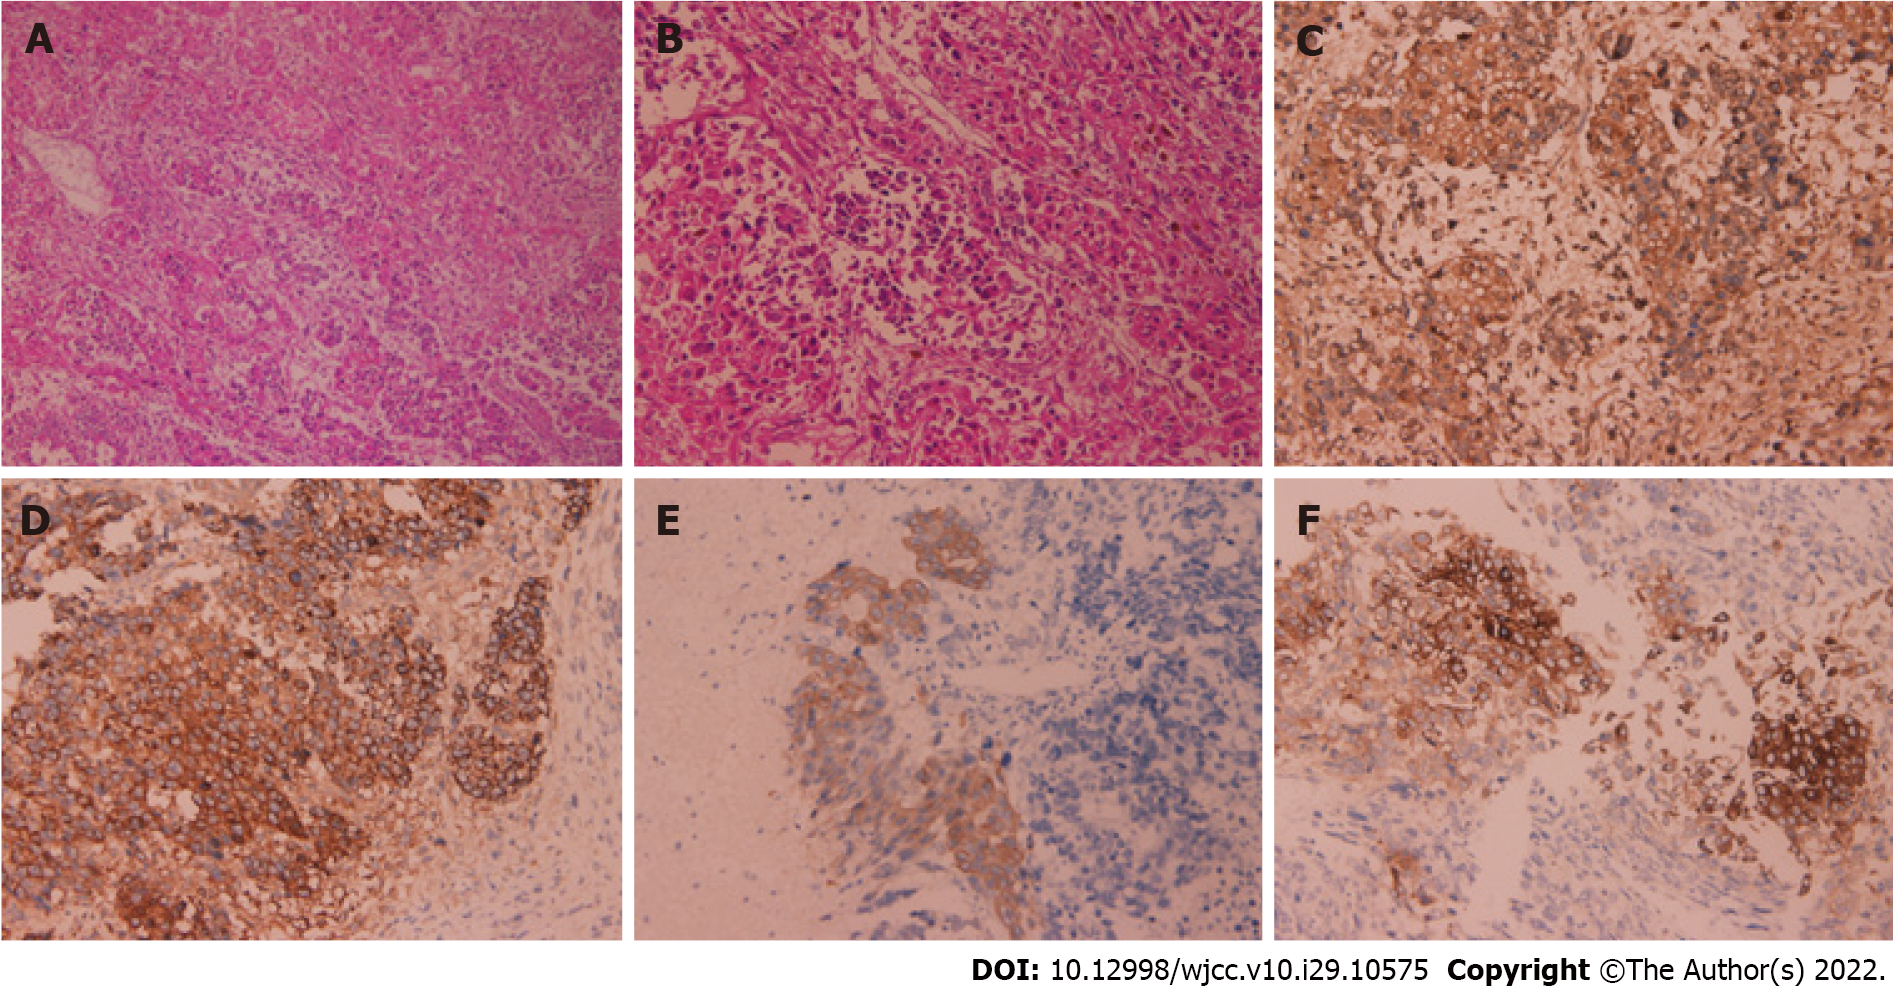
Figure 2 Histology and immunohistochemistry.
A: Hematoxylin and eosin (HE) staining (× 100); B: HE staining (× 200); C: Alpha-fetoprotein (++); D: Hepatocyte (++); E: CK-19 (+); F: Synaptophysin (+).
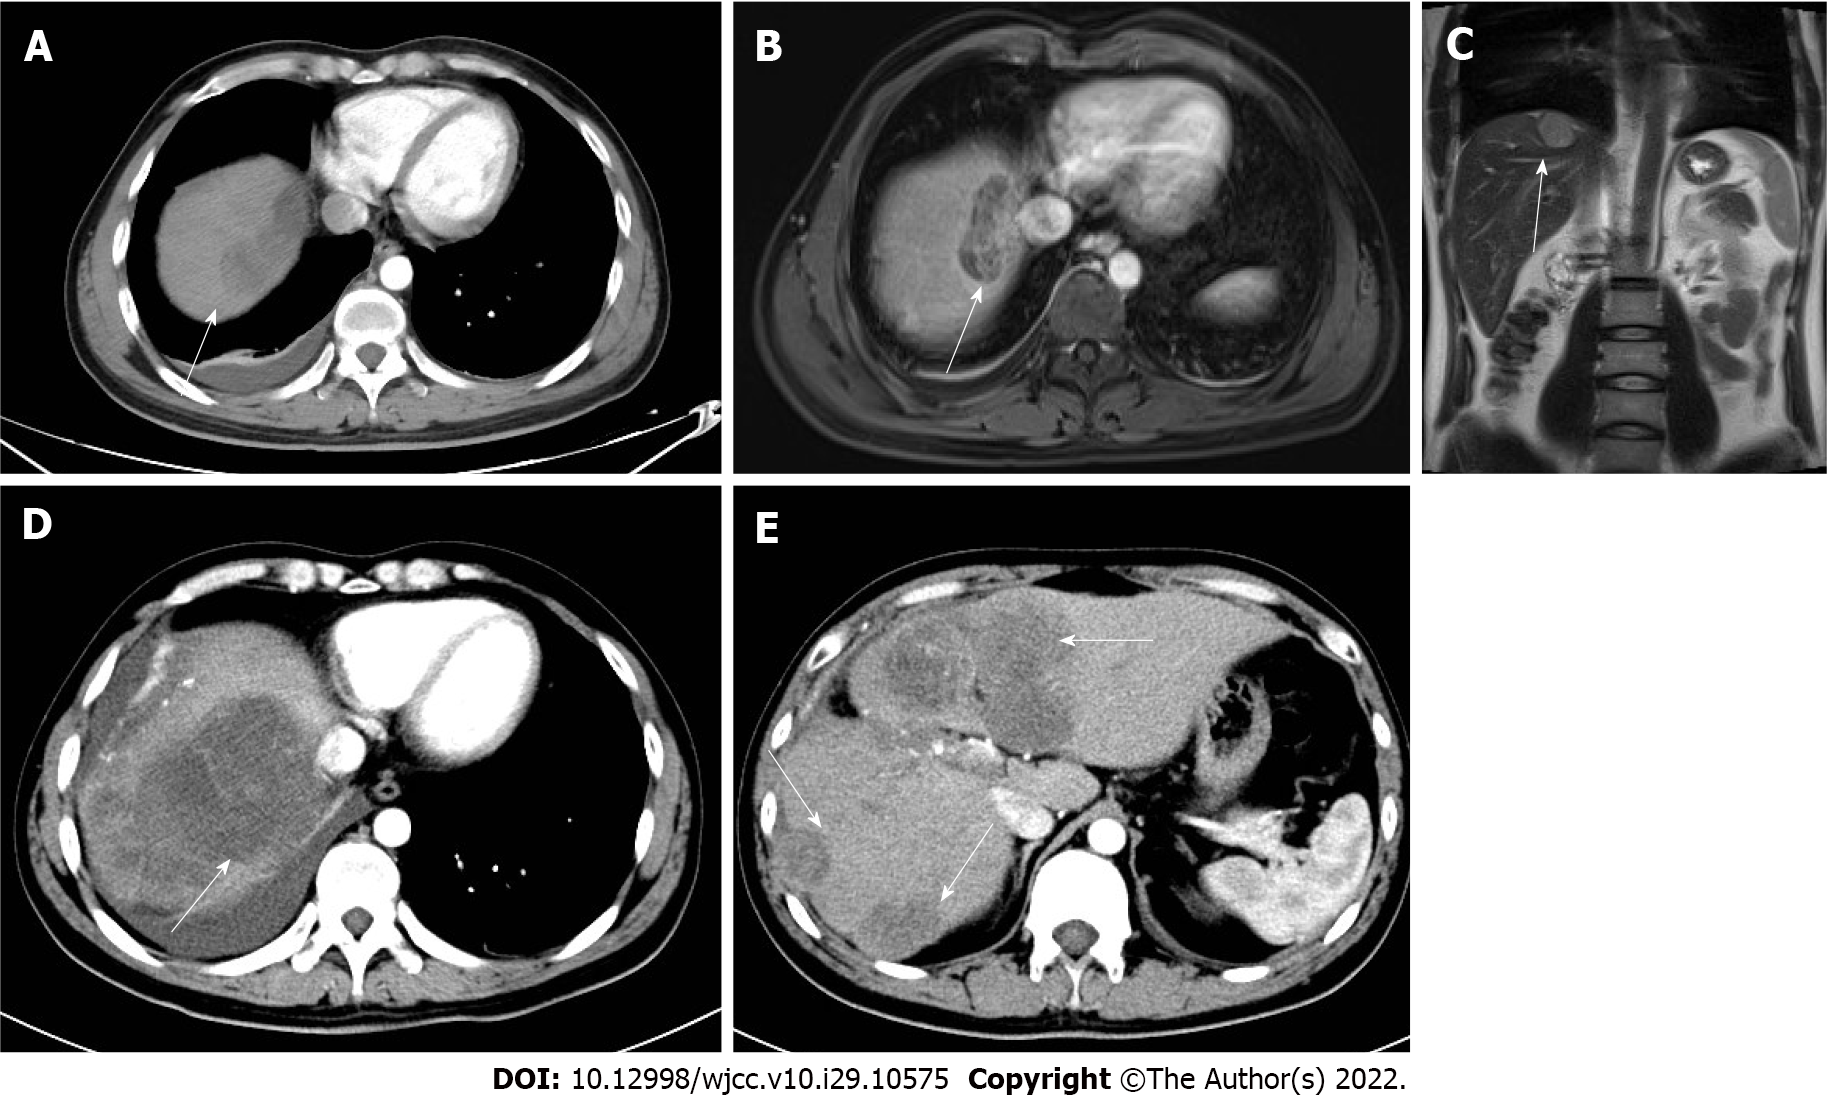
Figure 3 Computed tomography images with white arrows pointing to the lesions.
A: Computed tomography (CT) on October 8, 2021 showed a new mass of approximately 53 mm × 25 mm in the right lobe of the liver; B and C: Magnetic resonance imaging on the same day; D and E: CT on November 24, 2021 showed an enlarged and increased intrahepatic lesion.
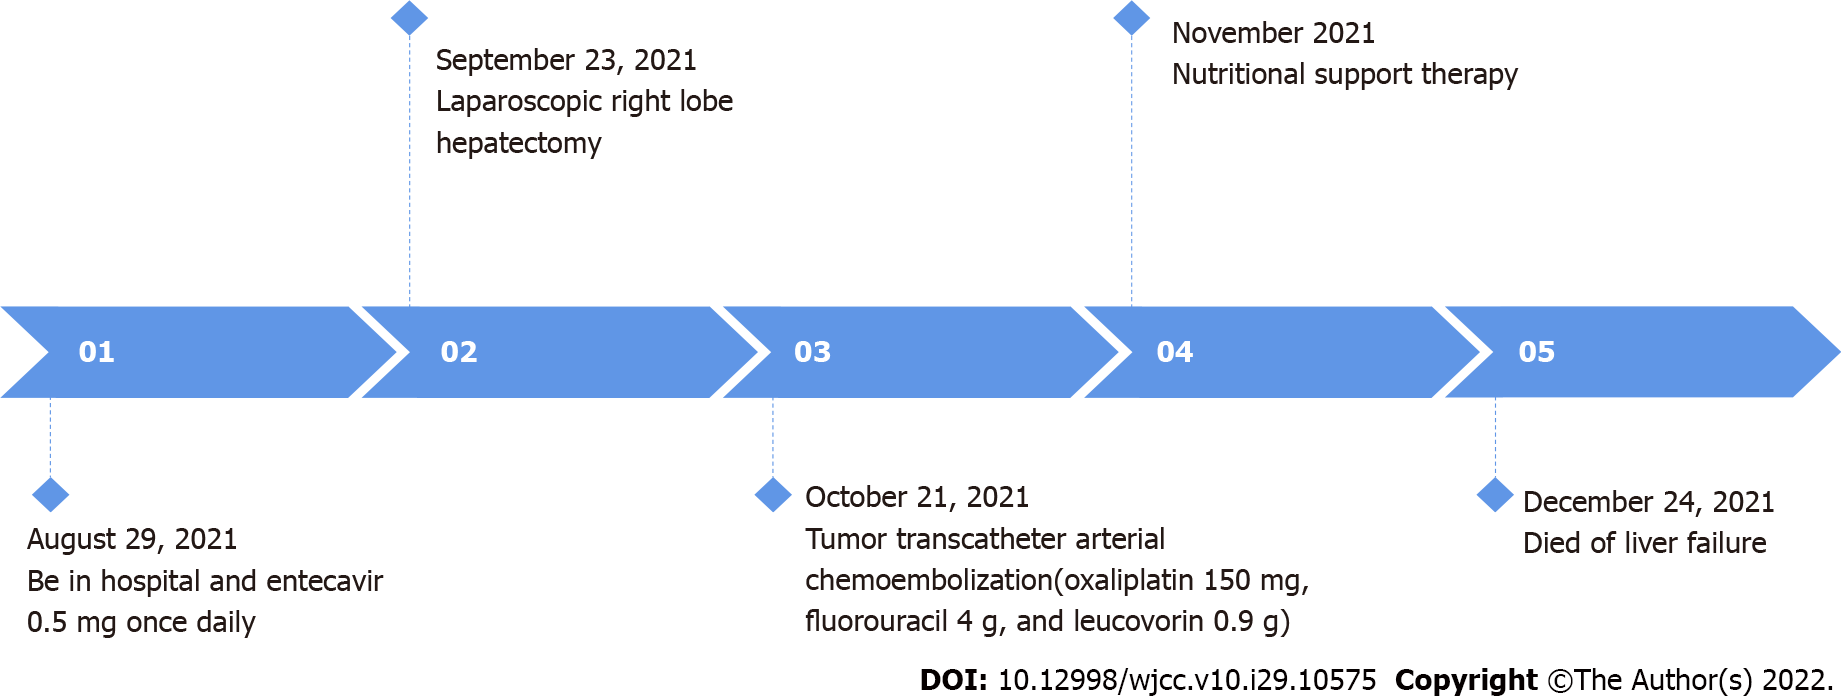
Figure 4 Timeline.
- Citation: Wu Y, Xie CB, He YH, Ke D, Huang Q, Zhao KF, Shi RS. Three-in-one incidence of hepatocellular carcinoma, cholangiocellular carcinoma, and neuroendocrine carcinoma: A case report. World J Clin Cases 2022; 10(29): 10575-10582
- URL: https://www.wjgnet.com/2307-8960/full/v10/i29/10575.htm
- DOI: https://dx.doi.org/10.12998/wjcc.v10.i29.10575


