Copyright
©The Author(s) 2022.
World J Clin Cases. Oct 16, 2022; 10(29): 10501-10515
Published online Oct 16, 2022. doi: 10.12998/wjcc.v10.i29.10501
Published online Oct 16, 2022. doi: 10.12998/wjcc.v10.i29.10501
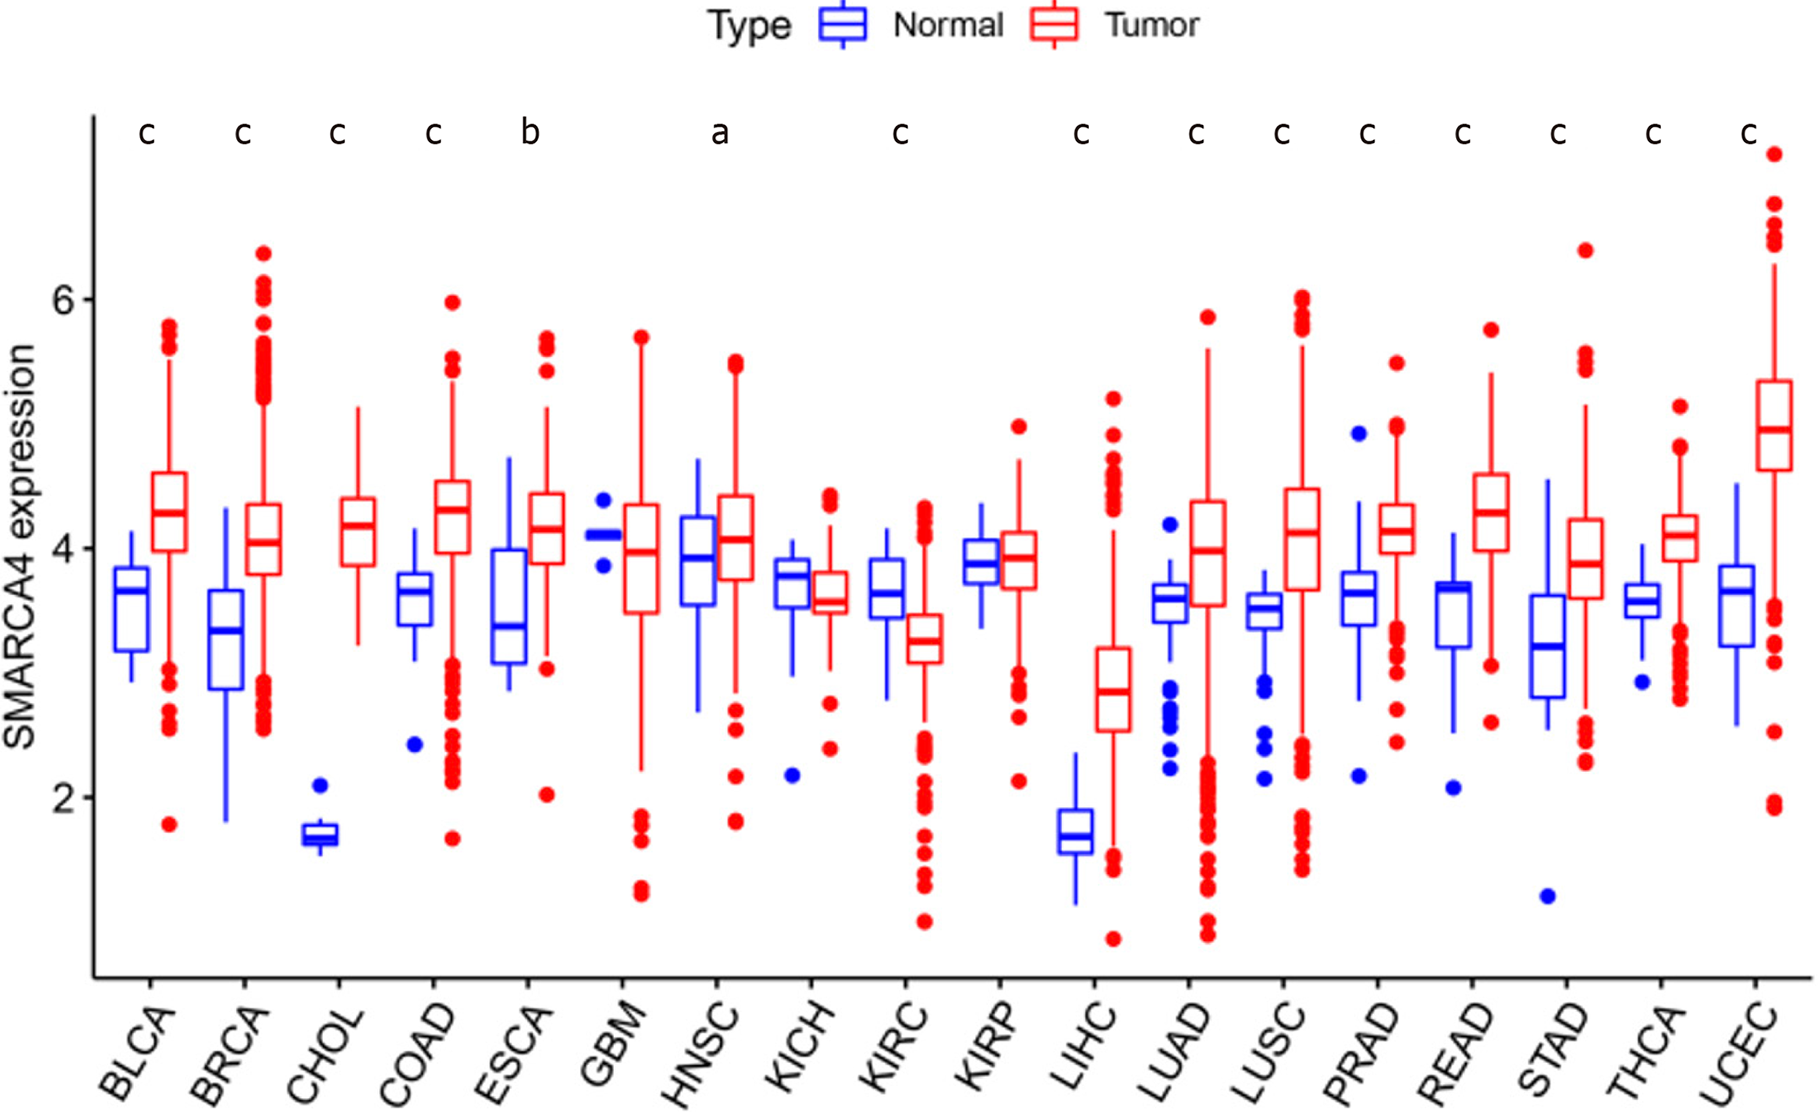
Figure 1 Expression of SMARCA4 in 18 different cancer types.
aP < 0.05, bP < 0.01, cP < 0.001. BLCA: Bladder cancer; BRCA: Breast cancer; CHOL: Bile duct cancer; COAD: Colon cancer; ESCA: Esophageal cancer; GBM: Glioblastoma; HNSC: Head and neck cancer; KICH: Kidney chromophobe; KIRC: Kidney clear cell carcinoma; KIRP: Kidney papillary cell carcinoma; LIHC: Liver cancer; LUAD: Lung adenocarcinoma; LUSC: Lung squamous cell carcinoma; PRAD: Prostate cancer; READ: Rectal adenocarcinoma; STAD: Stomach cancer; THCA: Thyroid cancer; EC: Endometrioid cancer.
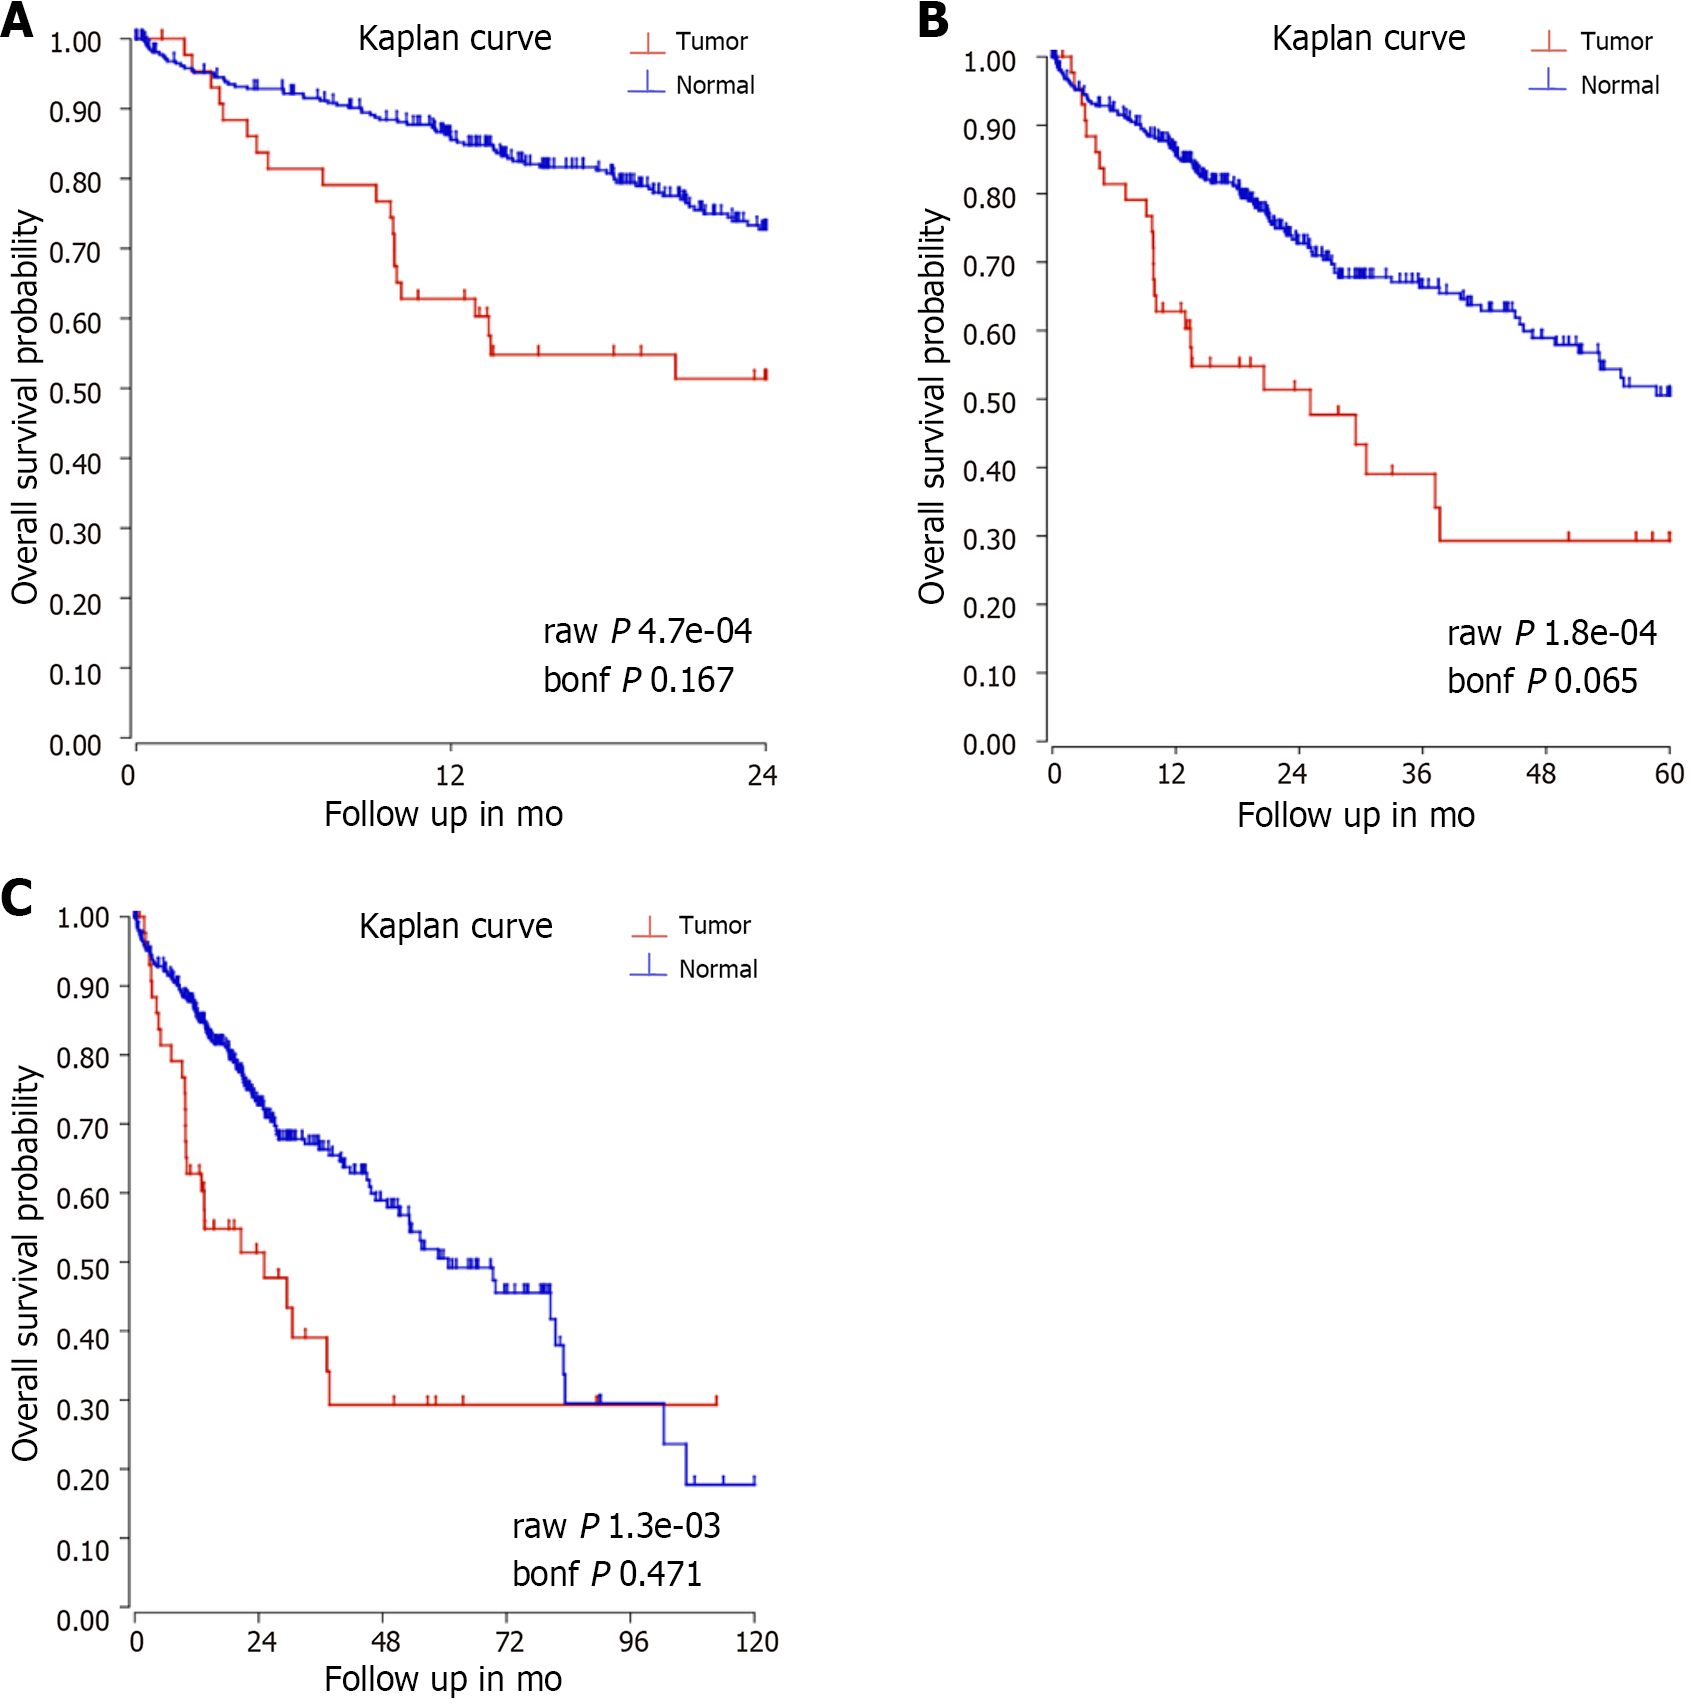
Figure 2 Prognostic value of SMARCA4 in patients with hepatocellular carcinoma.
A: 2-year survival analysis, B: 5-year survival analysis, C: 10-year survival analysis.
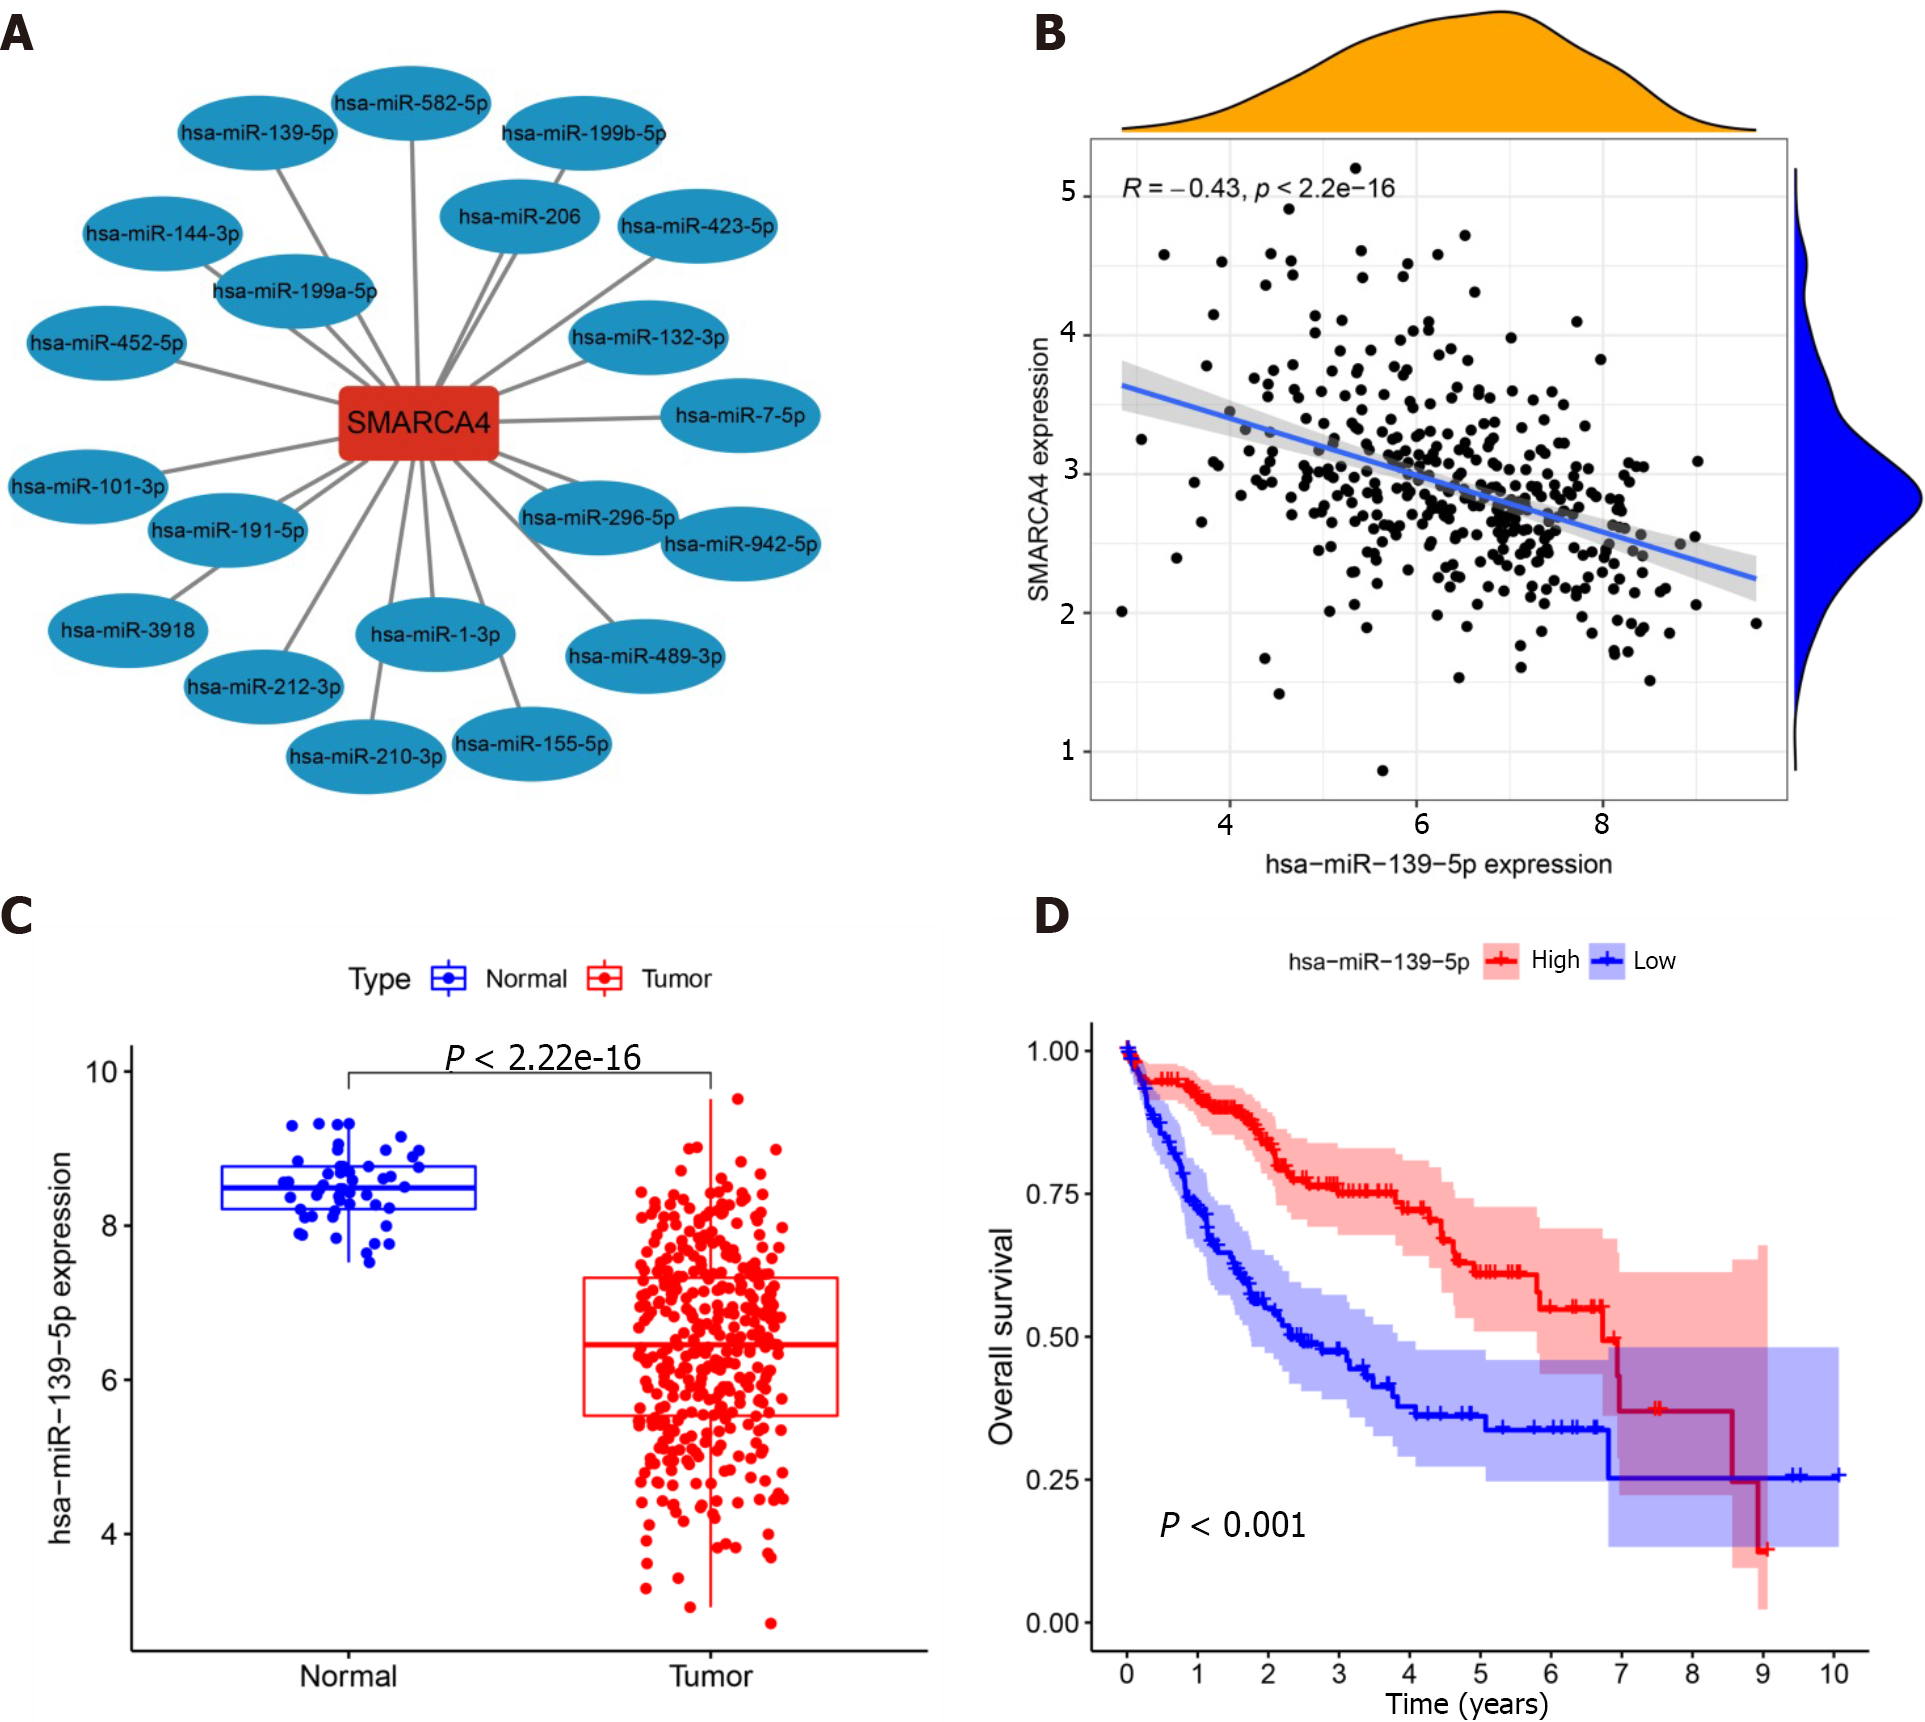
Figure 3 Identification of miRNAs upstream of SMARCA4.
A: Upstream miRNAs of SMARCA4; B: Correlation analysis of miR-139-5p and SMARCA4; C: Different expression of SMARCA4 between normal and tumor tissue in hepatocellular carcinoma (HCC) patients; D: Survival analysis of miR-139-5p in patients with HCC.
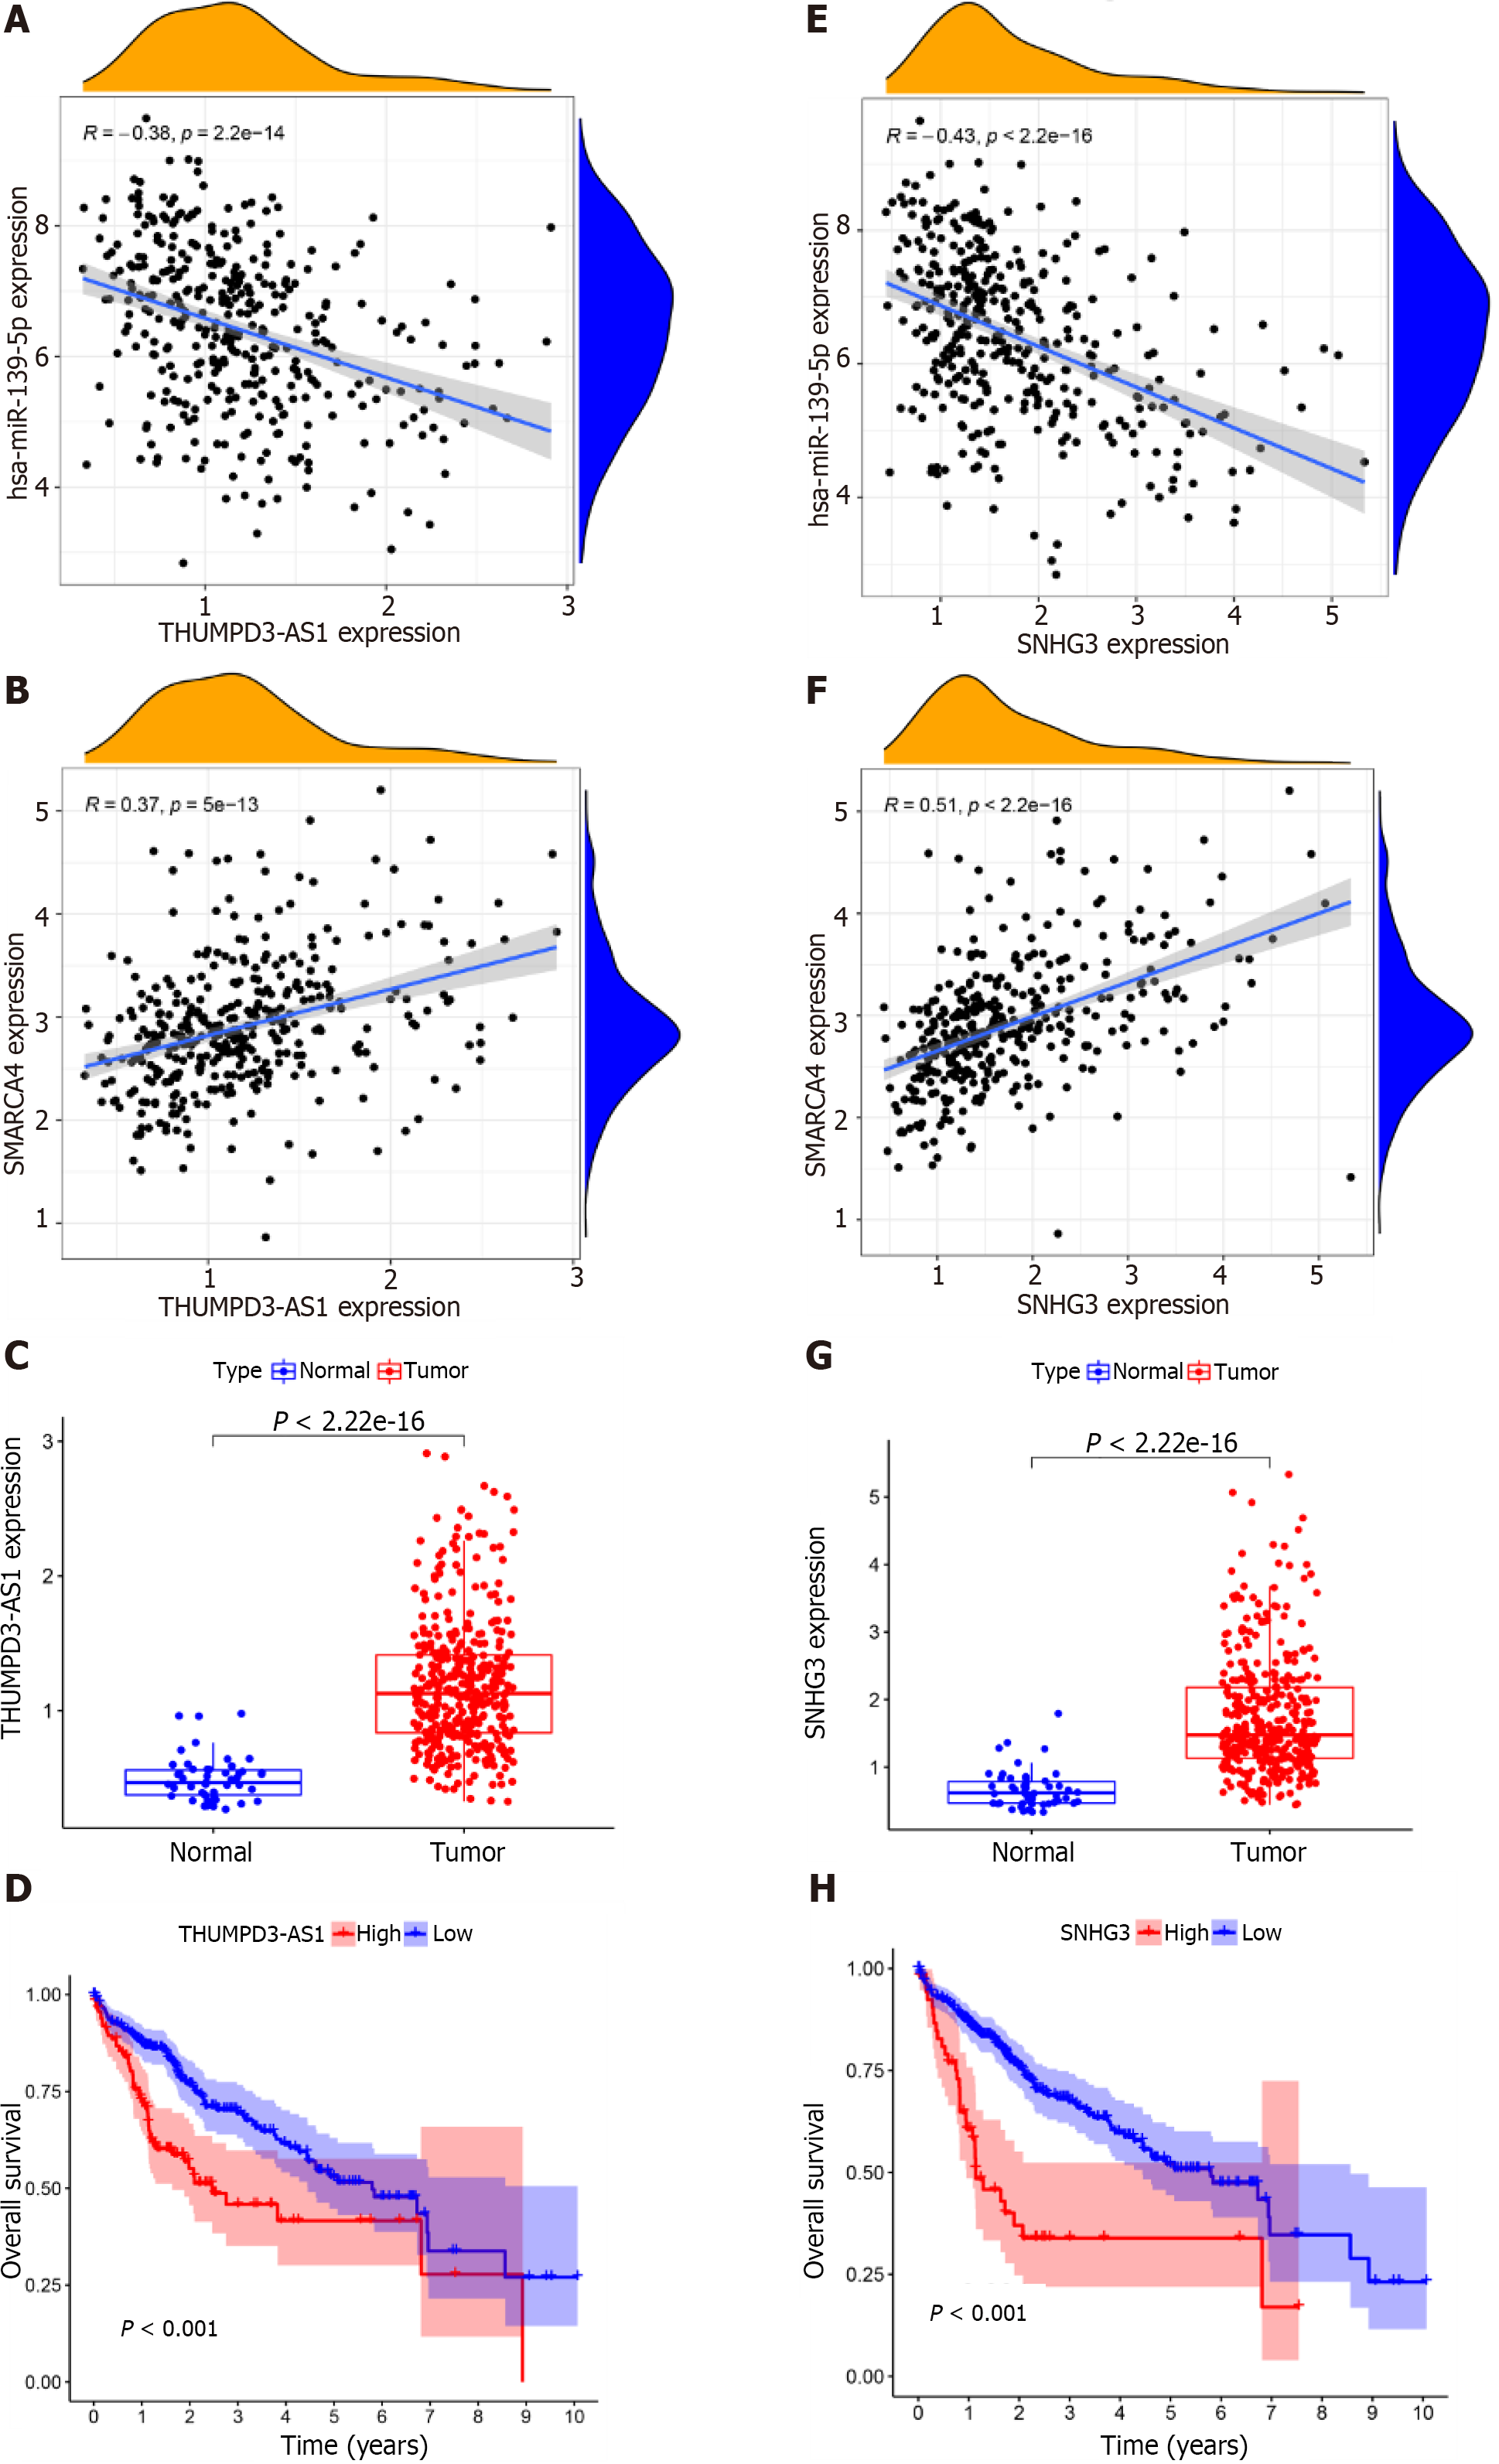
Figure 4 Correlation analysis of long noncoding RNAs upstream of hsa-miR-139-5p.
A: Relation between expression of miR-139-5p and THUMPD3-AS1; B: Relation between expression of SMARCA4 and THUMPD3-AS1; C: Expression of THUMPD3-AS1 in tumor and normal tissues in hepatocellular carcinoma (HCC) patients; D: Survival analysis of THUMPD3-AS1 in HCC patients; E: Relation between expression of miR-139-5p and SNHG3; F: Relation between expression of SMARCA4 and SNHG3; G: Different expression of SNHG3 in tumor and normal tissues; H: Survival analysis of SNHG3 in HCC patients.
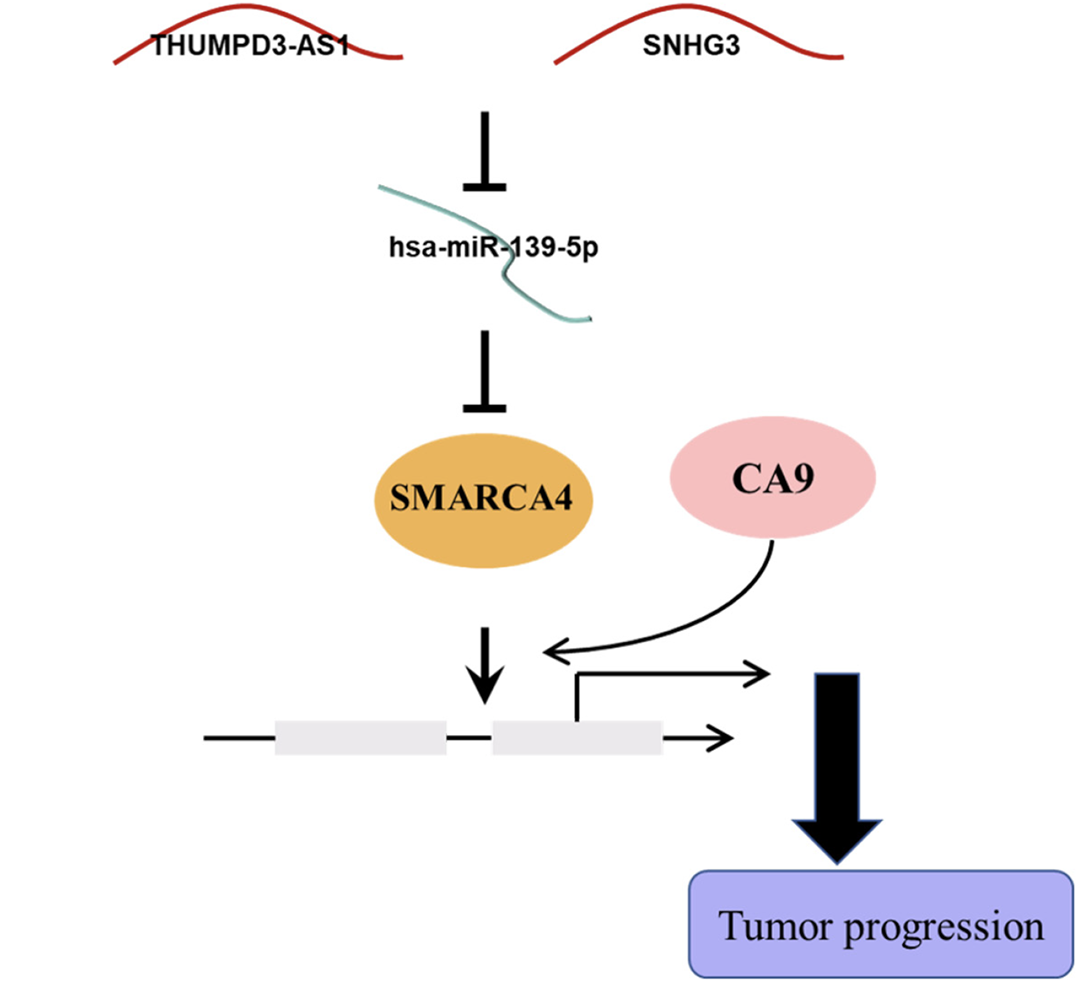
Figure 5 The schematic diagram of SNHG3/THUMP3-AS1-miR-139-5p-SMARCA4- Carbonic Anhydrase 9 in hepatocellular carcinoma.
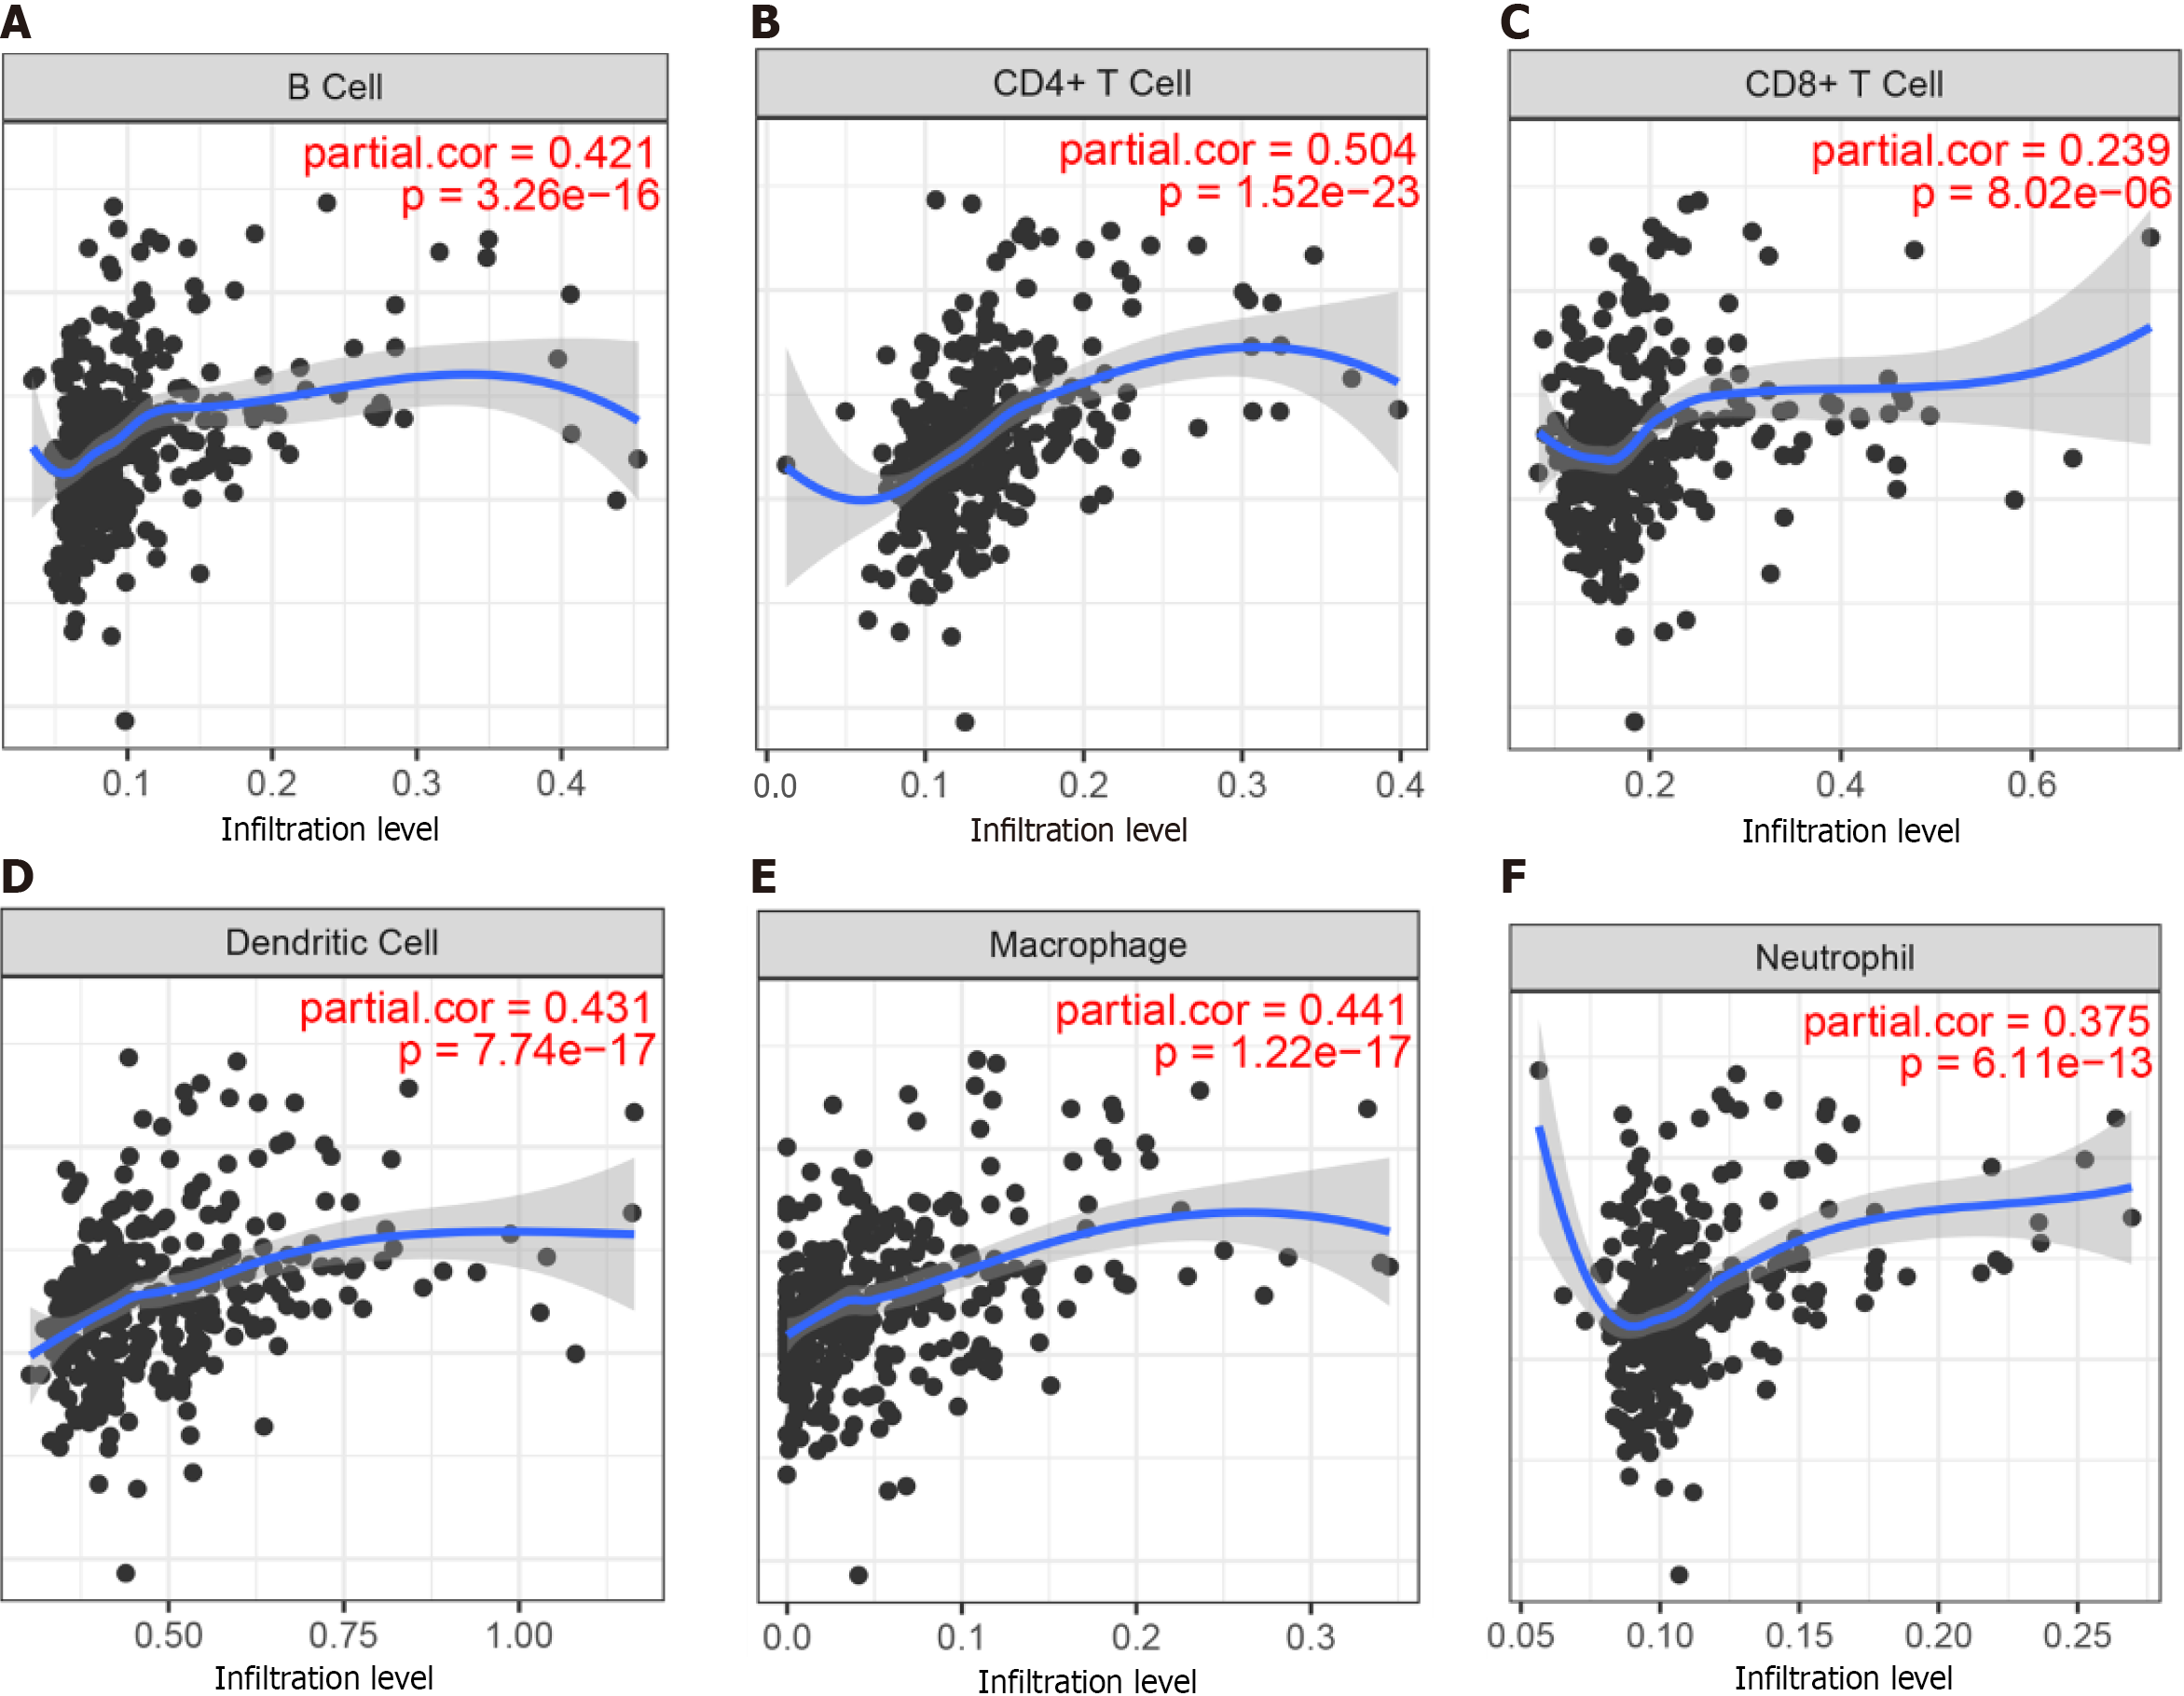
Figure 6 Correlation of expression levels of SMARCA4 with different cells.
A: B cells; B: CD4+ T cells; C: CD8+ T cells; D: Dendritic cells; E: Macrophages; F: Neutrophils.
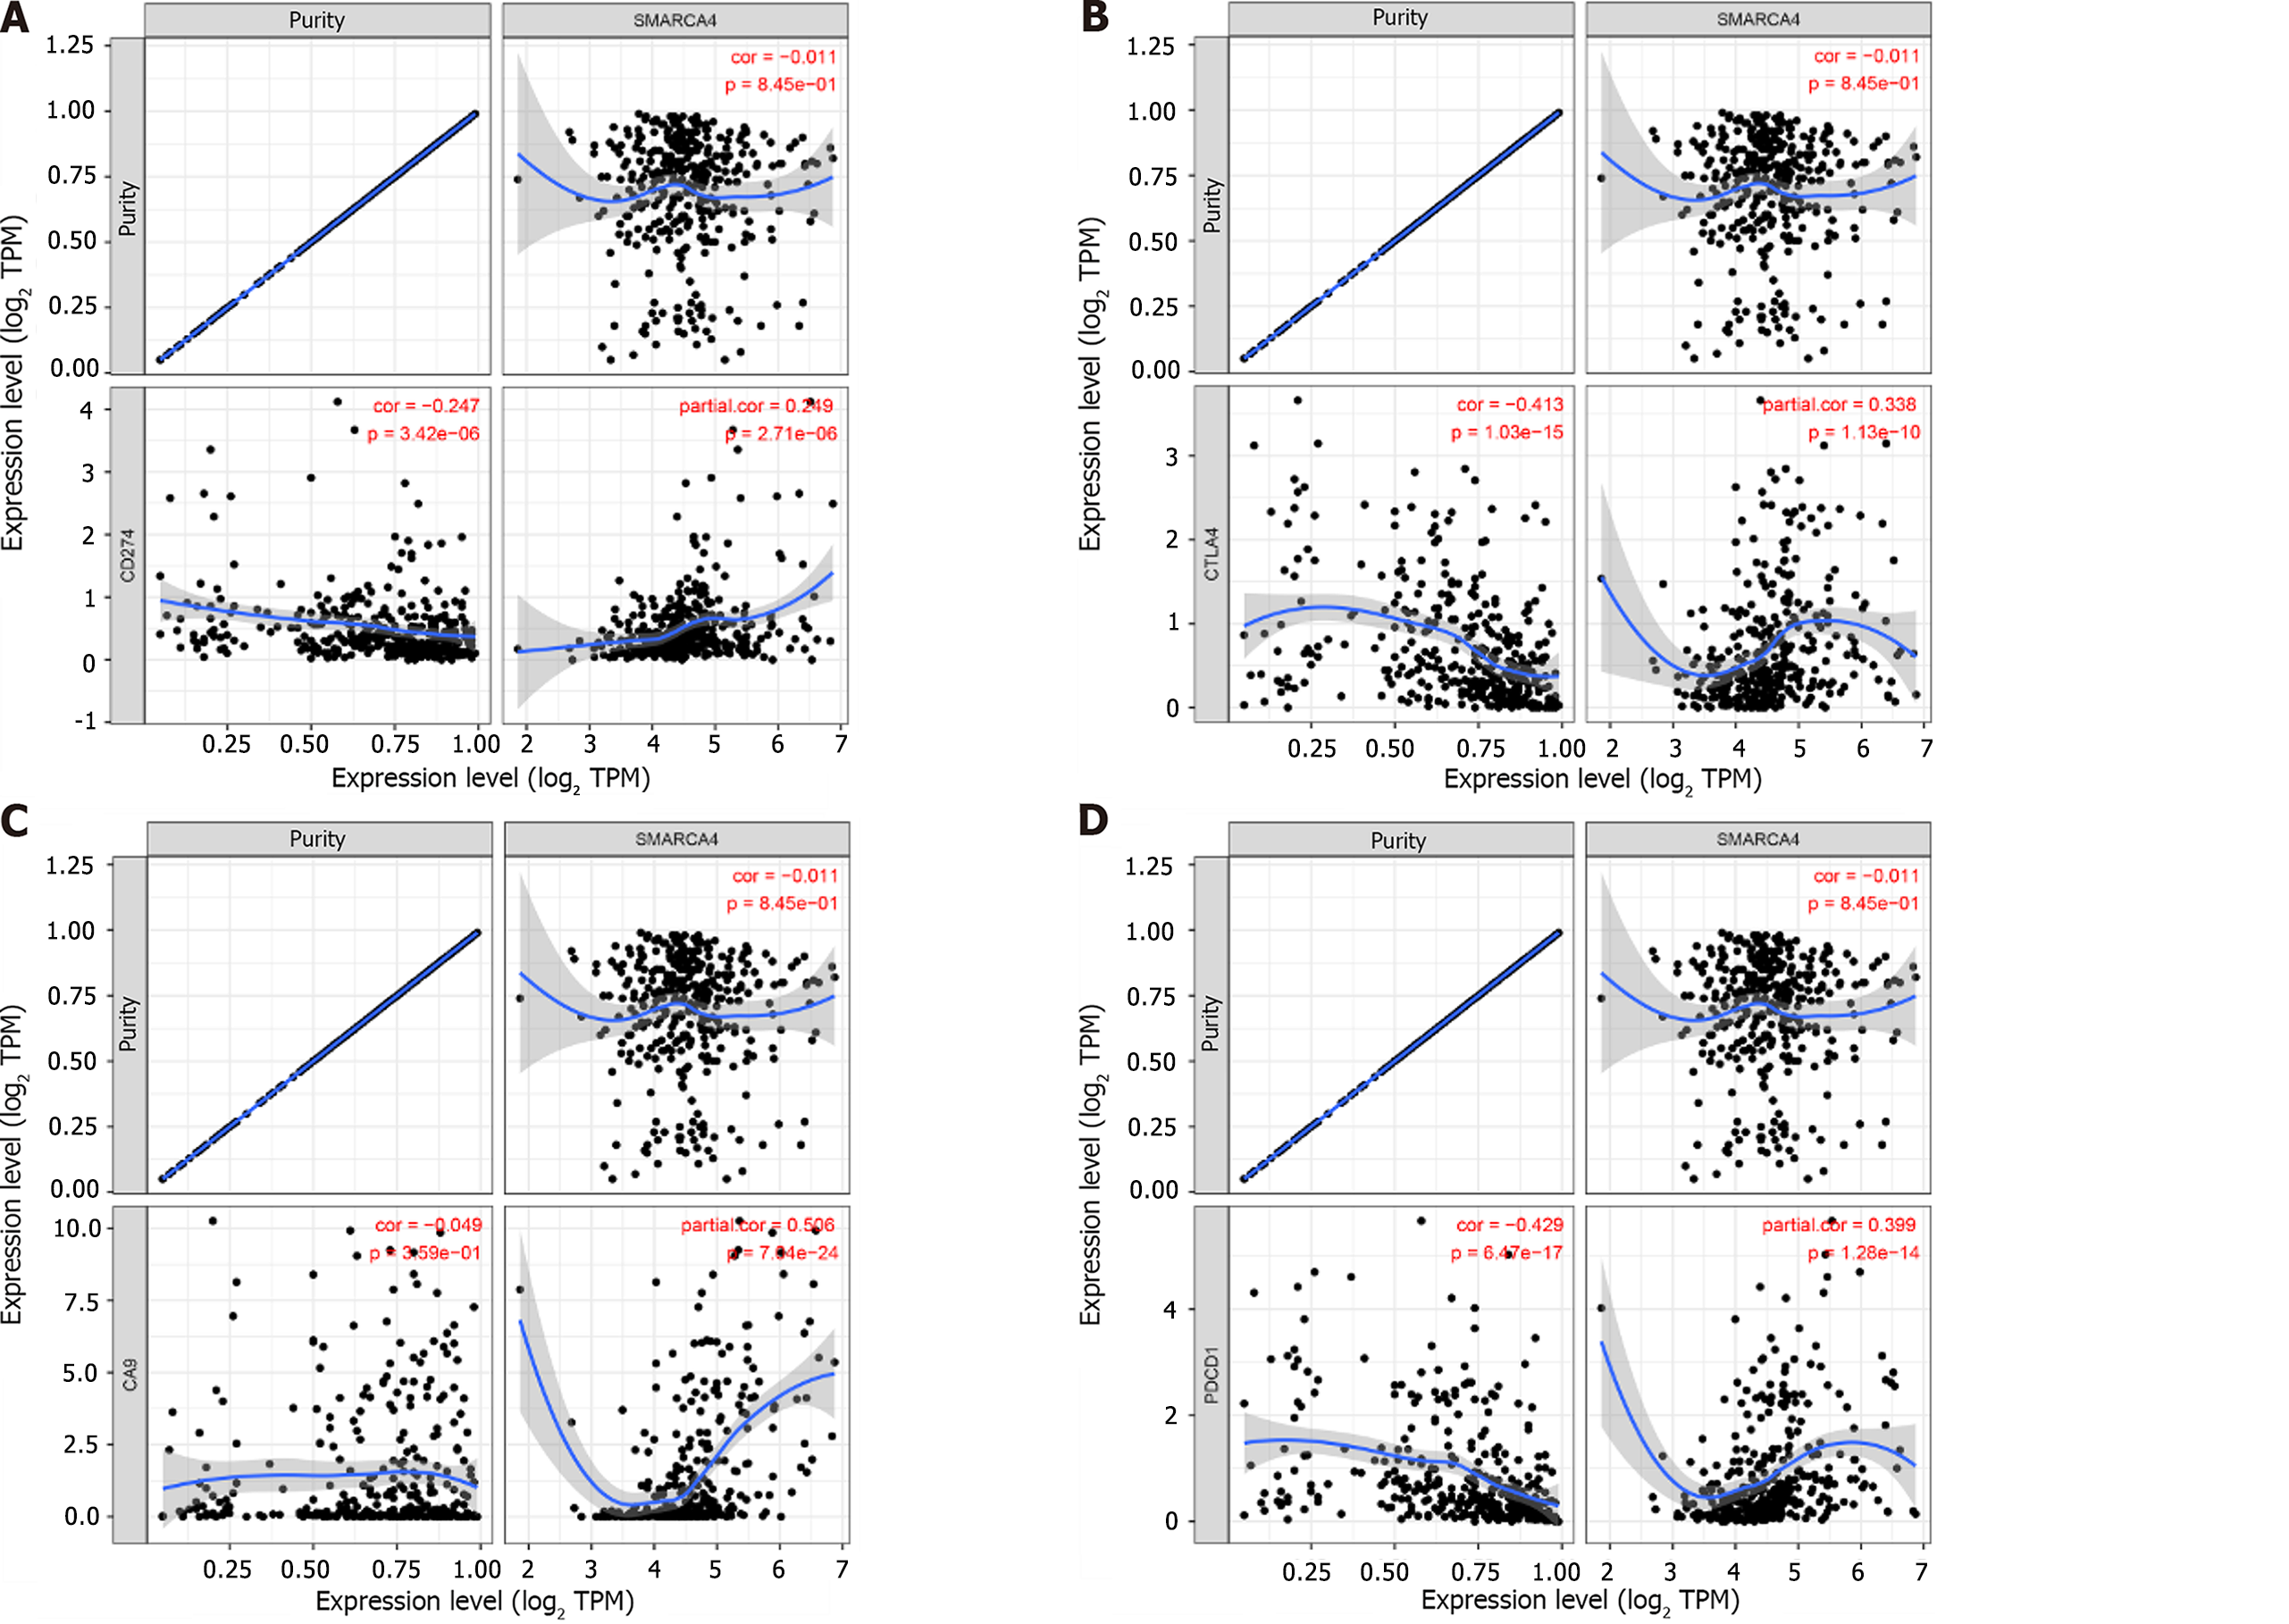
Figure 7 Relationships between the expression levels of SMARCA4 and the aforementioned coding genes.
A: CD274; B: CTLA4; C: CA9; D: PDCD1.
- Citation: Zhang L, Sun T, Wu XY, Fei FM, Gao ZZ. Delineation of a SMARCA4-specific competing endogenous RNA network and its function in hepatocellular carcinoma. World J Clin Cases 2022; 10(29): 10501-10515
- URL: https://www.wjgnet.com/2307-8960/full/v10/i29/10501.htm
- DOI: https://dx.doi.org/10.12998/wjcc.v10.i29.10501


