Copyright
©The Author(s) 2022.
World J Clin Cases. Aug 26, 2022; 10(24): 8587-8598
Published online Aug 26, 2022. doi: 10.12998/wjcc.v10.i24.8587
Published online Aug 26, 2022. doi: 10.12998/wjcc.v10.i24.8587
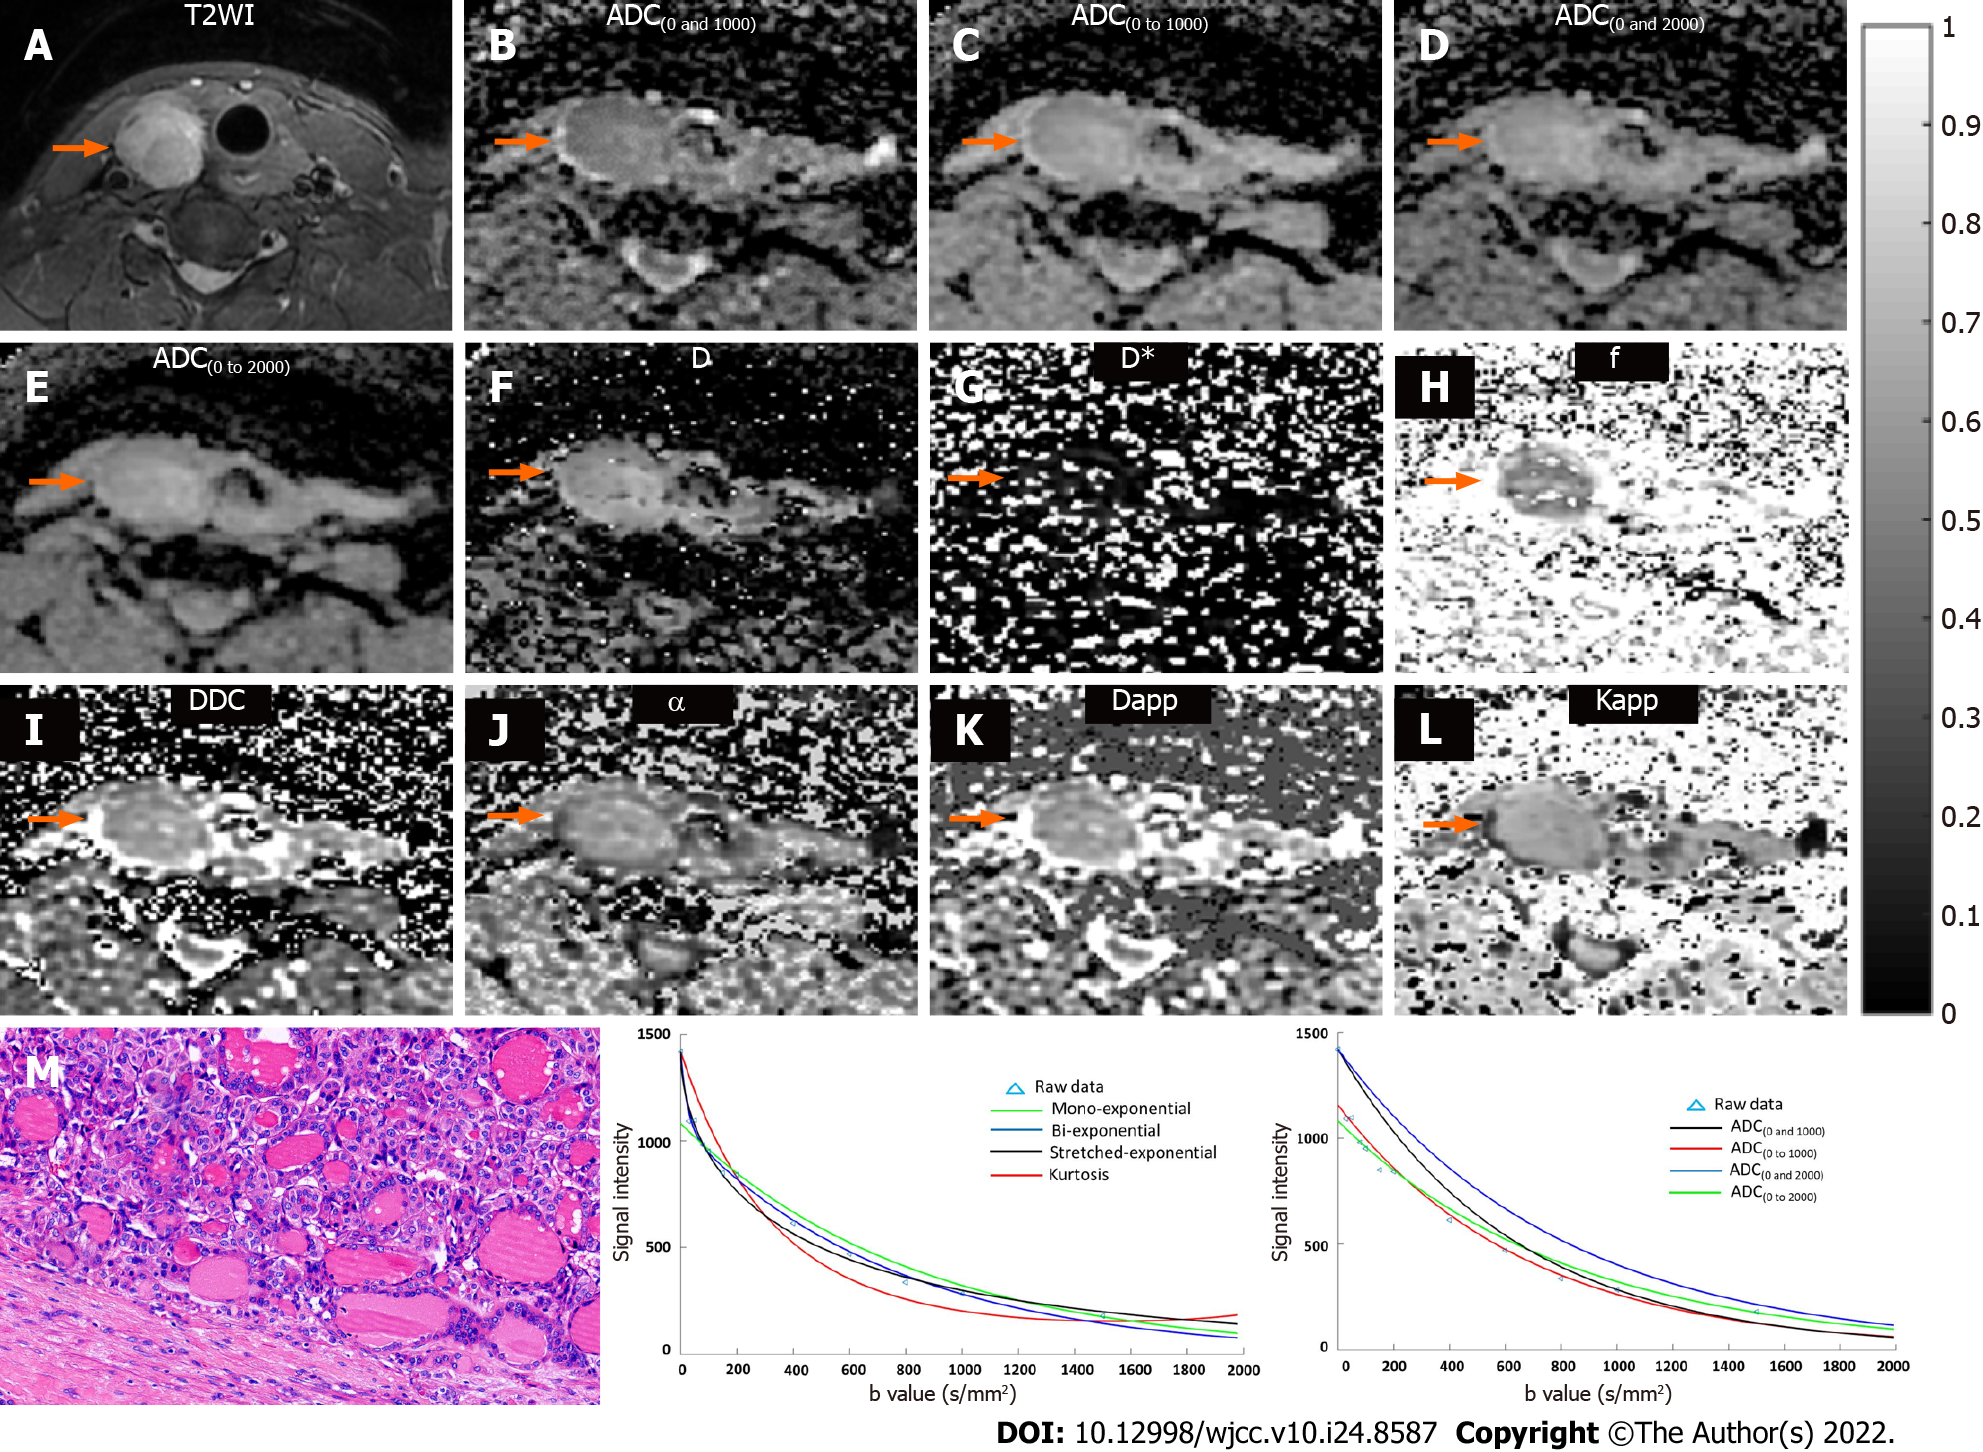
Figure 1 Data from a 49-year-old female with a benign nodule of thyroid adenoma in the right lateral of thyroid.
A: T2WI shows the lesion in the right lateral of thyroid (orange arrow). Multiparametric diffusion parameter maps fitted by mono-exponential [B = ADC(0 and 1000); C = ADC(0 to 1000); D = ADC(0 and 2000); E = ADC(0 to 2000)], bi-exponential (F = D; G = D*; H = f), stretched exponential (I = DDC; J = α), and kurtosis diffusion-weighted imaging (K = Dapp; L = Kapp) models show the lesion in the right lateral of thyroid (orange arrow); M: Histopathological H&E image (original magnification, 200×) demonstrate abundant colloid and benign-appearing follicular cells; N: Plot of the decay of diffusion weighted signal intensity fitted by a mono-exponential (green), biexponential (blue), stretched-exponential (dark), and kurtosis (red) models for the nodule; O: Plot of the decay of diffusion weighted signal intensity fitted by a mono-exponential with b = 0 and 1000 (dark), b = 0 to 1000 (red), b = 0 and 2000 (blue), and b = 0 to 2000 (green) for the nodule. ADC: Apparent diffusion coefficient; D: Slow diffusion coefficient; D*: Fast diffusion coefficient; f: Fraction of fast diffusion; DDC: Distributed diffusion coefficient; α: Anomalous exponent term; Dapp: Mean diffusivity; Kapp: Mean kurtosis; ROC: Receiver operating characteristic.
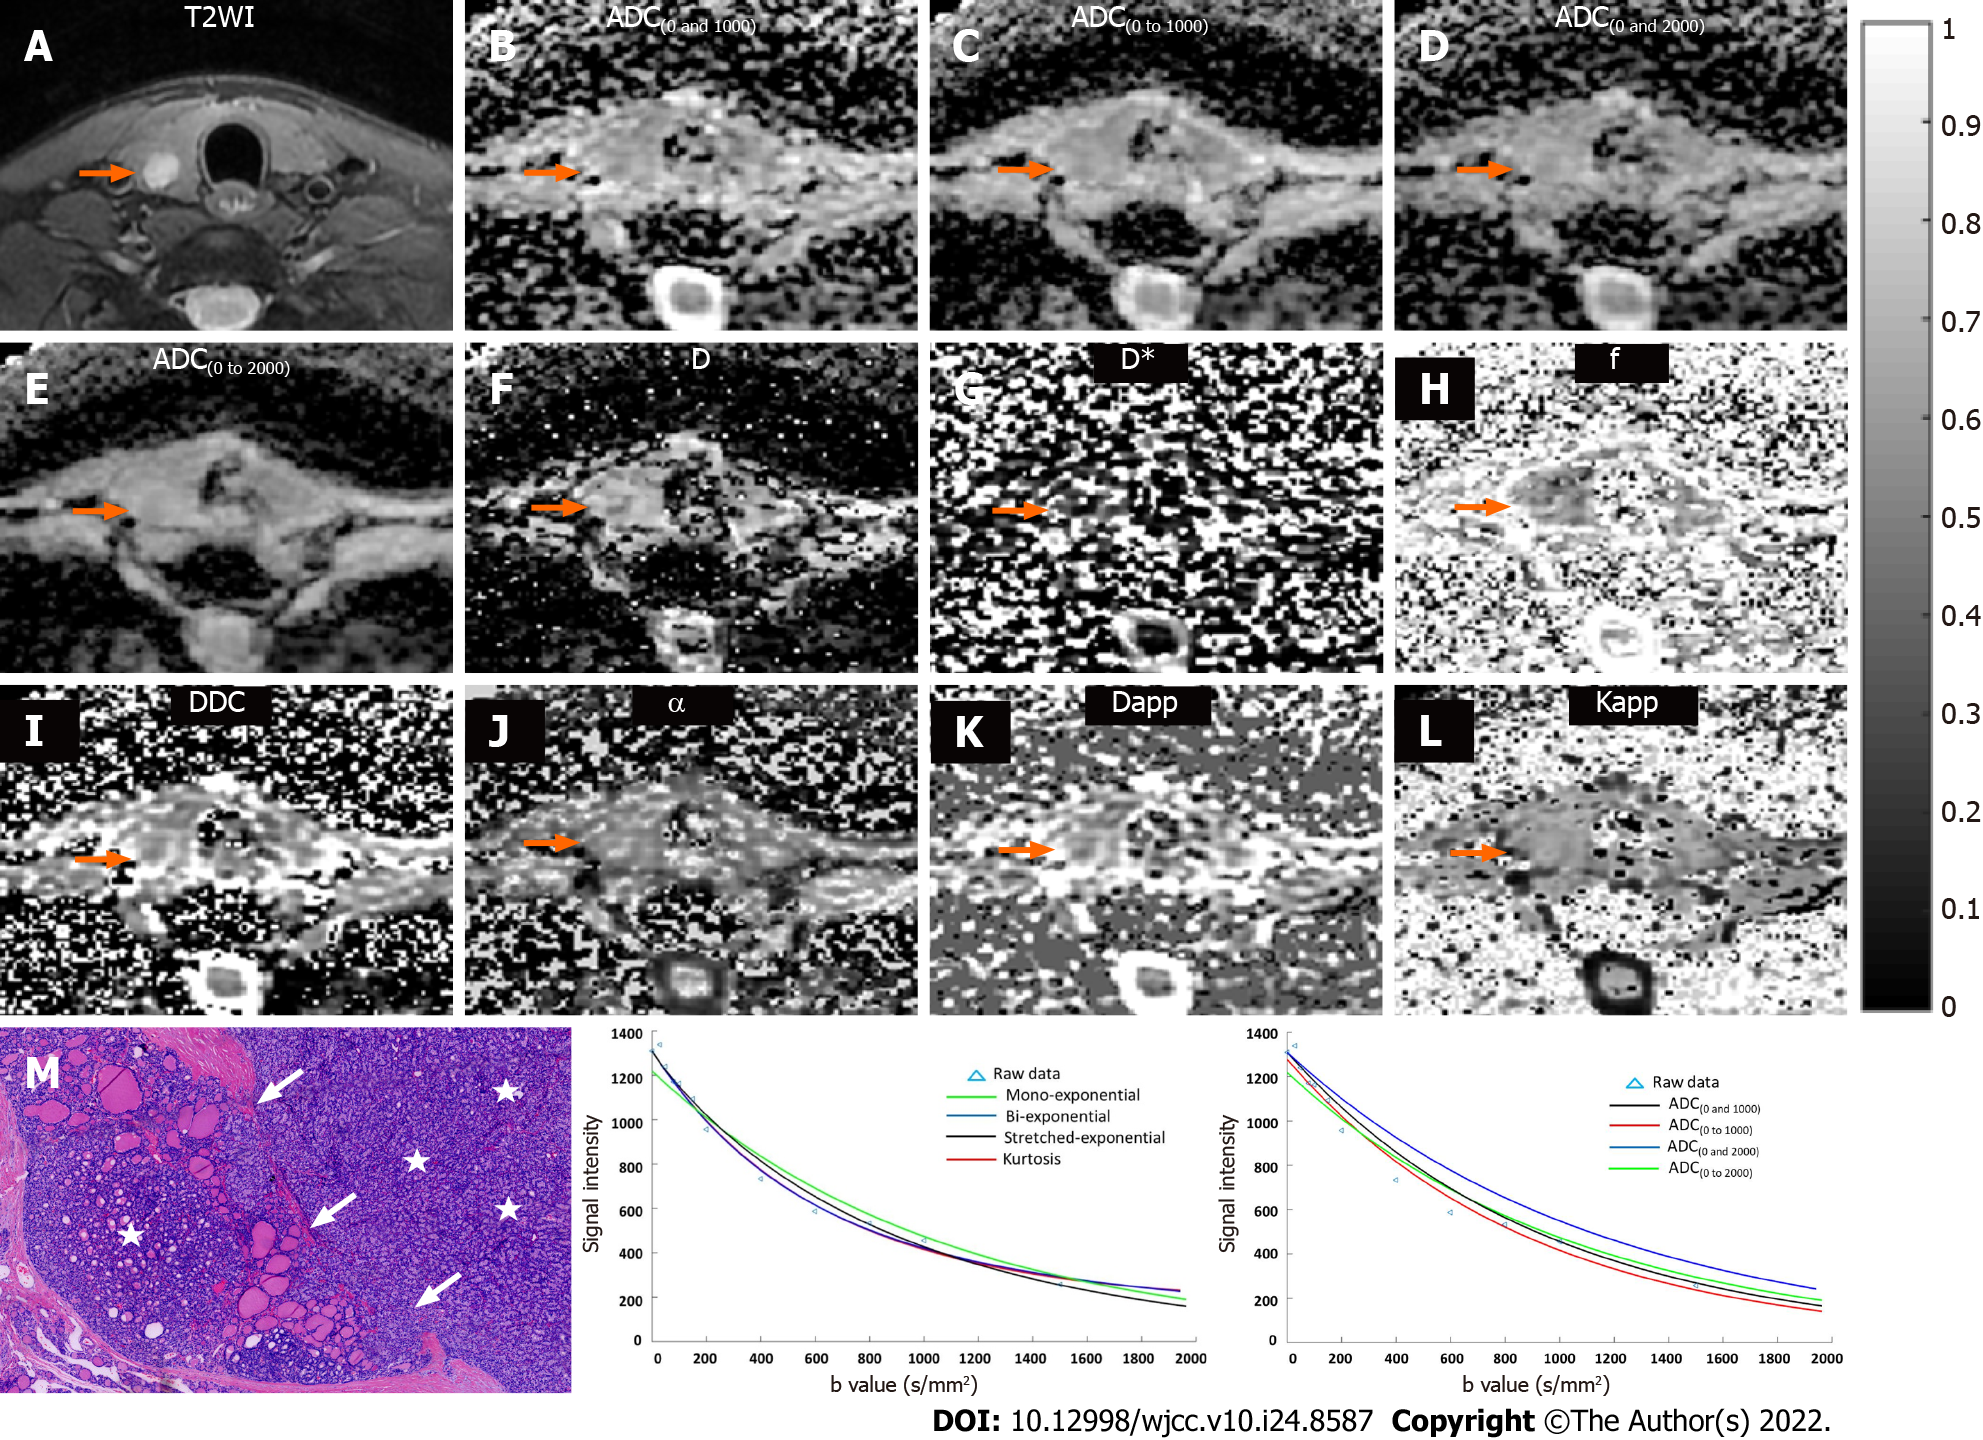
Figure 2 Data from a 35-year-old male with a malignant nodule of follicular thyroid carcinoma in the right lateral of thyroid.
A: T2WI shows the lesion in the right lateral of thyroid (orange arrow). Multiparametric diffusion parameter maps fitted by mono-exponential [B = ADC(0 and 1000); C = ADC(0 to 1000); D = ADC(0 and 2000); E = ADC(0 to 2000)], bi-exponential (F = D; G = D*; H = f), stretched exponential (I = DDC; J = α), and kurtosis diffusion-weighted imaging (K = Dapp; L = Kapp) models show the lesion in the right lateral of thyroid (orange arrow); M: Histopathological H&E image (original magnification, 40×) demonstrate high cell density (stars) and capsular invasion (write arrow); N: Plot of the decay of diffusion weighted signal intensity fitted by a mono-exponential (green), biexponential (blue), stretched-exponential (dark), and kurtosis (red) models for the nodule; O: Plot of the decay of diffusion weighted signal intensity fitted by a mono-exponential with b = 0 and 1000 (dark), b = 0 to 1000 (red), b = 0 and 2000 (blue), and b = 0 to 2000 (green) for the nodule. ADC: Apparent diffusion coefficient; D: Slow diffusion coefficient; D*: Fast diffusion coefficient; f: Fraction of fast diffusion; DDC: Distributed diffusion coefficient; α: Anomalous exponent term; Dapp: Mean diffusivity; Kapp: Mean kurtosis; ROC: Receiver operating characteristic.
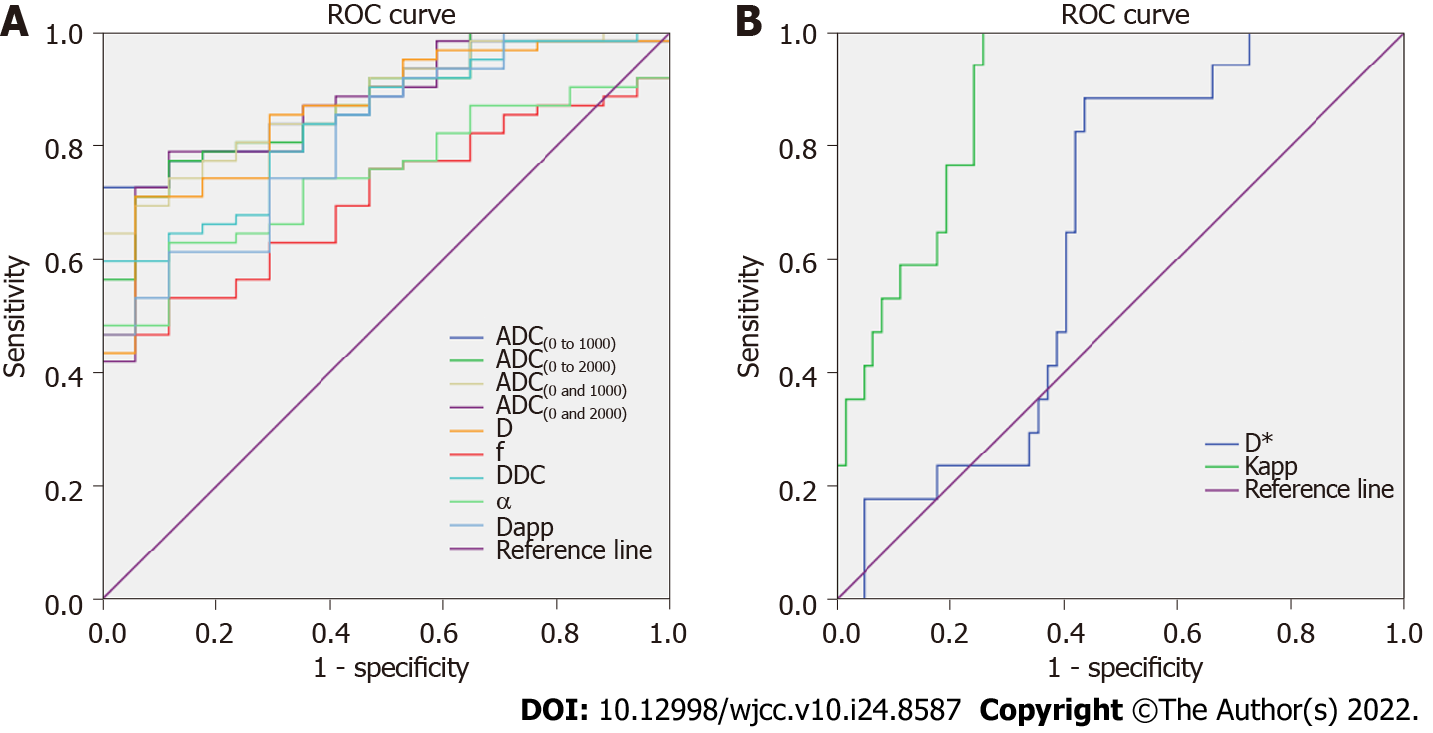
Figure 3 Receiver operating characteristic curve analysis of different diffusion parameters for differentiating malignant thyroid nodules from benign thyroid nodules.
ADC: Apparent diffusion coefficient; D: Slow diffusion coefficient; D*: Fast diffusion coefficient; f: Fraction of fast diffusion; DDC: Distributed diffusion coefficient; α: Anomalous exponent term; Dapp: Mean diffusivity; Kapp: Mean kurtosis; ROC: Receiver operating characteristic.
- Citation: Zhu X, Wang J, Wang YC, Zhu ZF, Tang J, Wen XW, Fang Y, Han J. Quantitative differentiation of malignant and benign thyroid nodules with multi-parameter diffusion-weighted imaging. World J Clin Cases 2022; 10(24): 8587-8598
- URL: https://www.wjgnet.com/2307-8960/full/v10/i24/8587.htm
- DOI: https://dx.doi.org/10.12998/wjcc.v10.i24.8587


