Copyright
©The Author(s) 2016.
World J Methodol. Jun 26, 2016; 6(2): 154-162
Published online Jun 26, 2016. doi: 10.5662/wjm.v6.i2.154
Published online Jun 26, 2016. doi: 10.5662/wjm.v6.i2.154
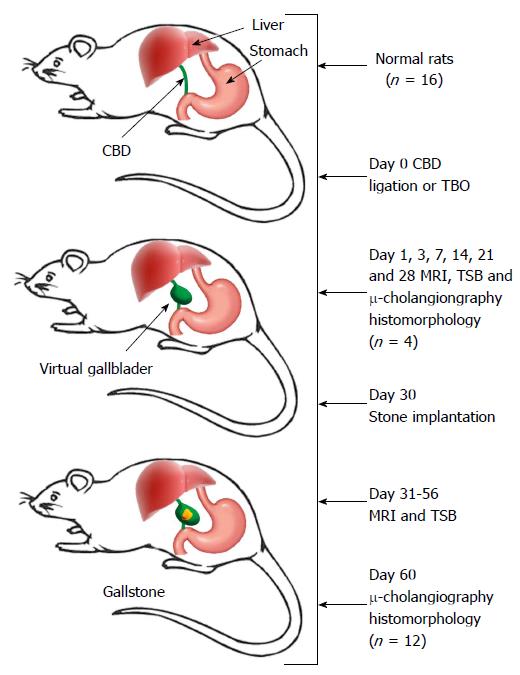
Figure 1 Flow chart of the experimental procedures.
CBD: Common bile duct; MRI: Magnetic resonance imaging; TBO: Total biliary obstruction; TSB: Total serum bilirubin; μ-cholangiography: Microcholangiography.
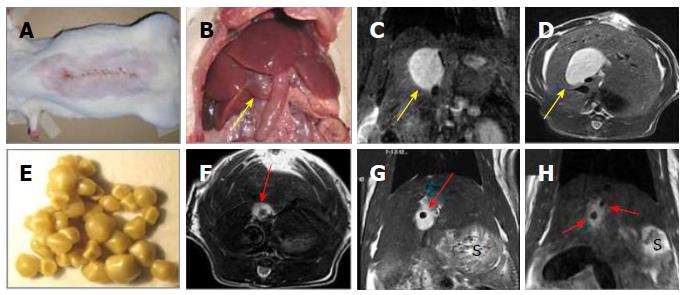
Figure 2 Creation of a rat model of cholelithiasis.
A: Midline abdominal incision for CBD ligation; B: Laparotomy to expose the cholestasis-induced VGB (arrow); C: Coronal plane of T2-w MRI displaying an oval-shaped hyperintense dilated CBD or a VGB (arrow); D: Axial plane of T2-w MRI displaying the same oval-shaped hyperintense VGB (arrow); E: Gallstones from patients of cholelithiasis derived by cholecystectomy; F: Axial plane of T2-w MRI showing the same case in D but now implanted with a human gallstone (arrow); G: Coronal plane of T2-w MRI displaying the same case in F with a gallstone (arrow); H: Coronal plane of T2-w MRI two hypointense gallstones (arrows) located in a hyperintense VGB in another case. S denotes stomach on MR images. CBD: Common bile duct; VGB: Virtual gallbladder; MRI: Magnetic resonance imaging.
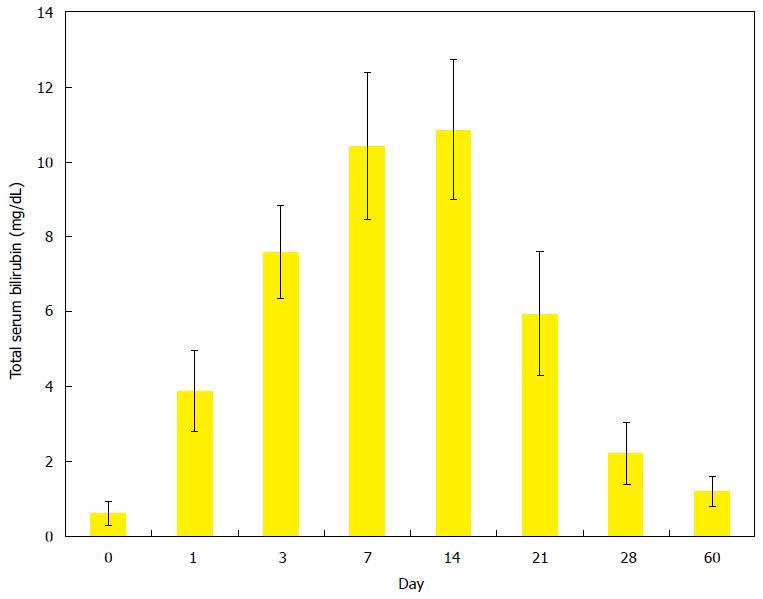
Figure 3 Evolving changes of total serum bilirubin levels in rats after ligation of common bile duct to induce a rat model of virtual gallbladder and cholelithiasis.
Total bilirubin levels reached the highest values between the days 7 and 14 that and then rapidly dropped to the values close to the normal range after day 28 till day 60.
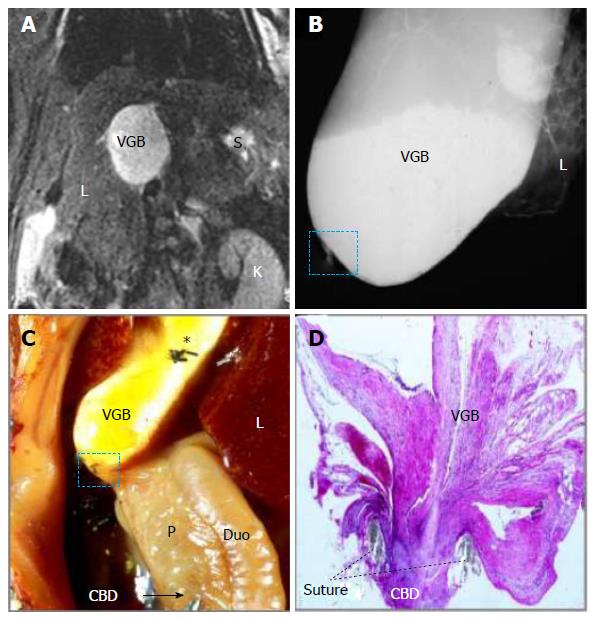
Figure 4 Magnetic resonance imaging, microcholangiography and histomorphology of a rat on day 14 after surgically induced cholestasis towards creating a model of virtual gallbladder.
A: Coronal T2-w MRI shows an oval-shaped hyperintense dilated CBD or VGB with L, K and S denoting the liver, kidney and stomach respectively; B: Digital microcholangiography displays a hyperdense dilated CBD or VGB with L denoting the liver; C: Laparotomic view shows the dilated CBD or VGB with L, P and Duo denoting the liver, pancreas and duodenum respectively; note the transparent distal CBD as indicated by a needle tip and an arrow, suggesting absent bile flow, and asterisk indicates where the needle hole was closed by suture ligation; D: Photomicrograph of hematoxylin and eosin stained slide of the ligature (dashed square on B and C) shows a complete CBD obstruction separating the VGB and distal CBD (original magnification × 100). MRI: Magnetic resonance imaging; CBD: Common bile duct; VGB: Virtual gallbladder.
Figure 5 Magnetic resonance imaging, microcholangiography and histomorphology of a rat on day 60 after surgically induced cholelithiasis.
A: Coronal T2-w MRI shows a hypointense gallstone located in a hyperintense VGB and distal nondilated CBD as a hyperintense line with L and S denoting the liver and stomach; B: Digital microcholangiography displays both the hyperdense VGB and distal nondilated CBD bridged in-between by an pancreatic ductule with P denoting the pancreas; C: Macroscopy views the VGB with L denoting the liver, note the distal nondilated and barium-filled CBD imbedded in the pancreas (P) and a branching ductule bridging the ligation between the proximal and distal CBD, suggesting resumed bile flow, asterisk indicates where the needle hole was closed by suture ligation; D: Photomicrograph of hematoxylin and eosin stained slide of the distal CBD near the ligature (dashed square on B and C) demonstrates multiple proliferated glandular ductules (arrows) that contribute to the eventual bypass of the biliary obstruction between the VGB and distal CBD (original magnification × 100). MRI: Magnetic resonance imaging; CBD: Common bile duct; VGB: Virtual gallbladder; PD: Pancreatic duct.
- Citation: Cona MM, Liu Y, Yin T, Feng Y, Chen F, Mulier S, Li Y, Zhang J, Oyen R, Ni Y. Rat model of cholelithiasis with human gallstones implanted in cholestasis-induced virtual gallbladder. World J Methodol 2016; 6(2): 154-162
- URL: https://www.wjgnet.com/2222-0682/full/v6/i2/154.htm
- DOI: https://dx.doi.org/10.5662/wjm.v6.i2.154


