Copyright
©The Author(s) 2016.
World J Methodol. Jun 26, 2016; 6(2): 154-162
Published online Jun 26, 2016. doi: 10.5662/wjm.v6.i2.154
Published online Jun 26, 2016. doi: 10.5662/wjm.v6.i2.154
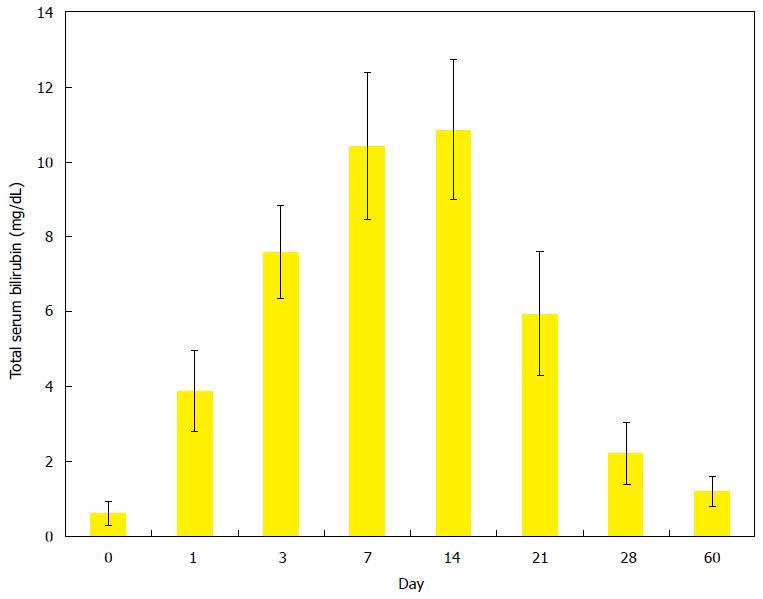
Figure 3 Evolving changes of total serum bilirubin levels in rats after ligation of common bile duct to induce a rat model of virtual gallbladder and cholelithiasis.
Total bilirubin levels reached the highest values between the days 7 and 14 that and then rapidly dropped to the values close to the normal range after day 28 till day 60.
- Citation: Cona MM, Liu Y, Yin T, Feng Y, Chen F, Mulier S, Li Y, Zhang J, Oyen R, Ni Y. Rat model of cholelithiasis with human gallstones implanted in cholestasis-induced virtual gallbladder. World J Methodol 2016; 6(2): 154-162
- URL: https://www.wjgnet.com/2222-0682/full/v6/i2/154.htm
- DOI: https://dx.doi.org/10.5662/wjm.v6.i2.154


