
















Copyright: ©Author(s) 2026.
World J Psychiatry. Nov 19, 2026; 16(11): 123981
Published online Nov 19, 2026. doi: 10.5498/wjp.123981
Published online Nov 19, 2026. doi: 10.5498/wjp.123981

Figure 1 Flowchart of participant selection in the National Health and Nutrition Examination Survey 2005-2014 cycles.
NHANES: National Health and Nutrition Examination Survey; TyG-ABSI: Triglyceride-glucose index combined with a body shape index.
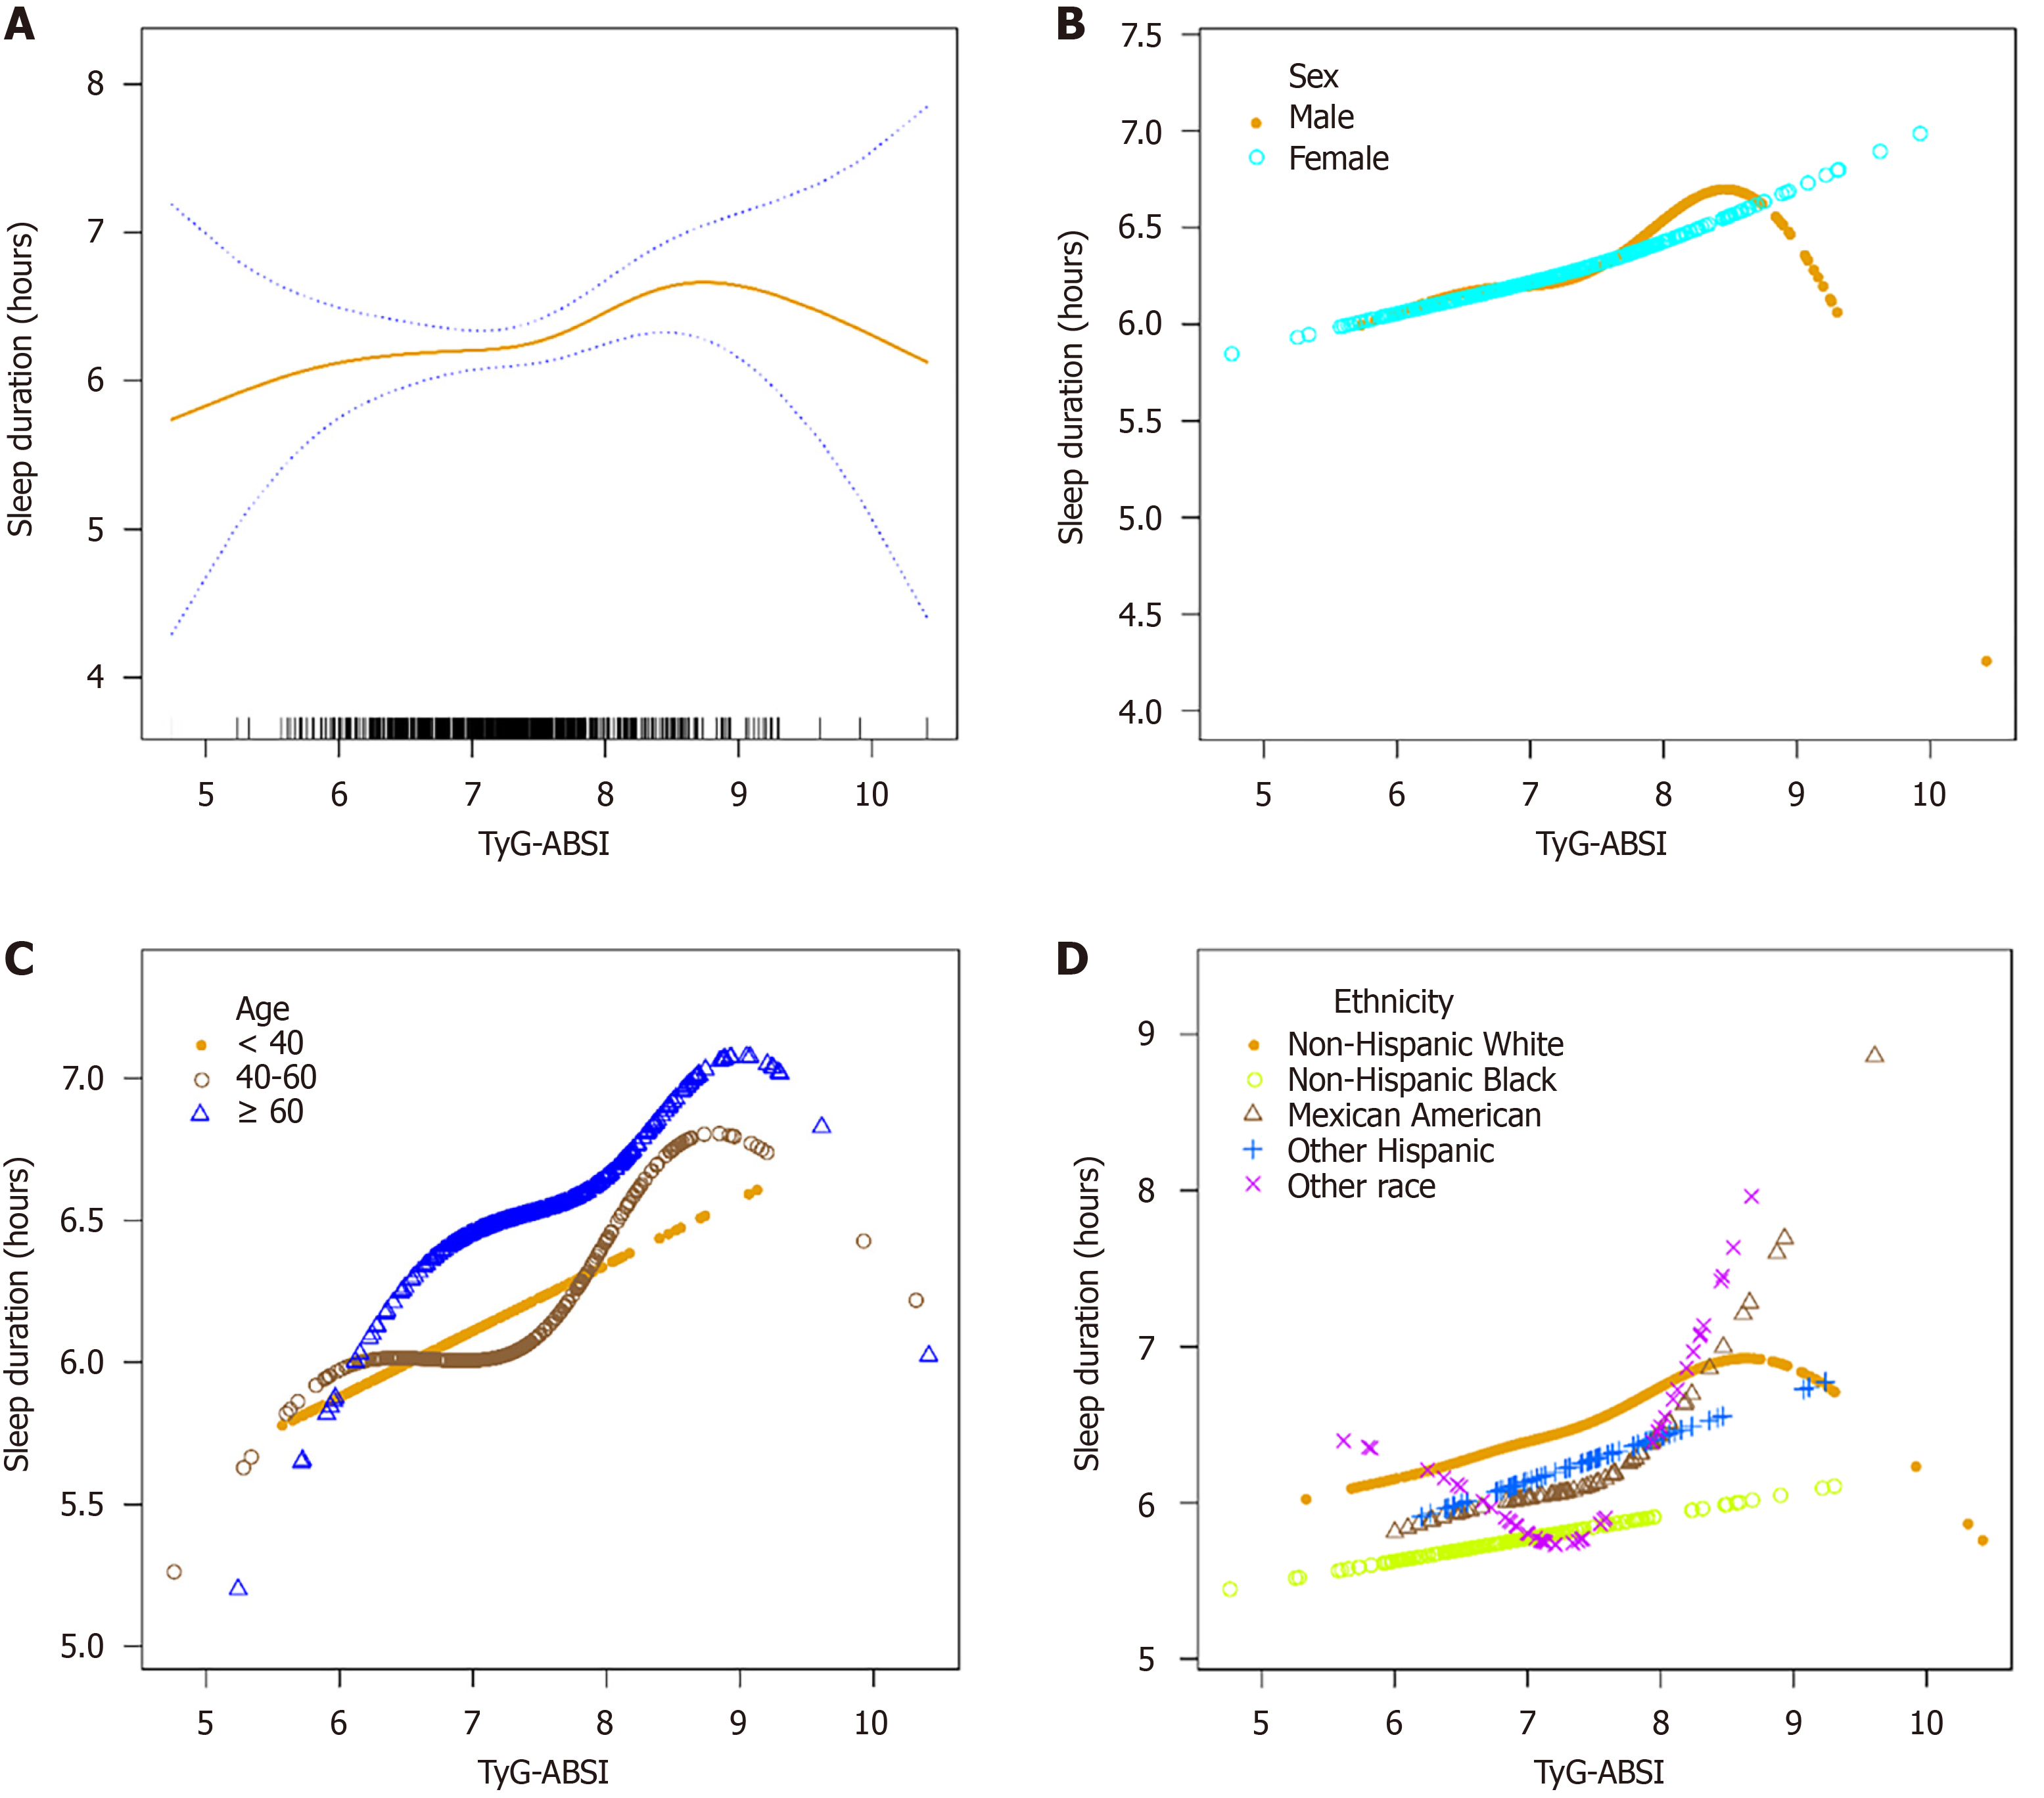
Figure 2 Restricted cubic spline associations between triglyceride-glucose index combined with a body shape index and sleep duration in the overall population and demographic subgroups.
A: Overall population; B: Analyses stratified by sex; C: Analyses stratified by age group; D: Analyses stratified by race. Solid lines represent the estimated associations, and dashed lines indicate the corresponding 95%CIs. TyG-ABSI: Triglyceride-glucose index combined with a body shape index.
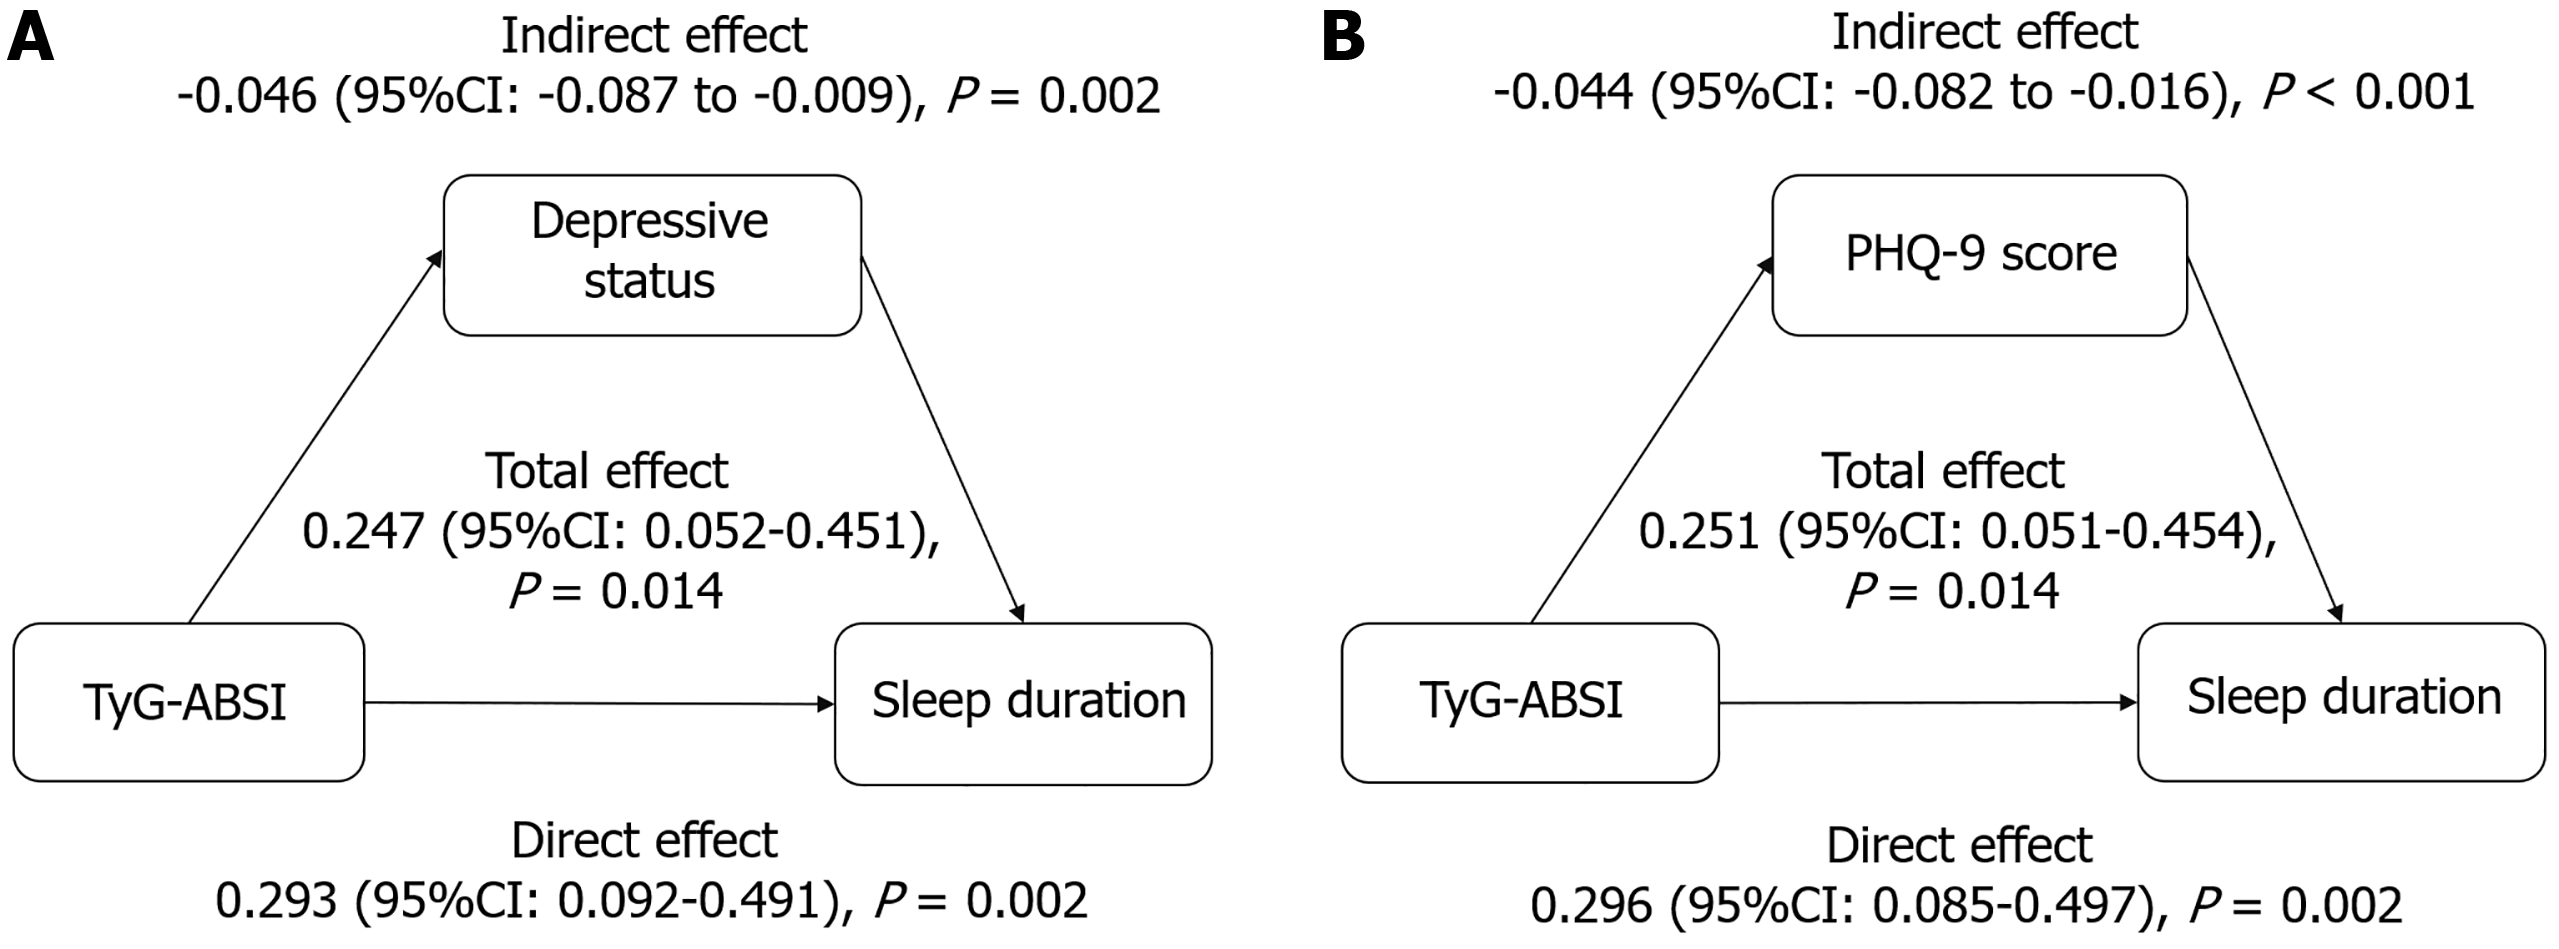
Figure 3 Total, direct, and indirect effects of depressive symptoms in the association between triglyceride-glucose index combined with a body shape index and sleep duration.
A: It shows the analysis using depressive status as a binary variable; B: It shows the analysis using the continuous Patient Health Questionnaire-9 score. Values are presented as effect estimates with 95%CIs and P values. TyG-ABSI: Triglyceride-glucose index combined with a body shape index; PHQ-9: Patient Health Questionnaire-9.
- Citation: Zhang YC, Yu ZZ, Zheng WT, Wang C. Triglyceride-glucose index combined with a body shape index in relation to sleep problems and sleep duration. World J Psychiatry 2026; 16(11): 123981
- URL: https://www.wjgnet.com/2220-3206/full/v16/i11/123981.htm
- DOI: https://dx.doi.org/10.5498/wjp.123981